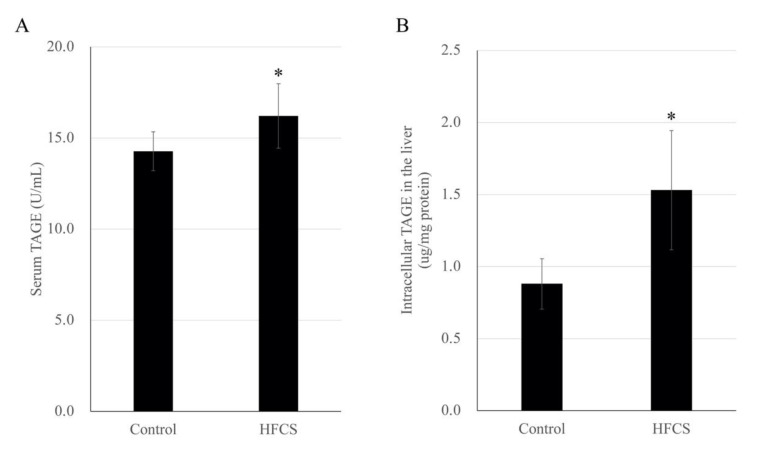
Figure 2.
Quantitative analysis of serum toxic advanced glycation end product (TAGE) levels (A) and intracellular TAGE levels in the liver (B) in the high-fructose corn syrup (HFCS) and control groups of rats. Data are presented as the mean ± standard deviation (n = 10). * p < 0.05 HFCS versus control group (Mann-Whitney U-test).

