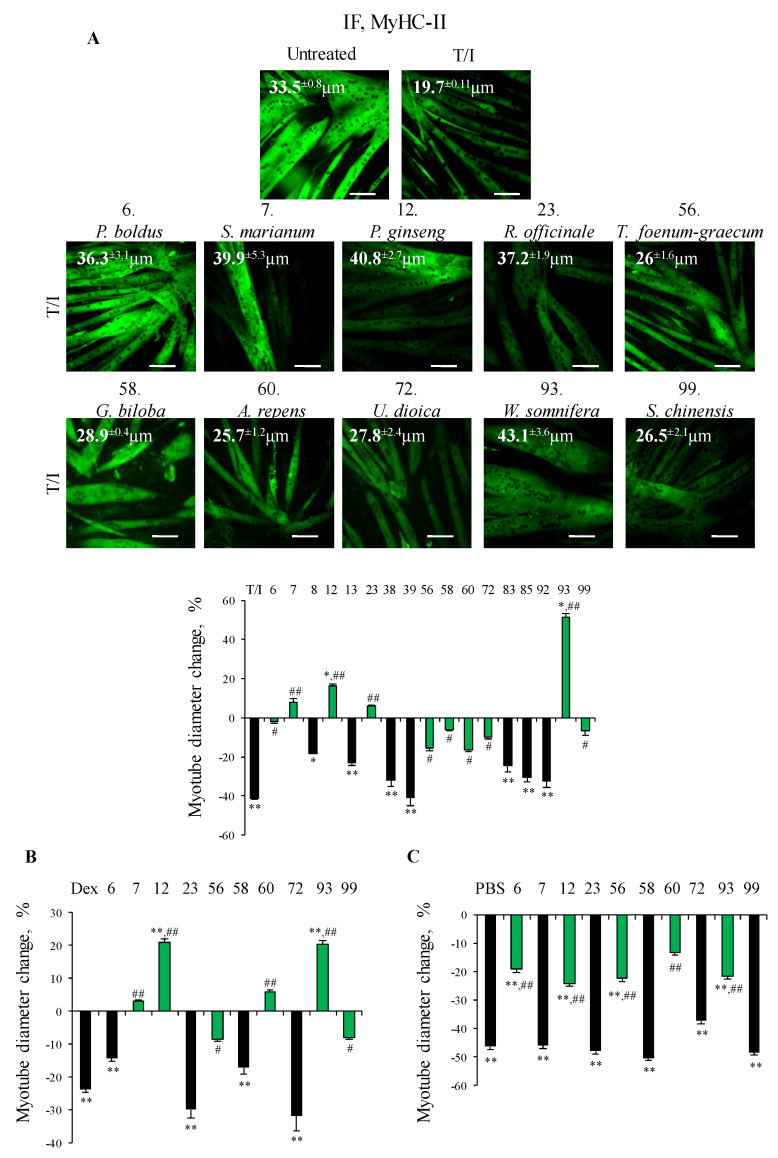
Figure 1.
(A–C) C2C12 myotubes were treated or not with TNFα (tumor necrosis factor α, 20 ng/mL)/IFNγ (interferon γ, 100 U/mL) (T/I), dexamethasone (Dex, 1 µM) or starved with PBS (phosphate buffered saline) in the absence or presence of each selected plant extracts for different times. Immunofluorescence (IF) analysis for myosin heavy chain (MyHC)-II was performed after 48 h or 16 h (PBS), and myotube diameters were measured by Image J software. Reported are representative images with myotube diameters (µm) (A) and the percentages of myotube diameters with respect to untreated control (A–C). The green bars represent the extracts able to protect against myotube atrophy induced by different stimuli. Results are means ± SEM (standard error of the mean) (A–C). Statistical analysis was conducted using t-test * p < 0.05, ** p < 0.01 significantly different from untreated control; # p < 0.05 and ## p < 0.01 significantly different from T/I, Dex or PBS. Bars, 100 µm.

