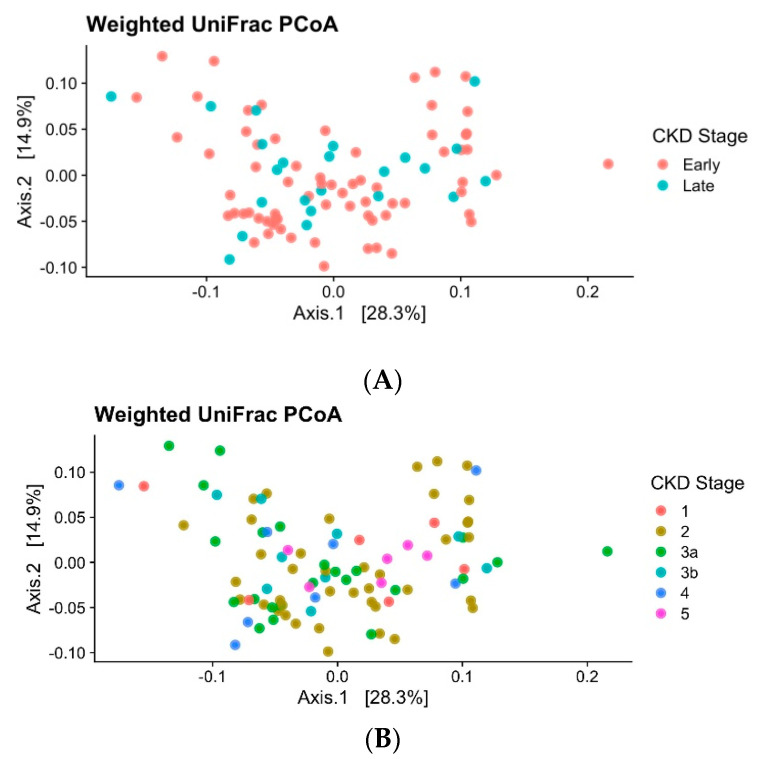
Figure 2.
(A) Principal coordinate analysis (PCoA): Ordination plots display the dissimilarity of the gut bacterial community from individuals with CKD. Plots are labelled to show CKD grouped into classifications of early (1 to 3a) and late (3b to 5) stages. Data were based on weighted UniFrac of log-transformed relative abundances. (B) Ordination plots display the dissimilarity of the gut bacterial community from individuals with CKD. Plots are labelled to show CKD at fine-scale groups. Data were based on weighted UniFrac of log-transformed relative abundances.

