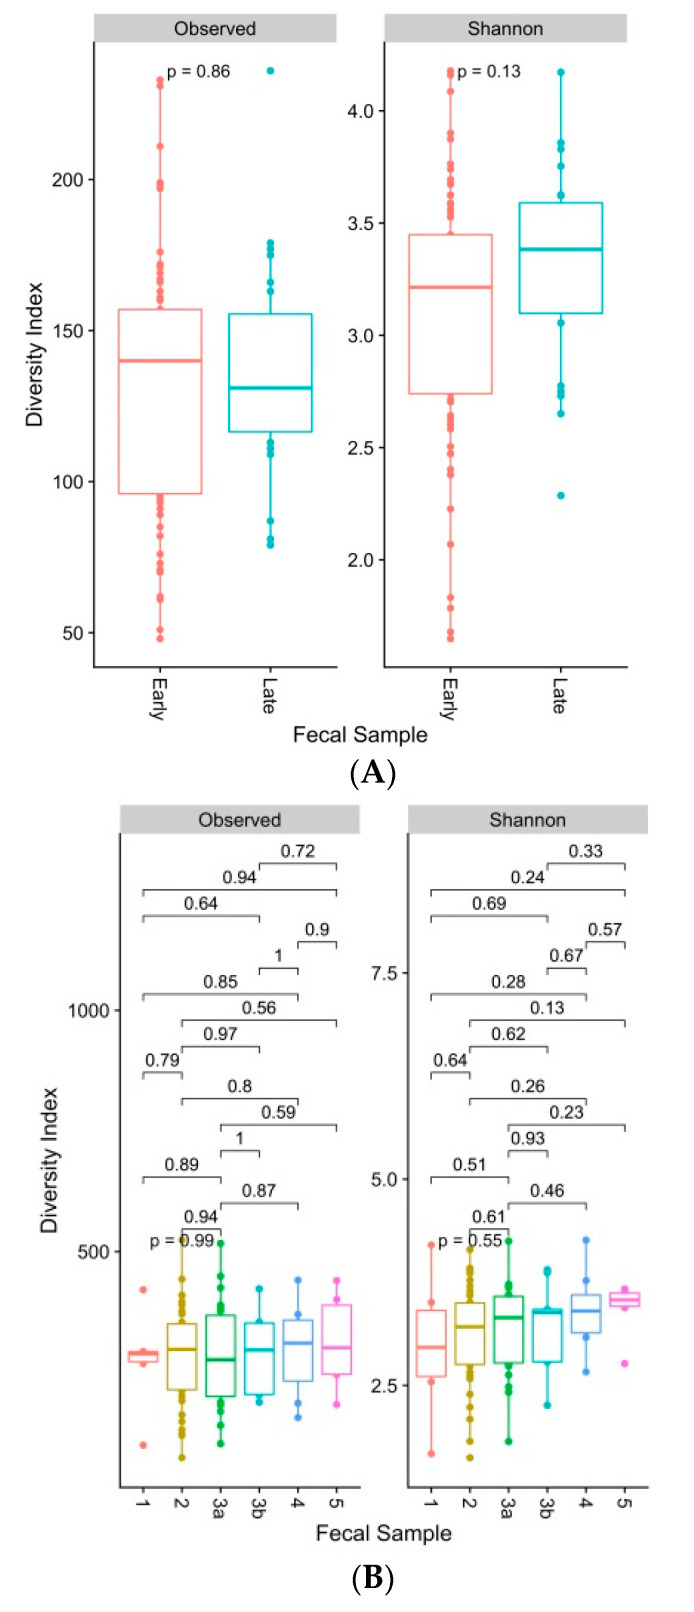
Figure 3.
(A). Box and whiskers plots display number of observed bacterial operational taxonomic units (OTUs) and Shannon’s diversity index of faecal samples grouped by individuals with early (1 to 3a) and late (3b to 5) stages of CKD. Boxes represent the interquartile range (IQR) between the first and third quartiles (25th and 75th percentiles, respectively) and the horizontal line inside the box defines the median. Whiskers represent the lowest and highest values within 1.5 times the IQR from the first and third quartiles, respectively. Solid dots (●) outside the whiskers indicate greater than 1.5 times and less than 3 times the IQR. Indices were generated from raw, untrimmed, rarefied data. Significance testing between groups were conducted using a Kruskal-Wallis Test. Results were considered significant where p ≤ 0.05. (B). Box and whiskers plots display number of observed bacterial operational taxonomic units (OTUs) and Shannon’s diversity index of faecal samples grouped by individuals at CKD stages 1, 2, 3a, 3b, 4, and 5. Boxes represent the interquartile range (IQR) between the first and third quartiles (25th and 75th percentiles, respectively) and the horizontal line inside the box defines the median. Whiskers represent the lowest and highest values within 1.5 times the IQR from the first and third quartiles, respectively. Solid dots (●) outside the whiskers indicate greater than 1.5 times and less than 3 times the IQR. Indices were generated from raw, untrimmed, rarefied data. Significance testing between groups were conducted using a Kruskal-Wallis Test. Results were considered to be significant where p ≤ 0.05.

