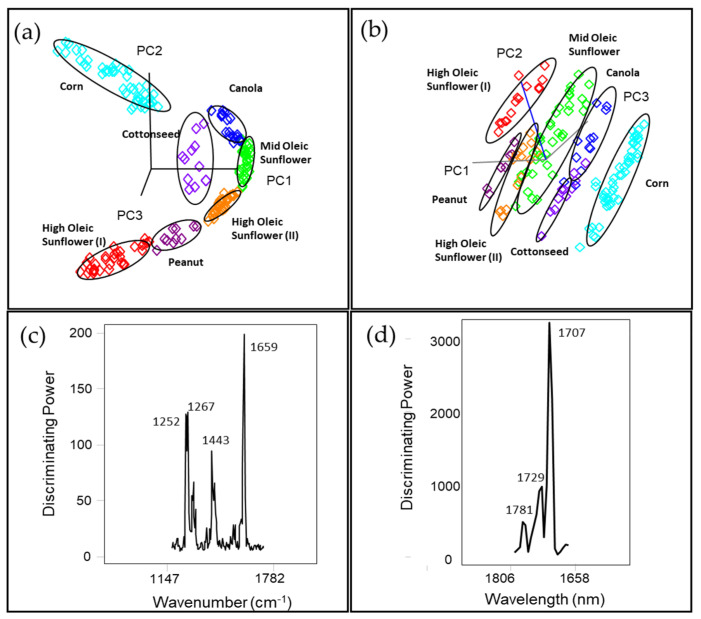
Figure 3.
Soft Independent Model of Class Analogies (SIMCA) 3D projection plots of spectral data for potato chip oil samples collected by (a) a handheld Raman spectrometer (1064 nm) and (b) a miniature near Infrared (NIR) sensor. (c) Discriminating plots of Raman and (d) NIR SIMCA models showing bands and regions responsible for class separation.

