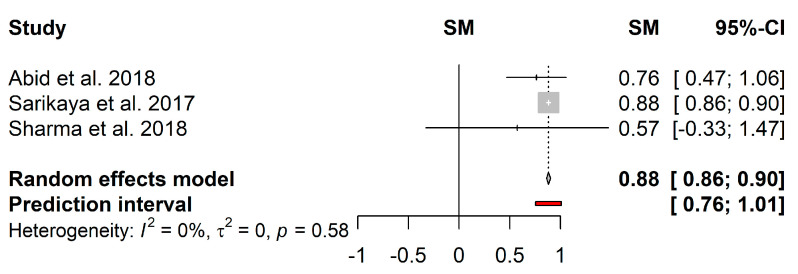
Figure 6.
Forest plot of the pooled effect estimates for the proportion of biofilm reduction induced by EPS. The vertical dashes represent the effect estimate, and the horizontal line is the respective confidence interval at 95% (95%–CI) obtained for each study. Gray squares represent the standard deviation of each study, while the gray diamond represents the pooled effect estimates. The red bar represents the predictive interval. Heterogeneity test: I2–I2 test; τ2–Tau-squared test.

