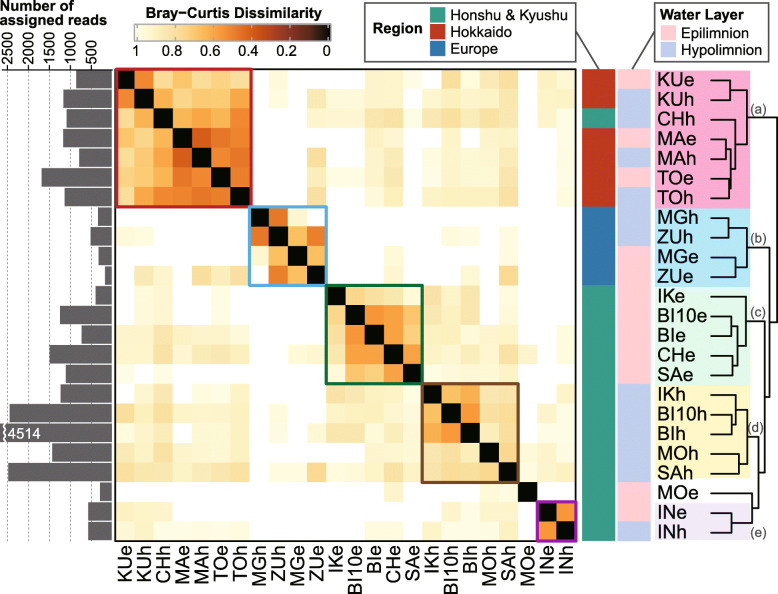
Fig. 5.
Clustering of samples based on the Bray–Curtis dissimilarity of amplicon sequence variant composition generated by averaging the values for the 11 most dominant lineages. The matrices for individual lineages are provided in Fig. S3. Sample names follow the abbreviations shown in Fig. 1, with a suffix indicating the water layer: e, epilimnion; h, hypolimnion. The temporal replicate collected in Lake Biwa in 2010 is abbreviated “BI10.” Five clusters were identified, grouping samples from a Hokkaido, b Europe, c Honshu and Kyushu epilimnia, d Honshu and Kyushu hypolimnia, and e Lake Inawashiro. The total number of reads assigned to each sample is shown by the bar graph on the left (the original data is available in Supplementary Dataset)

