Abstract
Antisense oligonucleotides (ASOs) have emerged as a new class of drugs to treat a wide range of diseases, including neurological indications. Spinraza, an ASO that modulates splicing of SMN2 RNA, has shown profound disease modifying effects in Spinal Muscular Atrophy (SMA) patients, energizing efforts to develop ASOs for other neurological diseases. While SMA specifically affects spinal motor neurons, other neurological diseases affect different central nervous system (CNS) regions, neuronal and non-neuronal cells. Therefore, it is important to characterize ASO distribution and activity in all major CNS structures and cell types to have a better understanding of which neurological diseases are amenable to ASO therapy. Here we present for the first time the atlas of ASO distribution and activity in the CNS of mice, rats, and non-human primates (NHP), species commonly used in preclinical therapeutic development. Following central administration of an ASO to rodents, we observe widespread distribution and target RNA reduction throughout the CNS in neurons, oligodendrocytes, astrocytes and microglia. This is also the case in NHP, despite a larger CNS volume and more complex neuroarchitecture. Our results demonstrate that ASO drugs are well suited for treating a wide range of neurological diseases for which no effective treatments are available.
INTRODUCTION
Antisense oligonucleotides (ASOs) are chemically modified single-stranded nucleic acids of 16–25 nucleotides in length that bind complementary RNA via Watson-Crick hybridization and can modulate the expression of genes by harnessing a variety of mechanisms (1). To reduce the expression of genes, ASOs can be designed to trigger the RNase H1 mechanism (2). RNase H1 recognizes the duplex formed between a DNA-containing ASO and complementary target RNA and cleaves the RNA, which is subsequently degraded by cellular nucleases. To confer drug-like properties such as enhanced binding affinity and nuclease resistance ASOs are chemically modified. Typically, this type of ASO, referred to herein as a ‘gapmer’, consists of a central stretch or ‘gap’ of 8–10 DNA nucleotides which is flanked on either side by 2–5 nucleotides with chemical modifications such as 2′-O-methoxyethyl (MOE), constrained ethyl, or locked nucleic acid. Additionally, the phosphodiester internucleotide linkages are replaced with phosphorothioate to further enhance the stability of ASOs to endogenous nucleases (3).
ASOs were first used in the early 1990s to help determine the functions of proteins in the CNS (4–6). However, the first unequivocal proof of ASO activity and disease modification in the CNS of an animal came in 2006 when a MOE-gapmer ASO targeted to SOD1 was administered to the CNS of a rat model of amyotrophic lateral sclerosis (ALS), resulting in SOD1 mRNA reduction and significant slowing of disease progression (7). This work set the stage for an era in which ASOs have been used effectively in a wide range of neurological disease animal models. Over the years, centrally administered ASOs have demonstrated widespread CNS tissue distribution, activity, and substantial phenotypic prevention and/or reversal in mouse models of Huntington's (8), SMA (9), Frontotemporal dementia (10), Parkinson's (11), TDP-43- and C9orf72-linked ALS (12), Alexander disease (13), Pelizaeus-Merzbacher disease (14), Prion disease (15), and multiple forms of Spinocerebellar Ataxia (16–18). Most of these studies were performed with MOE-gapmer ASOs, which is the ASO design that is most commonly being used in the clinic for neurological diseases (19,20). Pathology in each of these disease models is driven by distinct cell types in distinct regions of the brain or spinal cord, including neurons, astrocytes and oligodendrocytes. This work demonstrates that ASOs can effectively target a wide range of CNS regions and cell types in mice to produce disease-modifying effects.
In larger preclinical species such as rats and NHPs, we have previously demonstrated widespread distribution and activity of MOE-gapmer and uniform MOE ASOs in the CNS following central administration (8,21–24). Using a battery of live imaging techniques and postmortem analyses, MOE-gapmer ASOs were shown to immediately distribute into the cranium following intrathecal (IT) injection in the rat and penetrate all major CNS structures by 6 h post-injection (21,23). Cellular uptake took place between 6 and 24 h post-injection and stable regional and cellular distribution was observed from at least 1 to 14 days post-dosing. Reduction of target mRNA and protein was sustained for at least 4–16 weeks post-injection, depending upon the CNS region. Similarly, in NHP live imaging techniques and postmortem tissue analyses were used to demonstrate rapid, widespread and sustained ASO distribution into the cranium and brain parenchyma, and potent target RNA reduction across the CNS following IT administration via lumbar puncture of a MOE-gapmer ASO targeting the ubiquitously expressed Malat1 non-coding RNA (24).
The pattern of ASO distribution and activity in the CNS of preclinical species translates to the human CNS. The first ASO dosed into the human CNS was a MOE-gapmer ASO targeting SOD1, which was administered intrathecally by infusion at low, escalating dose levels in a Phase I study to test its safety and pharmacokinetics in SOD1-linked ALS patients (25). The accumulation of ASO in the CSF was dose-dependent and the concentration of the ASO in the spinal cord tissue obtained at autopsy was consistent with the expected tissue concentration based on preclinical studies in NHPs. In clinical trials for Spinraza, a uniform MOE ASO designed to modulate the splicing of SMN2 and developed for the treatment of SMA, intrathecal delivery resulted in accumulation of the ASO in neurons and glial cells in the spinal cord and cortex obtained at autopsy. In addition, target SMN2 mRNA and SMN protein levels were increased in spinal cord and cortex (26). Spinraza showed substantial efficacy in clinical trials, improving motor function and prolonging survival of SMA infants (27), and became the first centrally administered ASO to receive regulatory approval for human use (28). This was a clear demonstration that antisense technology could be applied to the CNS and provided strong motivation for a variety of other neurological diseases to be treated using this platform. Additionally, in clinical trials for a MOE-gapmer ASO targeting Huntingtin (HTT) for Huntington's disease, dose-responsive ASO concentrations and reductions in mutant HTT levels were observed in the CSF, as a surrogate for HTT level in CNS tissue, and a clear demonstration of pharmacodynamic ASO efficacy in humans (20). In a recent phase 1–2 trial in SOD1-ALS patients, IT administration of Tofersen, a MOE-gapmer ASO targeting SOD1, significantly reduced SOD1 concentrations in CSF and despite the low number of patients enrolled in the study showed a trend towards slowing disease progression in ASO-treated patients (19).
Although ASOs have been used successfully in a wide range of mouse models of neurological diseases and in larger preclinical species such as rat and NHPs, the field lacks a comprehensive catalog of ASO distribution and efficacy across all major CNS structures and cell types in preclinical species that would provide guidance for treatment of specific CNS diseases using this drug modality. In this study, we performed a complete characterization of ASO distribution and activity in all the major CNS regions and cell types of rodents and NHPs using a MOE-gapmer ASO targeted to the ubiquitously expressed non-coding RNA Malat1.
MATERIALS AND METHODS
ASO preparation
The lyophilized Malat1 ASO (ION-626112, Supplementary Table S1) was dissolved in sterile phosphate-buffered saline (PBS) without calcium or magnesium for experiments in mice and rats, and artificial cerebrospinal fluid (aCSF) for NHPs. The ASO was quantified by UV spectrometry and was sterilized by passage through a 0.2-mm filter before dosing.
Intracerebroventricular (ICV) administration of ASO in mice
All protocols met ethical standards for animal experimentation and were approved by the Institutional Animal Care and Use Committee of Ionis Pharmaceuticals. Wild-type female mice (n = 4 per group) were obtained from the Jackson Laboratory (C57BL/6J, stock number 000664; Bar Harbor, ME). For ICV bolus injections, mice were placed in a stereotaxic frame and anesthetized with 2% isoflurane by a nose cone fitted into the frame. The scalp and anterior back were then shaved and disinfected. A ∼1 cm incision was made in the scalp, and the subcutaneous tissue and periosteum were scraped from the skull with a sterile cotton-tipped applicator. A 10-μl Hamilton microsyringe with a 26 G Huber point removable needle was driven through the skull at 0.3 mm anterior and 1.0 mm lateral to bregma, and was lowered to a depth of 3 mm. Ten microliters of ASO solution was injected a single time into the right lateral ventricle at a rate of 1 μl/s. After 3 min, the needle was slowly withdrawn, and the scalp incision was sutured. The mice were then allowed to recover from the anesthesia in their home cage.
Intrathecal (IT) administration of ASO in rats
Intrathecal administrations of ASOs in rats were performed, under a protocol approved by the Institutional Animal Care and Use Committee of Ionis Pharmaceuticals. Male Sprague-Dawley rats (n = 4 per group) with body weights between 0.25 and 0.35 kg were obtained from Harlan laboratories (Sprague Dawley, stock number 213M, Livermore, CA). Catheterization of the lumbar intrathecal space was performed as described in Mazur et al. (29). Thirty microliters of either ASO dosing solution or vehicle followed by 40 μl of aCSF vehicle was injected into the subarachnoid intrathecal space via the catheter over approximately 30 s. The animals recovered from anesthesia in their home cage on clean bedding.
Intrathecal (IT) administration of ASO in nonhuman primates
NHP studies were performed at Charles River Laboratories Montreal ULC and were approved by their Institutional Animal Care and Use Committee. Six adult female cynomolgus monkeys weighing 2.4 ± 0.2 kg were anesthetized with a ketamine/dexmedetomidine/glycopyrrolate cocktail and a reversal agent, atipamezole, was given following the completion of dosing. On Day 1, 14 and 28 artificial cerebrospinal fluid or 25 mg of Malat1 ASO was administered via percutaneous intrathecal injection using a spinal needle at the lumbar level (target L4/L5 space). The dose volume was fixed for all injections at 1 ml and administered over 1 min as a slow bolus. Animals were dosed in lateral recumbency position and remained in a prone position for at least 15 min following dosing prior to the administration of the reversal agent.
Tissue harvesting
Mice and rats were euthanized 2 weeks after the ASO injection and NHP euthanized 2 weeks after administration of the last dose. Frozen brain and spinal cord tissues were harvested for the determination of ASO concentration and target mRNA expression. Tissues were also immersion fixed in 10% buffered formalin solution for histological processing.
Real-time RT-PCR
The tissues were homogenized in RLT buffer (Qiagen, Valencia, CA), and 1% (v/v) b-mercaptoethanol. Homogenization was performed for 20 s at 6000 rpm using a FastPrep Automated Homogenizer (MP Biomedicals). Total RNA was then isolated using the RNeasy 96 Kit (Qiagen, Germantown, MD) that included an in-column DNA digestion with 50 U of DNase I (Invitrogen). Real-time RT-PCR was performed with the EXPRESSS One-Step SuperScript qRT-PCR kit (Thermo Fisher Scientific) using gene-specific primers (Supplementary Table S2) (IDT technologies, Coralville, IA). For ASO treated animals the expression level of Malat1 was normalized to that of Gapdh, or Ppia (Cyclophilin A) and this was further normalized to the level in vehicle treated animals.
Analysis of tissue levels of Malat1 ASO
Samples were weighed, minced, and homogenized with homogenization buffer (20 mM Tris pH 8, 20 mM EDTA, 0.1 M NaCl, 0.5% NP40) and beads (Matrix Green, Bio 101 No. 6040-801) in a 96-well format plate. A calibration curve and quality control samples of known ASO concentrations were prepared in normal homogenized brain and analyzed on the same plate. The ASO was extracted from the tissue, calibration curve, and QC samples via a liquid–liquid extraction using ammonium hydroxide and phenol:chloroform:isoamyl alcohol (25:24:1) (Sigma- Aldrich, St. Louis, MO) and the aqueous layer was then further processed. The ASO concentration in mouse samples was measured by HELISA (30). Briefly, the aqueous layer was evaporated to dryness and reconstituted in normal K2 EDTA human plasma (Bioreclamation). Reconstituted tissue, calibration curve, and QC samples were further diluted in normal human plasma, as necessary, and analyzed via a hybridization ELISA method, on a Molecular Devices Spectramax Gemini XPS (Sunnyvale, CA). The ASO concentration in rat and NHP samples were analyzed by LCMS as previously described (31). The aqueous layer was processed via solid phase extraction with a Strata X plate. Eluates were passed through a protein precipitation plate before drying down under nitrogen at 50°C. Dried samples were reconstituted in 140 μl water containing 100 μM EDTA and were run on an Agilent 6130B single quadrupole LCMS.
Isolation of CNS cell types from mice
For isolation of cellular subtypes, mice were deeply anesthetized with 3% isoflurane and transcardially perfused with ice-cold PBS (Gibco 14190). A 2-mm piece of cortex ipsilateral to the injection site was dissected and stored at −80°C until RNA extraction. Remaining cortex from ipsilateral and contralateral sides were dissected and stored in ice-cold Hibernate E (Brain Bits) until being subjected to enzyme digestion to generate single cell suspensions according to the Adult Brain Dissociation Kit (Miltenyi Biotec, 130-107-677). Myelin was removed from the samples using myelin removal beads (Miltenyi Biotec, 130-096-733). Neuron isolation kit (130-098-752), Anti-ACSA-2 microbead kit (130-097-678), CD11b (microglia) microbeads (130-093-634) and Anti-O4 microbeads (130-094-543) were used for magnetic isolation of neurons, astrocytes, microglia and oligodendrocytes, respectively. Cell viability was determined to be >90% using Vi-Cell XR cell viability analyzer with trypan blue dye exclusion method (data not shown). Isolated cells were suspended in 300 μl of 1% BME/RLT and frozen at −80°C until RNA extraction.
Histology
After the mouse and rat brains were removed, they were bisected sagitally at the midline then immersion fixed in 10% Neutral Buffered Formalin (Statlab, 28600-1) for 24–48 h. 5 mm thick sections of NHP brains were harvested, and immersion fixed for 24–48 h in 10% neutral Buffered Formalin. After fixation, the brain tissue was transferred to 70% alcohol and processed into Paraplast Plus paraffin (Leica, 39602004) overnight on a Sakura Tissue Tek tissue processor. After processing the mouse and rat brains, they were embedded in a sagittal orientation into Paraplast Extra paraffin (Leica 39603002). Tissue sections were cut at 4 μm and mounted on positively charged slides (Millennia 1000, Statlab, M1000W). The slides were air dried overnight and then dried at 60°C in a slide drying oven for 1 h prior to staining.
ASO immunohistochemistry
Slides were deparaffinized and hydrated to water then stained on the Thermo/Labvision Auto-stainer. Sections were incubated in Endogenous Peroxidase Blocker (DAKO, S2003) for 10 min. Followed by proteolytic digestion with Proteinase-K (DAKO S3020) for 1 min. Additional blocking was done with Background Buster (Innovex, NB306) for 30 min. Slides were then incubated with the primary antibody, a polyclonal rabbit anti-ASO antibody (8) at a dilution of 1:10 000 (diluted in 2% bovine serum albumin, 5% donkey serum) for 1 h. A secondary antibody Donkey anti Rabbit HRP (Jackson, 711-036-152) was applied for 30 min. Liquid DAB+ Substrate Chromogen System (Dako, K3468) was used to visualize the ASO antibody. Slides were counterstained with Hematoxylin for 30 s then dehydrated, cleared, and coverslipped with Micromount (Leica, 3801731).
Colorimetric in situ hybridization
In situ hybridization for Malat1 RNA was performed on a Leica Bond RX with a RNAScope custom species-specific probe from Advanced Cell Diagnostics (ACD). The DapB negative control and PPIB positive control probes were used for quality control of the staining procedure. Hybridization was performed using RNAScope 2.5 LS Reagents Red kit (ACD, 322150). After hybridization the probes were detected with BOND Polymer Refine Red Detection kit (Leica, DS9390). Slides were counterstained with Hematoxylin for 30 s then dehydrated, cleared, and coverslipped with Micromount (Leica, 3801731).
Multiplexed fluorescent in situ hybridization
Double in situ hybridization was performed on a Leica Bond RX with RNAScope custom species-specific probes from ACD. Mouse Malat1 C1 probe was multiplexed with the following mouse C2 probes; Gja1 (astrocytes), Mog (oligodendrocytes), Rbfox3 (neurons) and Tmem119 (microglia) (Supplementary Figures S1 and S2). The DapB negative control and PPIB positive control probes were used for quality control of the staining procedure. The RNAScope LS Multiplex Fluorescent Reagent Kit (ACD, 322800) was used during hybridization. Malat1 was detected with a Cy3 and the C2 probes were detected with a Cy5. After labeling slides were rinsed in distilled water, and coverslipped with FluoroGell II with DAPI (EMS, 17985-50) for staining of nuclei. The slides were then imaged on an EVOS2 microscope (Thermo Fisher).
Data analysis
The ED50 was calculated using GraphPad Prism version 6.0 or higher (GraphPad Software, San Diego, CA) after fitting the data using nonlinear regression with normalized response and variable slope. A comparison of the uptake of ASO into CNS tissues between species was accomplished using dose administered, CSF volume, and ASO concentration in CNS tissues. ASO is cleared from the CSF space by presumably 2 mechanisms, (i) bulk flow of ASO to systemic circulation driven by CSF formation/reabsorption and (ii) uptake of ASO into tissues. The initial concentrations in CSF was estimated using the dose administered divided by the CSF volume (dose/CSF volume) which represents the CNS tissues exposure to ASO and should be a good indicator of uptake into CNS tissues and should be independent of the ASO clearance mechanisms. A linear regression analysis was performed on each species (mouse and rat) and tissue (spinal cord and cortex) combination on a log-log plot of ASO concentration versus dose/CSF volume. To account for the difference in the dose/CSF volume values between species and allow comparisons between the concentrations, a bootstrap analysis was performed to estimate the distribution of predicted ASO concentration values at the dose/CSF volume value of the observed NHP data (75 mg [total dose]/15 ml CSF volume). A large resampling data set (n = 200) was used to estimate the 95% confidence interval across the range of values, while a smaller set (n = 24, cortex; n = 12, cord) was used to generate a set of data for comparison to observed values. A one-factor ANOVA analysis as well as an all-pairwise t-test multi-comparison test was performed on each set of tissue data.
RESULTS
ICV bolus injection of Malat1 ASO results in widespread ASO distribution and target reduction in mice
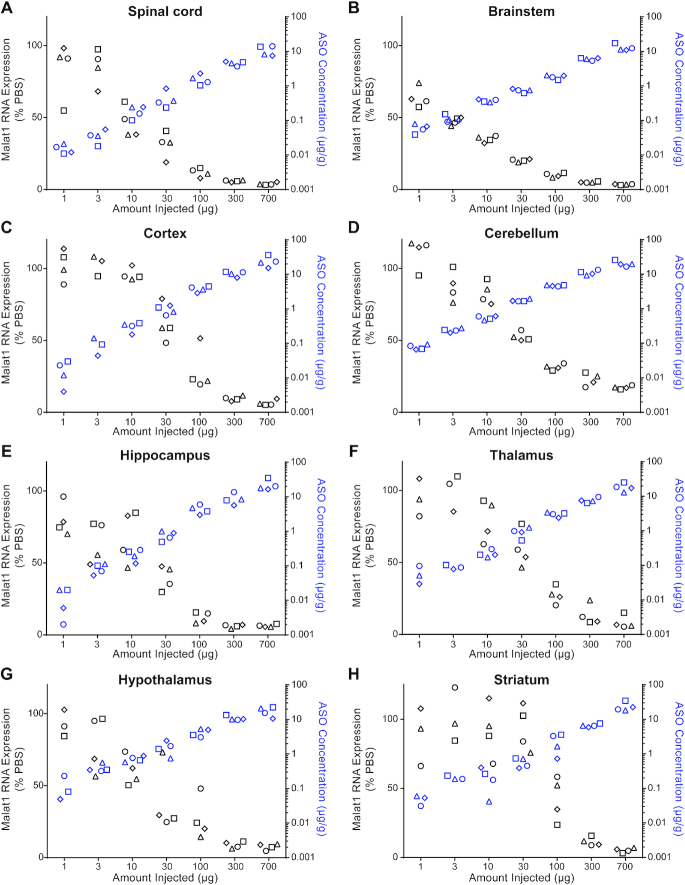
To evaluate the ASO distribution and activity in the mouse CNS, we identified an ASO that targets Malat1. Malat1 is a ubiquitously expressed long non-coding RNA that localizes in the nucleus and has previously been used to study the organ and cell type activity of ASOs administered systemically (32). We administered increasing doses of a Malat1 5–10–5 MOE-gapmer ASO to adult female mice by a single ICV bolus injection. During the two weeks post treatment all animals had normal home cage behavior and their weight gain was comparable to the control animals (data not shown). Two weeks after the injection, we measured the level of Malat1 RNA and the ASO concentration in a variety of CNS regions (Figure 1, Supplementary Table S3). A dose-dependent reduction of Malat1 RNA was observed in all CNS regions tested and the degree of RNA reduction was correlated with the amount of ASO in the tissue (Figure 1A–H and Supplementary Figure S3). Administration of the Malat1 ASO did cause microglia or astrocyte activation since Aif1 or Gfap were not induced (Supplementary Figure S4).
Figure 1.
Dose responsive Malat1 RNA reduction and ASO accumulation in mouse CNS tissue. Real-time RT-PCR analysis and the Malat1 ASO tissue concentration (black and blue symbols respectively) are plotted for each animal in each dose for (A) spinal cord, (B) brainstem, (C) cortex, (D) cerebellum, (E) hippocampus, (F) thalamus, (G) hypothalamus and (H) striatum. Malat1 ASO concentrations for all CNS regions for the doses 1, 3, 10 and 30 μg were measured by HELISA and for the doses 100, 300 and 700 μg were measured by LC/MS. The left Y axis is for RNA levels which are plotted as % PBS control and the right Y axis is for ASO concentrations which are plotted as μg ASO per gram of tissue. PBS, phosphate-buffered saline.
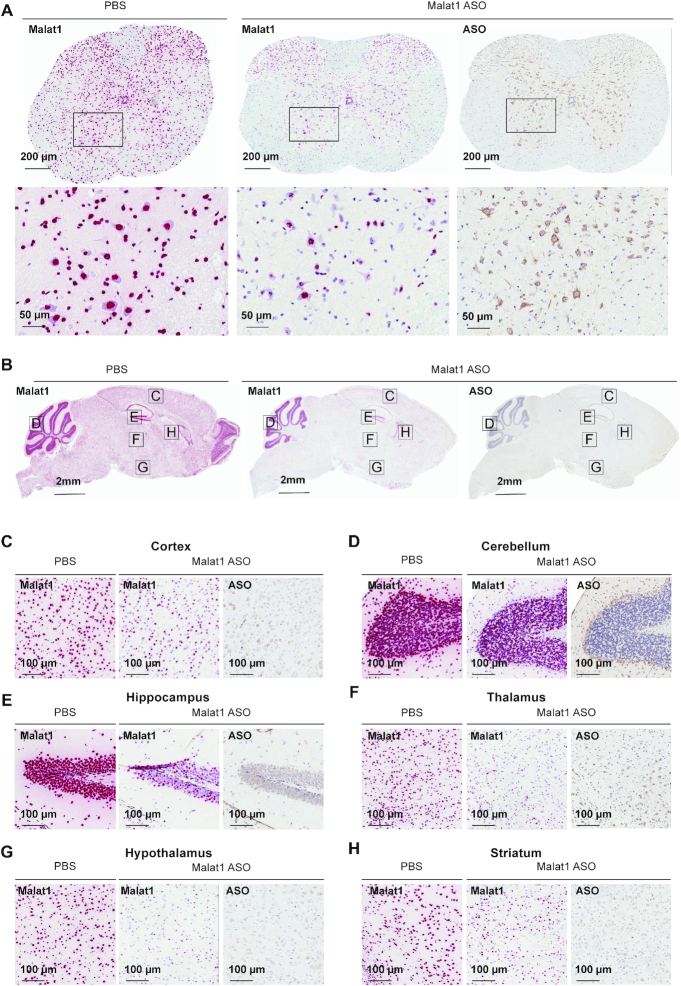
Bulk RNA measurements from tissues lack detailed information about the targetability at the sub-regional and cellular level in the CNS. Therefore, to evaluate Malat1 RNA reduction throughout the mouse CNS in more detail, we performed Malat1 in situ hybridization (ISH) on brain and spinal cord tissue sections from mice treated with 300 μg of Malat1 ASO. Similar to the qPCR data in Figure 1, ISH data showed that Malat1 RNA was reduced throughout the mouse CNS in all brain regions (Figure 2A–H). IHC staining with a specific ASO antibody (Supplementary Figure S5) showed broad distribution throughout the mouse CNS (Figure 2A–H). In the cerebellum, ISH showed that Malat1 RNA was efficiently reduced in Purkinje cells and the molecular layer of the cerebellum. In contrast, the granular layer of the cerebellum showed much less Malat1 reduction (Figure 2D; Supplementary Figure S6). Accordingly, the IHC staining for ASO showed a greater amount of ASO in the molecular and Purkinje cell layers compared to the granular layer. These results demonstrate that ICV administration of the Malat1 ASO results in broad distribution and dose-dependent target reduction in most CNS regions of mice.
Figure 2.
Widespread ASO distribution and Malat1 RNA reduction in mouse CNS. (A) spinal cord, (B) brain, (C) cortex, (D) cerebellum, (E) hippocampus, (F) thalamus, (G) hypothalamus and (H) striatum were stained for Malat1 RNA and ASO. Staining, treatment, and the scales are indicated. All sections were counter stained with hematoxylin. Mice were treated with 300 μg Malat1 ASO or PBS. IHC, immunohistochemistry; ISH in situ hybridization; PBS, phosphate-buffered saline.
IT bolus injection of Malat1 ASO results in widespread ASO distribution and target reduction in rats
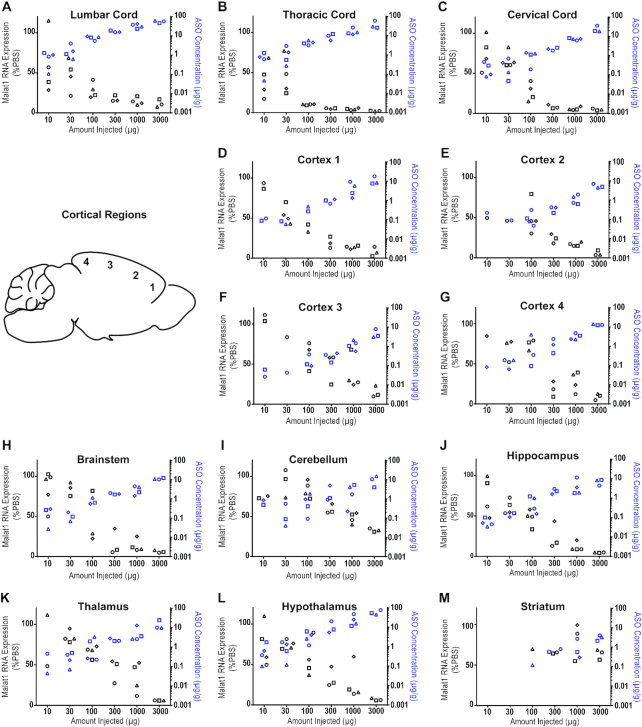
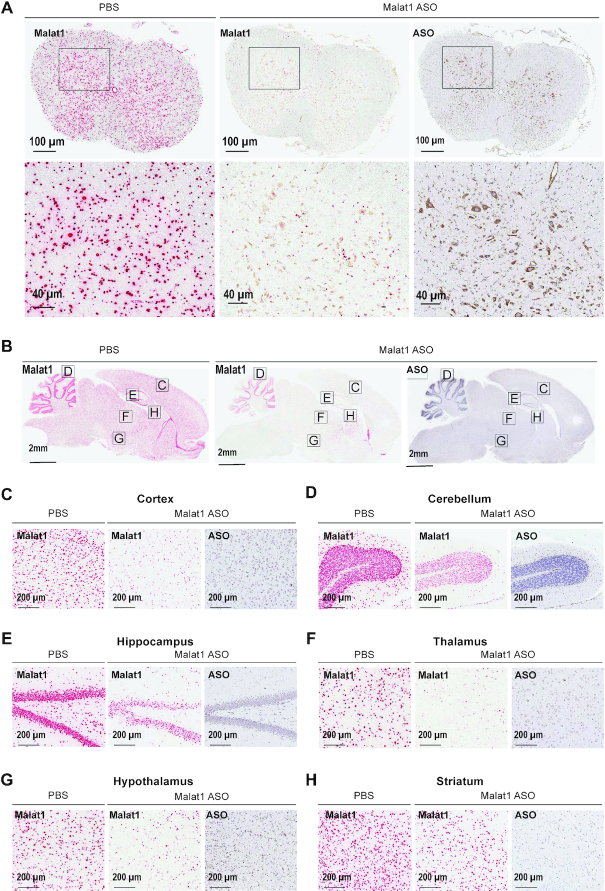
In rats, the CNS and CSF volumes are ∼6-fold larger than in mice (33). Therefore, we asked if the distribution and activity of the Malat1 ASO was as efficient in rats as was observed in mice. Moreover, the larger size of the rats compared to mice provided the opportunity to perform IT delivery to mimic a clinically relevant route of administration. Increasing doses of the Malat1 ASO were administered to adult male rats by a single IT bolus injection. During the two weeks post treatment all animals had normal home cage behavior and their weight gain was comparable to the control animals (data not shown). After two weeks we dissected a variety of CNS regions and measured the levels of Malat1 RNA and the ASO tissue concentration (Figure 3 and Supplementary Table S4). As we demonstrated in mice, dose-dependent reduction of Malat1 RNA was observed in all CNS regions tested and the degree of RNA reduction was correlated with the amount of ASO in the tissue (Figure 3A–M). The ASO concentration in the striatum even at the highest dose tested was lower than in other CNS regions and therefore only ∼50% Malat1 RNA reduction was observed (Figure 3M). ISH performed in tissue sections for Malat1 RNA corroborated the qPCR results (Figure 4A–H). As in mice, IHC staining with a specific ASO antibody (Supplementary Figure S5) showed broad ASO distribution and ISH staining showed widespread and efficient reduction of Malat1 RNA. Again, Malat1 ISH in the cerebellum revealed that unlike the molecular and Purkinje cell layers, which were very sensitive to ASO treatment, the granular layer showed modest RNA reduction (Figure 4D). This provides an explanation for why Malat1 reduction in whole tissue cerebellar extract was not as robust as for most of the other regions (Figure 3I). These results demonstrate that IT delivery of the Malat1 ASO results in broad distribution and dose-dependent target reduction in most CNS regions of rats.
Figure 3.
Dose responsive Malat1 RNA reduction and ASO accumulation in rat CNS tissue. Real-time RT-PCR analysis and the Malat1 ASO tissue concentration (black and blue symbols respectively) are plotted for each animal in each dose for spinal cord (A) lumbar, (B) thoracic and (C) cervical (D–G) cortex regions 1–4, (H) brainstem, (I) cerebellum, (J) hippocampus, (K) thalamus, (L) hypothalamus and (M) striatum. Malat1 ASO concentrations for all CNS regions for all doses were measured by LC/MS. The left Y axis is for RNA levels which are plotted as % PBS control and the right Y axis is for ASO concentrations which are plotted as μg ASO per gram of tissue. PBS, phosphate-buffered saline.
Figure 4.
Widespread ASO distribution and Malat1 RNA reduction in rat CNS. (A) spinal cord, (B) brain, (C) cortex, (D) cerebellum, (E) hippocampus, (F) thalamus, (G) hypothalamus and (H) striatum were stained for Malat1 RNA and ASO. Staining, treatment and the scales are indicated. All sections were counter stained with hematoxylin. Rats were treated with 1000 μg Malat1 ASO or PBS. IHC, immunohistochemistry; ISH in situ hybridization; PBS, phosphate-buffered saline.
IT bolus injection of Malat1 ASO results in widespread ASO distribution and target reduction in NHPs
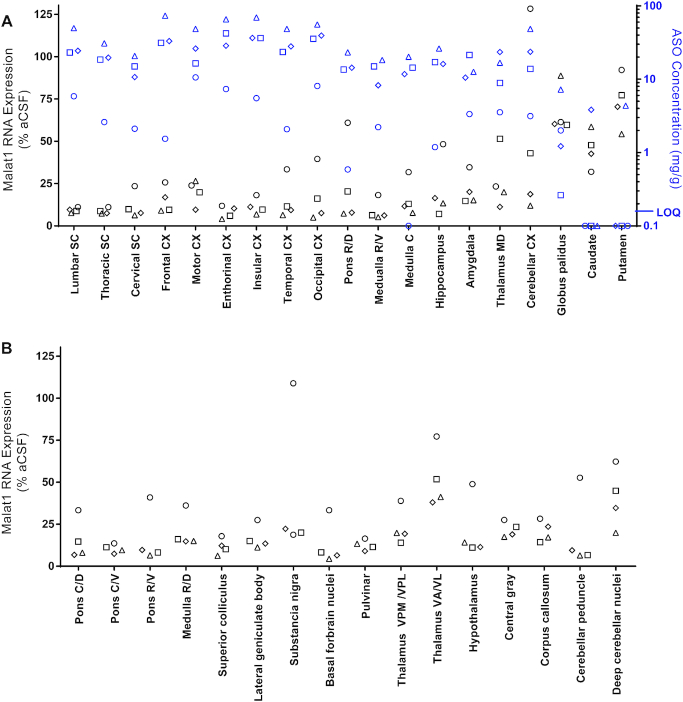
NHPs are one of the large animal species frequently used for pre-clinical safety evaluation of drugs prior to clinical trials in humans. The CNS and CSF volumes of NHPs are ∼60-fold larger than those of rats (33,34). Therefore, it is important to evaluate ASO distribution and Malat1 RNA reduction in the NHP CNS. We administered the Malat1 ASO to adult female NHPs by repeated IT bolus injections. Malat1 ASO administration was well tolerated since no significant clinical abnormalities were observed in treated animals (data not shown), and Aif1 or Gfap were not induced in the spinal cord and cortex (Supplementary Figure S4). We observed broad ASO distribution and Malat1 RNA reduction throughout the CNS (Figure 5, Supplementary Figure S3, and Supplementary Tables S5 and S6). The ASO concentration in the spinal cord, both proximal and distal to the injection site were high (25 and 13 μg/g, respectively). The highest ASO tissue concentrations were observed in the cortex, with highly consistent concentrations in all cortical areas from frontal cortex to occipital cortex. ASO tissue concentrations in brain regions such as pons, medulla, hippocampus, thalamus, amygdala and cerebellar cortex and were consistent with each other and similar to the spinal cord levels. ASO tissue concentrations in the globus pallidus, caudate and putamen were lower compared with other brain regions. The reduction of Malat1 RNA in CNS tissues was in agreement with the ASO tissue concentration, with most regions showing 80–90% target reduction (Figure 5A). Interestingly, one of the NHPs consistently showed lower ASO concentration across all the tissues, likely due to a suboptimal IT injection, which resulted in less Malat1 reduction. Due to the small size of several regions in the brain it was not possible to perform both ASO quantitation and RNA expression analyses. However, Malat1 RNA was strongly reduced in most regions analyzed (Figure 5B). Broad ASO distribution and activity in different brain structures offers the opportunity to develop ASO drugs for many CNS diseases.
Figure 5.
Widespread ASO accumulation and Malat1 RNA reduction in the non-human primate (NHP) CNS. (A) Real-time RT-PCR analysis and the Malat1 ASO tissue concentration (black and blue symbols respectively) are plotted for each animal in several CNS regions. Malat1 ASO concentrations for all CNS regions for all doses were measured by LC/MS. The left Y axis is for RNA levels which are plotted as % vehicle control and the right Y axis is for ASO concentrations which are plotted as μg ASO per gram of tissue. (B) Real-time RT-PCR analysis for additional CNS regions that were too small to be sampled for ASO concentration analysis. RNA levels are plotted for each animal as % vehicle control. aCSF, artificial cerebrospinal fluid.
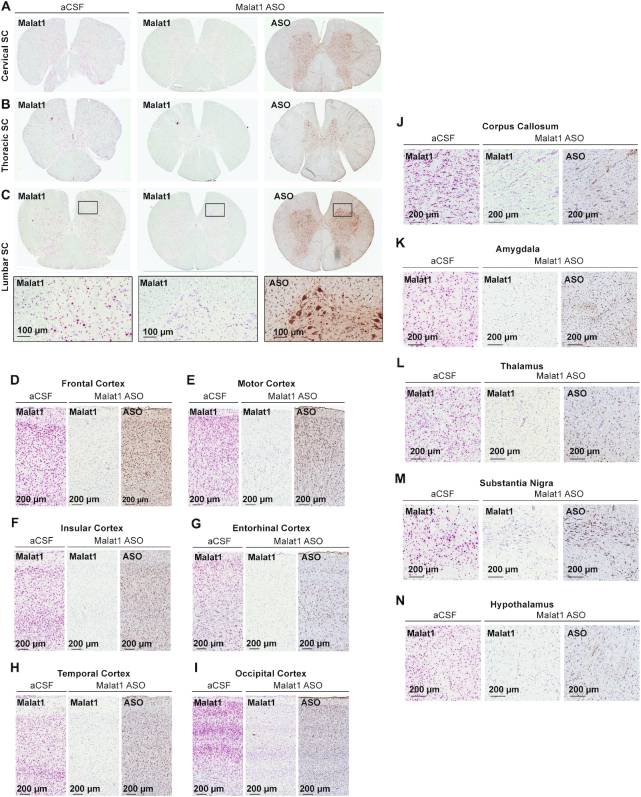
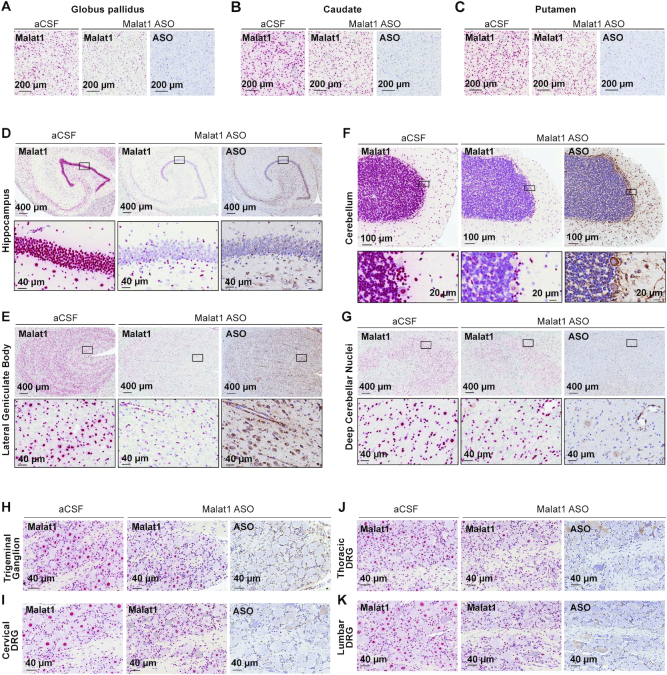
To assess the ASO distribution within CNS structures in more detail we performed IHC staining with a specific ASO antibody (Figures 6 and 7, Supplementary Figure S5). The ASO distribution assessed by IHC was in agreement with the ASO concentrations measured in different brain structures. The Malat1 ISH studies also allow for visualization of target reduction in individual cells within a brain structure. Despite the globus pallidus, caudate, and putamen showing the least whole tissue ASO accumulation, ISH staining in these regions reveals clear Malat1 RNA reduction in ASO treated animals at the cellular level (Figure 7A–C). Trigeminal ganglion and dorsal root ganglia (DRG) at cervical, thoracic and lumbar levels showed accumulation of ASO accompanied with Malat1 RNA reduction visualized by in situ (Figure 7H–K). These results show that IT delivery of the Malat1 ASO results in broad distribution and target reduction in most CNS regions of NHPs.
Figure 6.
Widespread ASO distribution and Malat1 RNA reduction in the non-human primate (NHP) CNS. (A) cervical, (B) thoracic, and (C) lumbar spinal cord, (D) frontal, (E) motor, (F) insular, (G) entorhinal, (H) temporal, (I) occipital cortex, (J) corpus callosum, (K) amygdala, (L) thalamus, (M) substantia nigra and (N) hypothalamus.
Figure 7.
Widespread ASO distribution and Malat1 RNA reduction in the non-human primate (NHP) CNS. (A) globus pallidus, (B) caudate, (C) putamen, (D) hippocampus, (E) lateral geniculate body, (F) cerebellum, (G) deep cerebellar nuclei, (H) trigeminal ganglion, (I) cervical, (J) thoracic and (K) lumbar dorsal root ganglia are stained for Malat1 RNA and ASO. Staining, treatment, and the scales are indicated. All sections were counter stained with hematoxylin. DRG, dorsal root ganglia. IHC, immunohistochemistry; ISH, in situ hybridization; aCSF, artificial cerebrospinal fluid.
Central administration of Malat1 ASO results in efficient target reduction in all the major CNS cell types
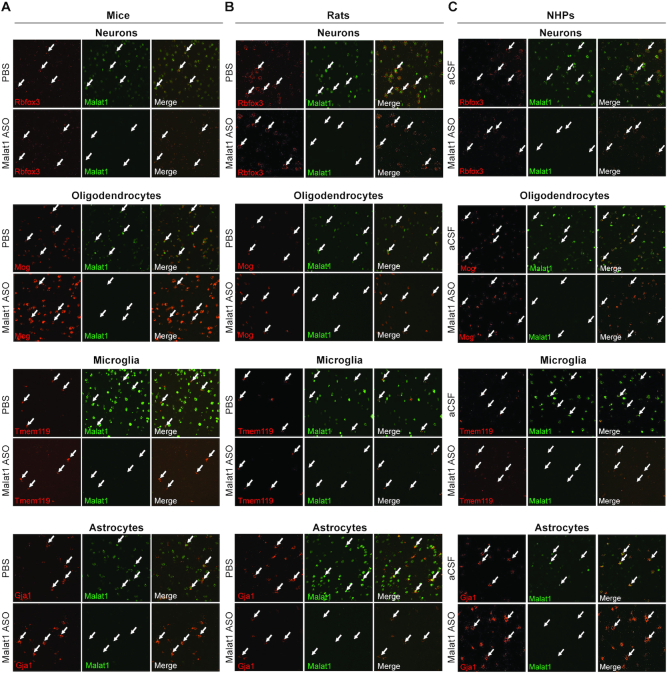
CNS is a complex tissue that consists of four major cell types. Neurons, oligodendrocytes, astrocytes, and microglia play important roles in the pathogenesis of different neurological diseases. We have shown that ASO distributes well throughout the CNS of the three species we examined (Figures 2, 4, 6 and 7). However, it is equally important to determine how efficiently ASOs can target the different cell types in the CNS. Initially, we noticed that ASO distribution and Malat1 RNA reduction were evident in both white and grey matter regions, and a wide range of cell types based on their location and morphology (Figure 2A–H). To confirm the activity of the Malat1 ASO in the four major cell types of the CNS across the three species, we performed double labelling in situ hybridization using a probe for Malat1 RNA and a probe for each cell type of interest. To label neurons, oligodendrocytes, microglia and astrocytes we used species specific in situ probes for Rbfox3, Mog, Tmem119 and Gja1, respectively (See supplementary methods). The Malat1 ISH signal was strongly reduced in all four cell types of the CNS in all three of the species evaluated (Figure 8A–C).
Figure 8.
The Malat1 ASO targets all major cell types in the CNS. Colocalization of Malat1 with Rbfox3 in neurons, Mog in oligodendrocytes, Tmem119 in microglia, and Gj1 in astrocytes in cortex of (A) mouse, (B) rat and (C) non-human primates (NHP). Arrows indicate four selected cells in each field. Mice were treated with 300 μg Malat1 ASO or vehicle. Rats were treated with 1000 μg Malat1 ASO or vehicle. NHP were treated with three doses of 25 mg Malat1 ASO or vehicle.
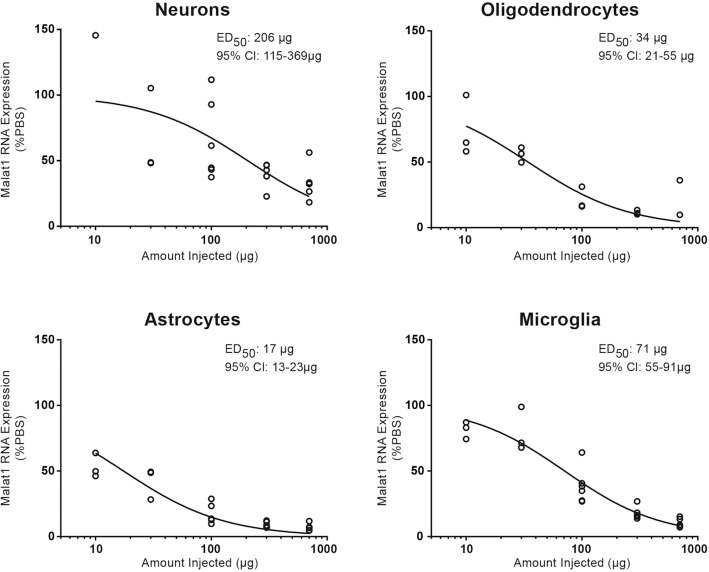
To quantitatively assess Malat1 RNA reduction in the four major CNS cell types, we isolated them from cortex using a magnetic cell isolation and measured the levels of Malat1 RNA by real-time RT-PCR after administering the Malat1 ASO at increasing doses to adult mice by a single ICV bolus injection. As expected, Malat1 RNA was reduced dose-dependently in neurons with an ED50 of 206 μg. Surprisingly, microglia (ED50 of 71 μg), oligodendrocytes (ED50 of 34 μg) and astrocytes (ED50 of 17 μg) were more sensitive to the Malat1 ASO compared to neurons (Figure 9). These data demonstrate that an ASO can target and effectively reduce transcript in all the major CNS cell types.
Figure 9.
Dose-dependent Malat1 RNA reduction in neurons, oligodendrocytes, astrocytes and microglia isolated from mouse cortex. Real-time RT-PCR analysis for Malat1 RNA are plotted for individual animals in different cell types. Injected doses are indicated on the X axis.
CSF volume scaling across species to predict ASO tissue concentration
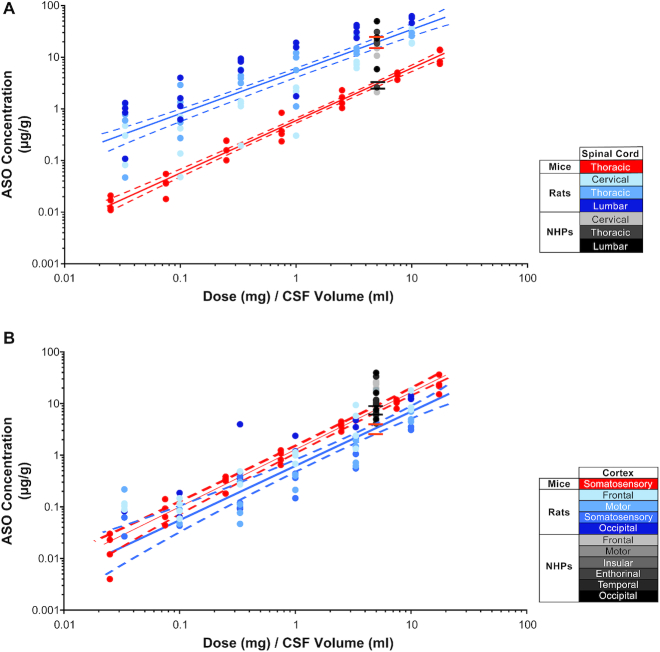
Since we evaluated ASO concentrations in the CNS tissues of three species with different CNS volumes, we asked if the ASO tissue concentrations scaled accordingly between species. To determine if this was the case, we plotted the ASO dose normalized to CSF volume of each species (24,33,34) versus the measured ASO tissue concentrations. We predicted the tissue concentration for NHP based on a linear regression analysis using the measured ASO tissue concentrations in either mouse or rat spinal cord and compared this to the measured ASO concentrations in ASO treated NHPs. When the ASO dose was normalized to the CSF volume, the ASO tissue concentration in the mouse spinal cord was significantly less than the ASO tissue concentration in the rat spinal cord (P ≤ 0.0001) (Figure 10A, Supplementary Tables S7 and S11). The predicted NHP ASO tissue concentration from the mouse spinal cord data was significantly lower than the measured tissue concentration in NHP (P ≤ 0.0001) (Figure 10A, Supplementary Tables S9 and S12). On the contrary, the predicted NHP ASO tissue concentration from the rat spinal cord data was not significantly different from the measured tissue concentration in NHP (P ≤ 0.8622) (Figure 10A, Supplementary Tables S9 and S11). Comparing ASO tissue concentrations in the cortex of mouse and rat showed a small but significant difference (P ≤ 0.002), with higher tissue concentration in mouse. However, the ASO tissue concentration measured in NHP was significantly higher than the predicted ASO tissue concentration from both the mouse and rat data (P ≤ 0.0001) (Figure 10B, Supplementary Tables S8, S10 and S12).
Figure 10.
Comparison of ASO tissue concentration after dose normalized to CSF volume in mice, rats and non-human primates (NHPs) in (A) spinal cord and (B) cortex. The CSF volumes used for mouse, rat and NHP were 0.04, 0.3 and 15 ml, respectively. Data for mice, rats and NHPs are shown in red, blue and gray symbols, respectively. Different tissues sampled from rats and NHPs are depicted in shades of blue and gray, respectively. The best fit regression is shown as a in solid line (red for mice and blue for rats) and the 95% confidence intervals are shown as dashed lines. The predicted NHP tissue concentrations simulated form boot strap regression for mouse (between the black lines) or rat (between the orange lines) are shown.
DISCUSSION
Here, we demonstrate that central administration of a MOE-gapmer ASO results in widespread distribution and potent target RNA reduction throughout the CNS of rodents and NHPs. The four major CNS cell types, neurons, microglia, astrocytes and oligodendrocytes are all efficiently targeted with this ASO.
The Malat1 ASO we used in this study was identified after performing a screen in cell culture and rats, with no additional sequence or chemistry optimization. The Malat1 ASO is the standard 5–10–5 MOE-gapmer design that is frequently used in preclinical research (8,10,12–14,16–18) as well as in ongoing clinical trials (19,20). Other studies using similar ASO chemistries have also shown broad ASO distribution in mice and NHP (8,24,35). The dose of Malat1 ASO used in NHPs herein is comparable to the doses used for human ASO drug candidates when tested in NHPs or in experimental NHP-specific compounds shown reduce target RNA (20,36,37). This ASO profile is therefore not unique, and the data presented herein should be representative of gapmer ASOs in general.
Across all neurological diseases many different CNS regions and cell types have been shown to play a role. For example, selective spinal motor neuron degeneration occurs in SMA (38), motor neuron loss in both cortex and spinal cord occurs in ALS (39), selective degeneration of substantia nigra pars compacta dopaminergic neurons occurs in Parkinson's disease (40), degeneration of neurons in the frontal cortex and hippocampus occurs in Alzheimer's disease (41), and Purkinje cells selectively degenerate in a variety of cerebellar ataxias (42). Since our results demonstrate that there is widespread distribution and activity in most CNS regions and the major cell types, we believe that ASO drugs are well suited for treating a wide range of neurological diseases for which no effective treatments are available.
It is important to note that healthy, wild-type animals were used in the studies presented herein. Theoretically, a disease condition could affect the activity and distribution of ASOs, but we have not observed decreased ASO activity in a variety of neurodegenerative and neurodevelopmental disease models (11,16,35,43). However, we recommend that each disease model should be evaluated for activity and tolerability of ASOs independently.
Some CNS regions and neuron subtypes such as striatum in mice and rats, the caudate nucleus, putamen, and globus pallidus in NHP, and the granule cells in the cerebellum showed less ASO accumulation and Malat1 RNA knock down. For diseases affecting these CNS regions and neuronal subtypes, higher doses of ASO are required to achieve the desired level of mRNA suppression. In the future, advancements in delivery of ASO via ligand-conjugated antisense (LICA) could be used to more robustly target CNS cell types and regions which are less sensitive to unconjugated ASO. This strategy has worked remarkably well to specifically deliver ASOs to hepatocytes using N-acetylgalactosamine (GalNAc) (44) as a ligand or to specifically deliver ASOs to pancreatic beta cells using glucagon-like peptide 1 (GLP1) as a ligand (45,46). In addition, delivery across the brain-blood barrier (BBB) may offer an opportunity to achieve even broader ASO distribution and activity in the CNS.
Neurological diseases can be driven or modulated by dysfunction of neurons as well as by that of non-neuronal cells such as microglia, oligodendrocytes, and astrocytes (47,48). Here we observed efficient ASO activity in all these cell types in rodents and NHPs. Higher doses of ASO were required in neurons to achieve knockdown equivalent to that in glial subtypes. The mechanism governing this, be it differences in cellular uptake, trafficking or RNase H1 activity for example, requires further investigation. It is important to note, however, that despite lower sensitivity of neurons compared to glia, ASOs do efficiently knock down targets specifically expressed in neurons (35). More work is required to fully characterize the sensitivity of the major CNS cell types and subtypes to ASOs. Single-cell RNA-seq should help to augment and expand our quantitative assessments of ASO activity in neuronal and glial subtypes.
It is gratifying to observe widespread ASO distribution and activity in small animals such as mice to larger animals such as NHPs after central administration. Previously we showed that ASO distributes rostrally in the CSF along the neuroaxis and rapidly adheres to pia and arterial walls, consistent with perivascular entry into the CNS following IT bolus injection in rats (21). Over time, ASO accumulates in all major CNS cell types presumably by receptor mediated endocytosis (49). However, more work is needed to better understand the molecular mechanisms responsible for ASO distribution into the tissue and uptake of the ASO into the various CNS cell types. Recently, it was shown that a divalent siRNA has broad distribution and activity in the CNS of NHPs including neurons and GFAP positive astrocytes (50). In contrast to ASOs and divalent siRNAs, intrathecal delivery of other drug modalities such as antibodies, proteins or peptides results in a large rostral to caudal gradients and limited accumulation in tissue (51,52). Viral delivery of gene therapy achieves good CNS distribution but does not effectively target non-neuronal cells (53).
Since we evaluated the concentration of ASO in the CNS tissues of three species with different CNS volumes, we asked if the ASO tissue concentrations scaled accordingly between species. Our data show that the ASO tissue concentration in the rat spinal cord following IT delivery of ASO can predict NHP ASO tissue concentration for a given dose when normalized to CSF volume. However, ASO tissue concentrations measured in mouse spinal cord predicted a much lower ASO tissue concentration in NHP compared to the actual measurements in NHP spinal cord. Interestingly, the predictions made based on the ASO concentrations in cortex from both mice and rats underestimated NHP ASO tissue concentrations. ASO is cleared through bulk flow with CSF reabsorption as well as uptake to tissues. The CSF formation and reabsorption rates differ between species (33) which may explain the observed difference in uptake to CNS tissues. Alternatively, differences in anatomical features, and dosing routes (ICV versus IT) could play a role in the differences in uptake observed.
Supplementary Material
ACKNOWLEDGEMENTS
The authors thank the vivarium staff, oligo synthesis group and histology core staff at Ionis Pharmaceuticals Inc, for their technical support.
Contributor Information
Paymaan Jafar-nejad, Ionis Pharmaceuticals Inc. Carlsbad, CA 92010, USA.
Berit Powers, Ionis Pharmaceuticals Inc. Carlsbad, CA 92010, USA.
Armand Soriano, Ionis Pharmaceuticals Inc. Carlsbad, CA 92010, USA.
Hien Zhao, Ionis Pharmaceuticals Inc. Carlsbad, CA 92010, USA.
Daniel A Norris, Ionis Pharmaceuticals Inc. Carlsbad, CA 92010, USA.
John Matson, Ionis Pharmaceuticals Inc. Carlsbad, CA 92010, USA.
Beatrice DeBrosse-Serra, Ionis Pharmaceuticals Inc. Carlsbad, CA 92010, USA.
Jamie Watson, Ionis Pharmaceuticals Inc. Carlsbad, CA 92010, USA.
Padmakumar Narayanan, Ionis Pharmaceuticals Inc. Carlsbad, CA 92010, USA.
Seung J Chun, Ionis Pharmaceuticals Inc. Carlsbad, CA 92010, USA.
Curt Mazur, Ionis Pharmaceuticals Inc. Carlsbad, CA 92010, USA.
Holly Kordasiewicz, Ionis Pharmaceuticals Inc. Carlsbad, CA 92010, USA.
Eric E Swayze, Ionis Pharmaceuticals Inc. Carlsbad, CA 92010, USA.
Frank Rigo, Ionis Pharmaceuticals Inc. Carlsbad, CA 92010, USA.
SUPPLEMENTARY DATA
Supplementary Data are available at NAR Online.
FUNDING
Not applicable.
Conflict of interest statement. All authors are paid employees of Ionis pharmaceuticals.
REFERENCES
- 1. Crooke S.T., Witztum J.L., Bennett C.F., Baker B.F.. RNA-targeted therapeutics. Cell Metab. 2019; 29:501. [DOI] [PubMed] [Google Scholar]
- 2. Wu H., Lima W.F., Zhang H., Fan A., Sun H., Crooke S.T.. Determination of the role of the human RNase H1 in the pharmacology of DNA-like antisense drugs. J. Biol. Chem. 2004; 279:17181–17189. [DOI] [PubMed] [Google Scholar]
- 3. Bennett C.F., Swayze E.E.. RNA targeting therapeutics: molecular mechanisms of antisense oligonucleotides as a therapeutic platform. Annu. Rev. Pharmacol. Toxicol. 2010; 50:259–293. [DOI] [PubMed] [Google Scholar]
- 4. Wahlestedt C., Golanov E., Yamamoto S., Yee F., Ericson H., Yoo H., Inturrisi C.E., Reis D.J.. Antisense oligodeoxynucleotides to NMDA-R1 receptor channel protect cortical neurons from excitotoxicity and reduce focal ischaemic infarctions. Nature. 1993; 363:260–263. [DOI] [PubMed] [Google Scholar]
- 5. Weiss B., Zhou L.W., Zhang S.P., Qin Z.H.. Antisense oligodeoxynucleotide inhibits D2 dopamine receptor-mediated behavior and D2 messenger RNA. Neuroscience. 1993; 55:607–612. [DOI] [PubMed] [Google Scholar]
- 6. Whitesell L., Geselowitz D., Chavany C., Fahmy B., Walbridge S., Alger J.R., Neckers L.M.. Stability, clearance, and disposition of intraventricularly administered oligodeoxynucleotides: implications for therapeutic application within the central nervous system. Proc. Natl. Acad. Sci. U.S.A. 1993; 90:4665–4669. [DOI] [PMC free article] [PubMed] [Google Scholar]
- 7. Smith R.A., Miller T.M., Yamanaka K., Monia B.P., Condon T.P., Hung G., Lobsiger C.S., Ward C.M., McAlonis-Downes M., Wei H. et al.. Antisense oligonucleotide therapy for neurodegenerative disease. J. Clin. Invest. 2006; 116:2290–2296. [DOI] [PMC free article] [PubMed] [Google Scholar]
- 8. Kordasiewicz H.B., Stanek L.M., Wancewicz E.V., Mazur C., McAlonis M.M., Pytel K.A., Artates J.W., Weiss A., Cheng S.H., Shihabuddin L.S. et al.. Sustained therapeutic reversal of Huntington's disease by transient repression of huntingtin synthesis. Neuron. 2012; 74:1031–1044. [DOI] [PMC free article] [PubMed] [Google Scholar]
- 9. Hua Y., Sahashi K., Hung G., Rigo F., Passini M.A., Bennett C.F., Krainer A.R.. Antisense correction of SMN2 splicing in the CNS rescues necrosis in a type III SMA mouse model. Genes Dev. 2010; 24:1634–1644. [DOI] [PMC free article] [PubMed] [Google Scholar]
- 10. DeVos S.L., Miller R.L., Schoch K.M., Holmes B.B., Kebodeaux C.S., Wegener A.J., Chen G., Shen T., Tran H., Nichols B. et al.. Tau reduction prevents neuronal loss and reverses pathological tau deposition and seeding in mice with tauopathy. Sci. Transl. Med. 2017; 9:eaag0481. [DOI] [PMC free article] [PubMed] [Google Scholar]
- 11. Zhao H.T., John N., Delic V., Ikeda-Lee K., Kim A., Weihofen A., Swayze E.E., Kordasiewicz H.B., West A.B., Volpicelli-Daley L.A.. LRRK2 antisense oligonucleotides ameliorate alpha-Synuclein inclusion formation in a Parkinson's disease mouse model. Mol. Ther. Nucleic Acids. 2017; 8:508–519. [DOI] [PMC free article] [PubMed] [Google Scholar]
- 12. Jiang J., Zhu Q., Gendron T.F., Saberi S., McAlonis-Downes M., Seelman A., Stauffer J.E., Jafar-Nejad P., Drenner K., Schulte D. et al.. Gain of toxicity from ALS/FTD-Linked repeat expansions in C9ORF72 is alleviated by antisense oligonucleotides targeting GGGGCC-containing RNAs. Neuron. 2016; 90:535–550. [DOI] [PMC free article] [PubMed] [Google Scholar]
- 13. Hagemann T.L., Powers B., Mazur C., Kim A., Wheeler S., Hung G., Swayze E., Messing A.. Antisense suppression of glial fibrillary acidic protein as a treatment for Alexander disease. Ann. Neurol. 2018; 83:27–39. [DOI] [PMC free article] [PubMed] [Google Scholar]
- 14. Elitt M.S., Barbar L., Shick H.E., Powers B.E., Maeno-Hikichi Y., Madhavan M., Allan K.C., Nawash B.S., Gevorgyan A.S., Hung S. et al.. Suppression of proteolipid protein rescues Pelizaeus-Merzbacher disease. Nature. 2020; 585:397–403. [DOI] [PMC free article] [PubMed] [Google Scholar]
- 15. Raymond G.J., Zhao H.T., Race B., Raymond L.D., Williams K., Swayze E.E., Graffam S., Le J., Caron T., Stathopoulos J. et al.. Antisense oligonucleotides extend survival of prion-infected mice. JCI Insight. 2019; 5:e131175. [DOI] [PMC free article] [PubMed] [Google Scholar]
- 16. Becker L.A., Huang B., Bieri G., Ma R., Knowles D.A., Jafar-Nejad P., Messing J., Kim H.J., Soriano A., Auburger G. et al.. Therapeutic reduction of ataxin-2 extends lifespan and reduces pathology in TDP-43 mice. Nature. 2017; 544:367–371. [DOI] [PMC free article] [PubMed] [Google Scholar]
- 17. McLoughlin H.S., Moore L.R., Chopra R., Komlo R., McKenzie M., Blumenstein K.G., Zhao H., Kordasiewicz H.B., Shakkottai V.G., Paulson H.L.. Oligonucleotide therapy mitigates disease in spinocerebellar ataxia type 3 mice. Ann. Neurol. 2018; 84:64–77. [DOI] [PMC free article] [PubMed] [Google Scholar]
- 18. Niu C., Prakash T.P., Kim A., Quach J.L., Huryn L.A., Yang Y., Lopez E., Jazayeri A., Hung G., Sopher B.L. et al.. Antisense oligonucleotides targeting mutant Ataxin-7 restore visual function in a mouse model of spinocerebellar ataxia type 7. Sci. Transl. Med. 2018; 10:eaap8677. [DOI] [PMC free article] [PubMed] [Google Scholar]
- 19. Miller T., Cudkowicz M., Shaw P.J., Andersen P.M., Atassi N., Bucelli R.C., Genge A., Glass J., Ladha S., Ludolph A.L. et al.. Phase 1–2 trial of antisense oligonucleotide tofersen for SOD1 ALS. N. Engl. J. Med. 2020; 383:109–119. [DOI] [PubMed] [Google Scholar]
- 20. Tabrizi S.J., Leavitt B.R., Landwehrmeyer G.B., Wild E.J., Saft C., Barker R.A., Blair N.F., Craufurd D., Priller J., Rickards H. et al.. Targeting huntingtin expression in patients with Huntington's disease. N. Engl. J. Med. 2019; 380:2307–2316. [DOI] [PubMed] [Google Scholar]
- 21. Mazur C., Powers B., Zasadny K., Sullivan J.M., Dimant H., Kamme F., Hesterman J., Matson J., Oestergaard M., Seaman M. et al.. Brain pharmacology of intrathecal antisense oligonucleotides revealed through multimodal imaging. JCI Insight. 2019; 4:e129240. [DOI] [PMC free article] [PubMed] [Google Scholar]
- 22. Rigo F., Chun S.J., Norris D.A., Hung G., Lee S., Matson J., Fey R.A., Gaus H., Hua Y., Grundy J.S. et al.. Pharmacology of a central nervous system delivered 2′-O-methoxyethyl-modified survival of motor neuron splicing oligonucleotide in mice and nonhuman primates. J. Pharmacol. Exp. Ther. 2014; 350:46–55. [DOI] [PMC free article] [PubMed] [Google Scholar]
- 23. Butler M., Hayes C.S., Chappell A., Murray S.F., Yaksh T.L., Hua X.Y.. Spinal distribution and metabolism of 2′-O-(2-methoxyethyl)-modified oligonucleotides after intrathecal administration in rats. Neuroscience. 2005; 131:705–715. [DOI] [PubMed] [Google Scholar]
- 24. Sullivan J.M., Mazur C., Wolf D.A., Horky L., Currier N., Fitzsimmons B., Hesterman J., Pauplis R., Haller S., Powers B. et al.. Convective forces increase rostral delivery of intrathecal radiotracers and antisense oligonucleotides in the cynomolgus monkey nervous system. J. Transl. Med. 2020; 18:309. [DOI] [PMC free article] [PubMed] [Google Scholar]
- 25. Miller T.M., Pestronk A., David W., Rothstein J., Simpson E., Appel S.H., Andres P.L., Mahoney K., Allred P., Alexander K. et al.. An antisense oligonucleotide against SOD1 delivered intrathecally for patients with SOD1 familial amyotrophic lateral sclerosis: a phase 1, randomised, first-in-man study. Lancet Neurol. 2013; 12:435–442. [DOI] [PMC free article] [PubMed] [Google Scholar]
- 26. Ramos D.M., d’Ydewalle C., Gabbeta V., Dakka A., Klein S.K., Norris D.A., Matson J., Taylor S.J., Zaworski P.G., Prior T.W. et al.. Age-dependent SMN expression in disease-relevant tissue and implications for SMA treatment. J. Clin. Invest. 2019; 129:4817–4831. [DOI] [PMC free article] [PubMed] [Google Scholar]
- 27. Finkel R.S., Mercuri E., Darras B.T., Connolly A.M., Kuntz N.L., Kirschner J., Chiriboga C.A., Saito K., Servais L., Tizzano E. et al.. Nusinersen versus sham control in Infantile-Onset spinal muscular atrophy. N. Engl. J. Med. 2017; 377:1723–1732. [DOI] [PubMed] [Google Scholar]
- 28. Finkel R.S., Chiriboga C.A., Vajsar J., Day J.W., Montes J., De Vivo D.C., Yamashita M., Rigo F., Hung G., Schneider E. et al.. Treatment of infantile-onset spinal muscular atrophy with nusinersen: a phase 2, open-label, dose-escalation study. Lancet. 2017; 388:3017–3026. [DOI] [PubMed] [Google Scholar]
- 29. Mazur C., Fitzsimmons B., Kamme F., Nichols B., Powers B., Wancewicz E.. Development of a simple, rapid, and robust intrathecal catheterization method in the rat. J. Neurosci. Methods. 2017; 280:36–46. [DOI] [PubMed] [Google Scholar]
- 30. Yu R.Z., Baker B., Chappell A., Geary R.S., Cheung E., Levin A.A.. Development of an ultrasensitive noncompetitive hybridization-ligation enzyme-linked immunosorbent assay for the determination of phosphorothioate oligodeoxynucleotide in plasma. Anal. Biochem. 2002; 304:19–25. [DOI] [PubMed] [Google Scholar]
- 31. Yu R.Z., Kim T.W., Hong A., Watanabe T.A., Gaus H.J., Geary R.S.. Cross-species pharmacokinetic comparison from mouse to man of a second-generation antisense oligonucleotide, ISIS 301012, targeting human apolipoprotein B-100. Drug Metab. Dispos. 2007; 35:460–468. [DOI] [PubMed] [Google Scholar]
- 32. Hung G., Xiao X., Peralta R., Bhattacharjee G., Murray S., Norris D., Guo S., Monia B.P.. Characterization of target mRNA reduction through in situ RNA hybridization in multiple organ systems following systemic antisense treatment in animals. Nucleic Acid Ther. 2013; 23:369–378. [DOI] [PubMed] [Google Scholar]
- 33. Yaksh T.L. Spinal Drug Delivery. 1999; Elsevier. [Google Scholar]
- 34. Di Chiro G., Knop R.H., Girton M.E., Dwyer A.J., Doppman J.L., Patronas N.J., Gansow O.A., Brechbiel M.W., Brooks R.A.. MR cisternography and myelography with Gd-DTPA in monkeys. Radiology. 1985; 157:373–377. [DOI] [PubMed] [Google Scholar]
- 35. Li M., Jancovski N., Jafar-Nejad P., Burbano L.E., Rollo B., Richards K., Drew L., Sedo A., Pachernegg S., Soriano A. et al.. Antisense oligonucleotide therapy for SCN2A gain-of-function epilepsy. 2020; bioRxiv doi:11 September 2020, preprint: not peer reviewed 10.1101/2020.09.09.289900. [DOI] [PMC free article] [PubMed]
- 36. McCampbell A., Cole T., Wegener A.J., Tomassy G.S., Setnicka A., Farley B.J., Schoch K.M., Hoye M.L., Shabsovich M., Sun L. et al.. Antisense oligonucleotides extend survival and reverse decrement in muscle response in ALS models. J. Clin. Invest. 2018; 128:3558–3567. [DOI] [PMC free article] [PubMed] [Google Scholar]
- 37. Southwell A.L., Kordasiewicz H.B., Langbehn D., Skotte N.H., Parsons M.P., Villanueva E.B., Caron N.S., Ostergaard M.E., Anderson L.M., Xie Y. et al.. Huntingtin suppression restores cognitive function in a mouse model of Huntington's disease. Sci. Transl. Med. 2018; 10:eaar3959. [DOI] [PubMed] [Google Scholar]
- 38. Monani U.R. Spinal muscular atrophy: a deficiency in a ubiquitous protein; a motor neuron-specific disease. Neuron. 2005; 48:885–896. [DOI] [PubMed] [Google Scholar]
- 39. Cleveland D.W., Rothstein J.D.. From Charcot to Lou Gehrig: deciphering selective motor neuron death in ALS. Nat. Rev. Neurosci. 2001; 2:806–819. [DOI] [PubMed] [Google Scholar]
- 40. Brichta L., Greengard P.. Molecular determinants of selective dopaminergic vulnerability in Parkinson's disease: an update. Front. Neuroanat. 2014; 8:152. [DOI] [PMC free article] [PubMed] [Google Scholar]
- 41. Long J.M., Holtzman D.M.. Alzheimer disease: an update on pathobiology and treatment strategies. Cell. 2019; 179:312–339. [DOI] [PMC free article] [PubMed] [Google Scholar]
- 42. Ashizawa T., Oz G., Paulson H.L.. Spinocerebellar ataxias: prospects and challenges for therapy development. Nat. Rev. Neurol. 2018; 14:590–605. [DOI] [PMC free article] [PubMed] [Google Scholar]
- 43. Sztainberg Y., Chen H.M., Swann J.W., Hao S., Tang B., Wu Z., Tang J., Wan Y.W., Liu Z., Rigo F. et al.. Reversal of phenotypes in MECP2 duplication mice using genetic rescue or antisense oligonucleotides. Nature. 2015; 528:123–126. [DOI] [PMC free article] [PubMed] [Google Scholar]
- 44. Prakash T.P., Yu J., Migawa M.T., Kinberger G.A., Wan W.B., Ostergaard M.E., Carty R.L., Vasquez G., Low A., Chappell A. et al.. Comprehensive structure-activity relationship of triantennary N-Acetylgalactosamine conjugated antisense oligonucleotides for targeted delivery to hepatocytes. J. Med. Chem. 2016; 59:2718–2733. [DOI] [PubMed] [Google Scholar]
- 45. Ammala C., Drury W.J. 3rd, Knerr L., Ahlstedt I., Stillemark-Billton P., Wennberg-Huldt C., Andersson E.M., Valeur E., Jansson-Lofmark R., Janzen D. et al.. Targeted delivery of antisense oligonucleotides to pancreatic beta-cells. Sci. Adv. 2018; 4:eaat3386. [DOI] [PMC free article] [PubMed] [Google Scholar]
- 46. Seth P.P., Tanowitz M., Bennett C.F.. Selective tissue targeting of synthetic nucleic acid drugs. J. Clin. Invest. 2019; 129:915–925. [DOI] [PMC free article] [PubMed] [Google Scholar]
- 47. Messing A. Alexander disease. Handb. Clin. Neurol. 2018; 148:693–700. [DOI] [PubMed] [Google Scholar]
- 48. Tognatta R., Miller R.H.. Contribution of the oligodendrocyte lineage to CNS repair and neurodegenerative pathologies. Neuropharmacology. 2016; 110:539–547. [DOI] [PMC free article] [PubMed] [Google Scholar]
- 49. Crooke S.T., Wang S., Vickers T.A., Shen W., Liang X.H.. Cellular uptake and trafficking of antisense oligonucleotides. Nat. Biotechnol. 2017; 35:230–237. [DOI] [PubMed] [Google Scholar]
- 50. Alterman J.F., Godinho B., Hassler M.R., Ferguson C.M., Echeverria D., Sapp E., Haraszti R.A., Coles A.H., Conroy F., Miller R. et al.. A divalent siRNA chemical scaffold for potent and sustained modulation of gene expression throughout the central nervous system. Nat. Biotechnol. 2019; 37:884–894. [DOI] [PMC free article] [PubMed] [Google Scholar]
- 51. Noguchi Y., Kato M., Ozeki K., Ishigai M.. Pharmacokinetics of an intracerebroventricularly administered antibody in rats. MAbs. 2017; 9:1210–1215. [DOI] [PMC free article] [PubMed] [Google Scholar]
- 52. Thorne R.G., Frey W.H. 2nd. Delivery of neurotrophic factors to the central nervous system: pharmacokinetic considerations. Clin. Pharmacokinet. 2001; 40:907–946. [DOI] [PubMed] [Google Scholar]
- 53. Maes M.E., Colombo G., Schulz R., Siegert S.. Targeting microglia with lentivirus and AAV: Recent advances and remaining challenges. Neurosci. Lett. 2019; 707:134310. [DOI] [PMC free article] [PubMed] [Google Scholar]
Associated Data
This section collects any data citations, data availability statements, or supplementary materials included in this article.


