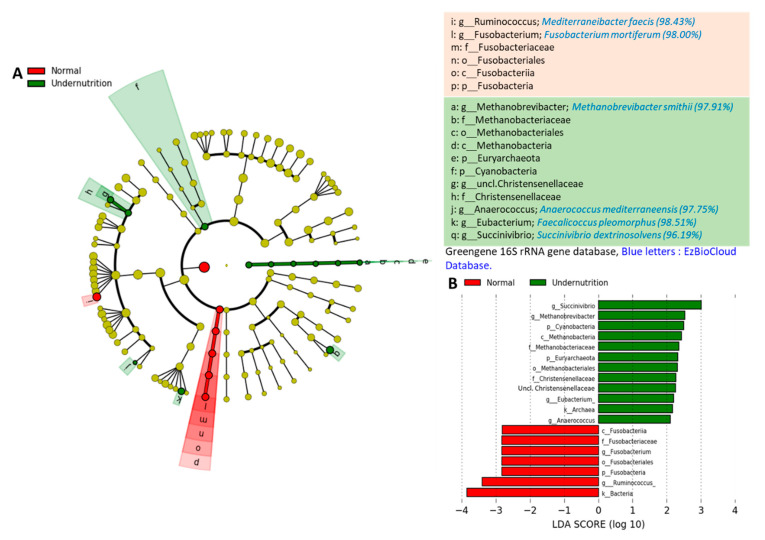
Figure 4.
LEfSe showing the difference in gut microbial taxa between the normal and undernutrition group. (A) The cladogram shows the difference in gut microbiota between-group; the alphabet indicates the significantly different microbes in each group. Red color refers to the bacteria overexpressed in the normal group, and green color refers to the bacteria overexpressed in the undernutrition group. (B) Histogram of LDA score of gut microbiota between-group. Bar length represents the effect size, which explains the differentiating phenotypes between groups. k__, domain; p__, phylum; c__, class; o__, order; f__, family; g__, genus.

