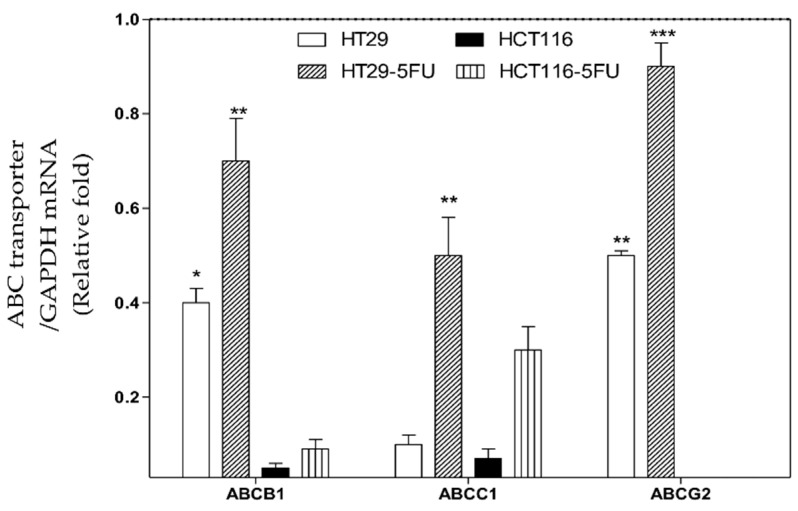
Figure 5.
Total mRNA was isolated from HT29, HT29-5FU, HCT116, and HCT116-5FU cells and quantified by RT-PCR with ABCB1, ABCC1, and ABCG2 primers. The results were expressed as relative fold change (average ± SD, n = 3, ×2 independent experiments) compared with GAPDH (1-fold change). Statistical differences (one-way ANOVA, Tukey’s post-hoc): p < 0.05 (*), p < 0.01 (**), and p < 0.001 (***) were considered significant.

