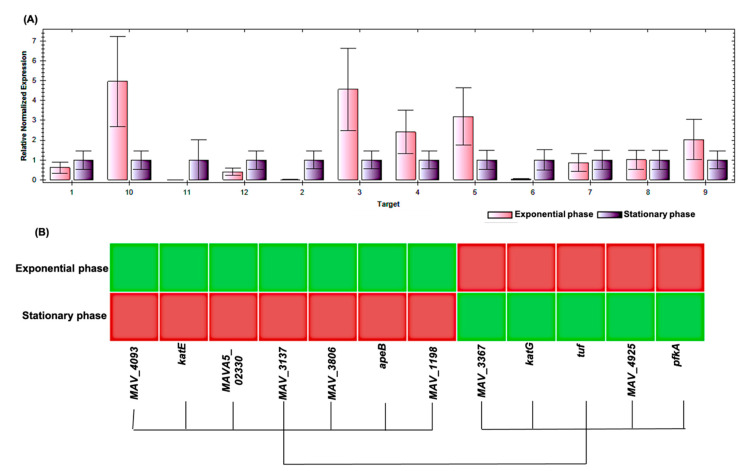
Figure 5.
Analysis of expression of the twelve genes in the exponential and in the stationary growth phases by qRT-PCR. Cultures were grown to an OD600 of 0.5 and 2.8, respectively, and the total RNA was extracted from each phase. (A) mRNA levels were normalized using the geometric mean of the housekeeping genes, sigA and groL. Data are shown as the means of triplicate experiments with three biological replicates. (B) Heatmap for the differential expression of the 12 genes between the exponential and the stationary phase of the growth of the MAH 104. Gene numbers correspond to those listed in Table 1.

