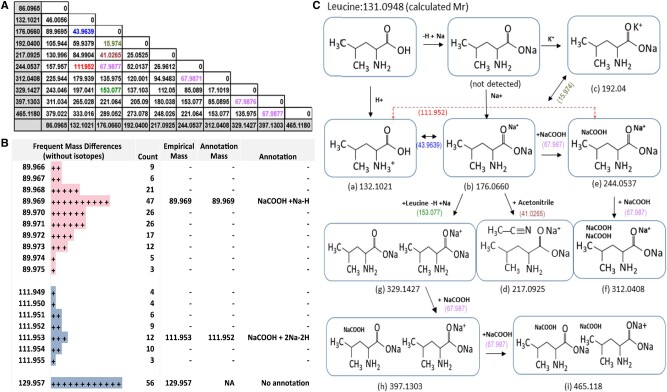
Fig.4.
(A) Binner mass matrix showing common mass differences that can fully explain a cluster containing Leucine from a HILIC positive dataset. (B) A portion of the Binner output (mass distribution tab) shows that 111.952 is a frequent mass difference in this dataset. (C) Flow chart of all the ions in this Binner cluster shows the complex pattern of Leucine adducts

