Fig. 5.

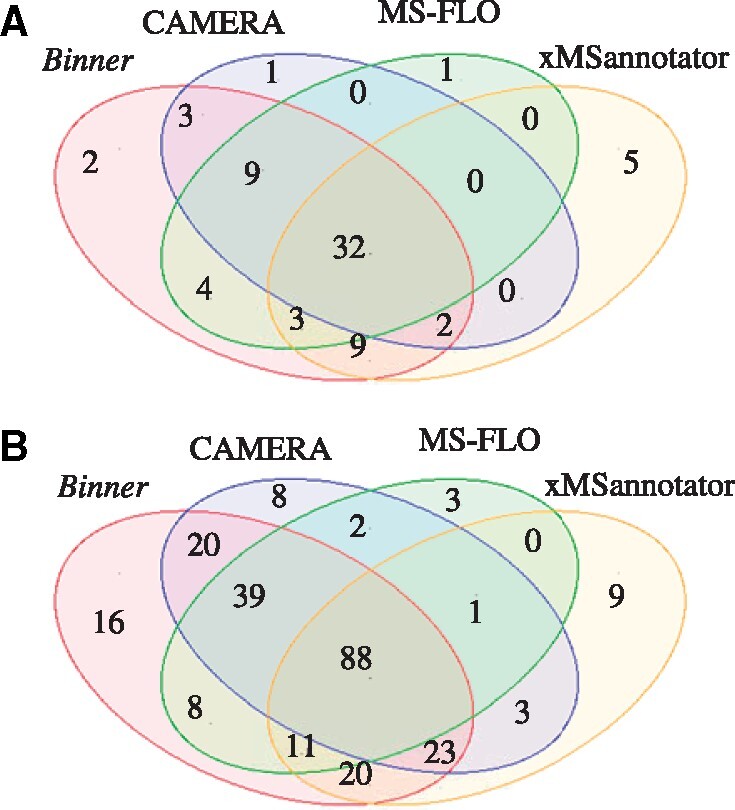
Venn diagram illustrating the overlap between annotations generated by different programs. (A) PI annotations. (B) Adducts and neutral loss annotations

Venn diagram illustrating the overlap between annotations generated by different programs. (A) PI annotations. (B) Adducts and neutral loss annotations