

Abstract
BACKGROUND AND AIMS:
Cross-sectional studies have shown that magnetic resonance elastography (MRE) is accurate in the noninvasive detection of advanced fibrosis in nonalcoholic fatty liver disease (NAFLD). However, there are limited data on the longitudinal association between an increase in liver stiffness on MRE and fibrosis progression in NAFLD. Therefore, using a well-characterized prospective cohort of patients with biopsy-proven NAFLD, we aimed to examine the longitudinal association between a 15% increase in liver stiffness on MRE and fibrosis progression in NAFLD.
APPROACH AND RESULTS:
This prospective cohort study included 102 patients (62.7% women) with biopsy-proven NAFLD who underwent contemporaneous MRE and liver biopsy at baseline followed by a repeat paired liver biopsy and MRE assessment. The primary outcome was odds of fibrosis progression by one or more stage as assessed by the Nonalcoholic Steatohepatitis Clinical Research Network histologic scoring system. The mean (±SD) of age and body mass index (BMI) were 52 (±14) years and 32.6 (±5.3) kg/m2, respectively. The median time interval between the two paired assessments was 1.4 years (interquartile range 2.15 years). The number of patients with fibrosis stages 0, 1, 2, 3, and 4 was 27, 36, 12, 17, and 10, respectively. In unadjusted analysis, a 15% increase in MRE was associated with increased odds of histologic fibrosis progression (odds ratio [OR], 3.56; 95% confidence interval [CI], 1.17–10.76; P = 0.0248). These findings remained clinically and statistically significant even after multivariable adjustment for age, sex, and BMI (adjusted OR, 3.36; 95% CI, 1.10–10.31; P = 0.0339). A 15% increase in MRE was the strongest predictor of progression to advanced fibrosis (OR, 4.90; 95% CI, 1.35–17.84; P = 0.0159).
CONCLUSIONS:
A 15% increase in liver stiffness on MRE may be associated with histologic fibrosis progression and progression from early fibrosis to advanced fibrosis. (Hepatology 2020;0:1–12).
Nonalcoholic fatty liver disease (NAFLD) is an increasingly common cause of liver disease and is projected to be a leading cause of liver-related morbidity and mortality.(1–3) Among patients with NAFLD, fibrosis stage is the strongest predictor of mortality,(4–6) and liver biopsy remains the gold standard for determining disease activity and fibrosis stage. However, histologic lesions in NAFLD can be heterogeneously distributed,(7) making liver biopsy prone to sampling error, particularly in the assessment of longitudinal changes in NAFLD activity. Advanced imaging techniques, including magnetic resonance imaging (MRI)–based proton density fat fraction, have allowed for more accurate assessment of changes in liver fat.
Recently, noninvasive tests (NITs) of liver fibrosis have emerged as potential surrogate markers for the cross-sectional assessment of fibrosis severity in NAFLD.(8) Serum-based NITs include either combinations of readily available laboratory and demographic data or combinations of measurements of molecules associated with the underlying pathogenesis of NAFLD. The NAFLD fibrosis score (NFS) and FIB-4 index are the best-studied clinical prediction rules in NAFLD; and despite high negative predictive value to exclude advanced fibrosis,(9) both tests have limited diagnostic accuracy for lesser stages of fibrosis, and approximately 30% of patients have indeterminate values.(10,11) Imaging-based NITs, most commonly vibration-controlled transient elastography (VCTE) and magnetic resonance elastography (MRE), measure liver stiffness, which correlates with fibrosis severity. VCTE is inexpensive and can be measured in the clinic but has inferior diagnostic performance in head-to-head comparison studies with MRE, particularly for lower stages of fibrosis and in the morbidly obese.(12–14)
In contrast to liver biopsy, MRE evaluates a much larger volume of the total liver (~5%), is reproducible,(15) and has high interobserver agreement.(16) While cross-sectional studies have demonstrated that MRE has superior diagnostic performance in NAFLD, there are limited longitudinal data on the association between changes in MRE and liver fibrosis on paired liver biopsies. Weight loss is associated with an improvement in liver histology,(17) and clinically significant weight loss is associated with a 15% change in liver stiffness on MRE,(18) which has led to the adoption of this threshold for change in multiple clinical trials of NAFLD.(19–21) Thus, we hypothesized that a 15% increase in liver stiffness on MRE is associated with fibrosis progression. Using a well-characterized, prospective cohort of patients with biopsy-proven NAFLD, we evaluated the association between a 15% increase in liver stiffness on MRE and fibrosis progression on liver biopsy.
Materials and Methods
STUDY DESIGN
This is a prospective cohort study derived from a well-characterized longitudinal cohort of patients with biopsy-proven NAFLD. This study included 102 uniquely phenotyped patients who underwent a standardized research visit: history, physical exam, and a paired liver biopsy assessment (using the Nonalcoholic Steatohepatitis Clinical Research Network [NASH CRN] histological scoring system) and MRE assessment at two points between 2011 and 2018 at the University of California at San Diego (UCSD) NAFLD Research Center.(22–26) All patients provided written informed consent prior to enrolling in the study, and the study was approved by the UCSD institutional review board.
INCLUSION AND EXCLUSION CRITERIA
Patients ≥18 years of age with biopsy-proven NAFLD and written informed consent were included. For this study, participants were included if MRE was measured contemporaneously with their baseline liver biopsy and if they had a subsequent liver biopsy and contemporaneous MRE. Participants meeting any of the following criteria were excluded from the study: significant alcohol consumption (defined as ≥14 drinks/week for men or ≥7 drinks/week for women) within the previous 2-year period; evidence of active substance use; clinical or laboratory evidence of secondary causes or chronic conditions associated with hepatic steatosis including nutritional disorders, human immunodeficiency virus infection, and use of steatogenic drugs such as amiodarone, glucocorticoids, methotrexate, l-asparaginase, and valproic acid; underlying liver disease other than NAFLD including viral hepatitis (assessed with serum hepatitis B surface antigen and hepatitis C RNA assays), hemochromatosis, Wilson’s disease, alpha-1 antitrypsin deficiency, glycogen storage disease, autoimmune hepatitis, and cholestatic or vascular liver disease; major systemic illnesses; decompensated liver disease (defined as Child-Pugh score >7 points); contraindications to MRI including metallic implants, claustrophobia, and body circumference exceeding the imaging chamber capacity; pregnancy or attempting to be pregnant; or any other conditions believed by the principal investigator to affect patient’s competence or compliance to complete the study.
CLINICAL RESEARCH EVALUATION
At baseline, all patients underwent a standardized clinical evaluation including detailed history, anthropometric exam, and laboratory test at the UCSD NAFLD Research Center. A trained clinical investigator documented information including age, sex, height, weight, body mass index (BMI), ethnicity, and vital signs. Alcohol intake history was obtained in a clinical setting and verified at the research clinic with the Alcohol Use Disorders Identification Test and the Skinner questionnaire. Other causes of liver diseases and hepatic steatosis were ruled out systematically based on history and laboratory tests. Participants were instructed to fast for a minimum of 8 hours prior to collection of laboratory tests. Alcohol intake, anthropometry, and medications were assessed at each subsequent research visit. Patients underwent repeat liver biopsy assessment for clinical indications, screening for clinical trials or per clinical trial protocol.
HISTOLOGIC EVALUATION
All patients underwent a baseline liver biopsy, followed by a second liver biopsy for assessment by an experienced liver pathologist blinded to patients’ clinical or imaging data. This study used the NASH CRN histologic scoring system, in which hepatic fibrosis was scored on a scale from 0 to 4, with stage 4 signifying cirrhosis; hepatic steatosis and lobular inflammation were scored from 0 to 3; and hepatic ballooning was scored from 0 to 2.(27) Steatosis, lobular inflammation, and hepatocyte ballooning scores were summed to obtain the NAFLD activity score,(28) which ranged from 0 to 8. Diagnosis of NASH was classified as definite NASH, NAFLD not NASH, or suspicious for NASH (“borderline” NASH). These categories were assigned prior to conducting statistical analyses.
MRI
Abdominal MRI was obtained on a single 3T MR scanner (GE Signa EXCITE HDxt; GE Healthcare, Waukesha, WI) at the UCSD MR3T Research Laboratory using described methods.(29–33) Liver stiffness was estimated using two-dimensional MRE, which is the most accurate biomarker for the quantitative assessment of liver stiffness as a surrogate for hepatic fibrosis.(13,14,34) A passive driver was fitted around the body over the liver and connected to an acoustic active driver that delivered continuous vibrations at 60 Hz to produce shear waves in the liver, which were processed to generate elastograms depicting liver stiffness. Four slices were assessed, and colocalized regions of interest were manually specified. The median and interquartile range (IQR) time interval between the baseline liver biopsy and MRI were 34 and 54 days, respectively. The median and IQR time interval between the follow-up liver biopsy and MRI were 19 and 39 days, respectively.
OUTCOME MEASURES
The primary outcome was histologic fibrosis progression by at least one stage from baseline assessment to follow-up assessment in patients without cirrhosis at baseline.
Secondary outcomes were fibrosis improvement defined as at least a one-stage improvement from baseline histologic assessment at follow-up histologic assessment in patients with fibrosis at baseline. Progression to advanced fibrosis was defined as progression from fibrosis stage 0–2 at baseline to stage 3–4 at follow-up. In addition, the association between change in liver stiffness on MRE and change in scores of clinical prediction rules for fibrosis in NAFLD including FIB-4 and NFS was assessed.
STATISTICAL ANALYSES
We hypothesized that a ≥15% increase in liver stiffness on MRE would be associated with fibrosis progression and that the risk of fibrosis progression in the group with MRE ≥15% would be 50% compared to 15% in those without a ≥15% increase in liver stiffness on MRE. Power analysis showed that a sample size of 74 (30% of whom had a ≥15% increase) would provide 80% power with a two-tailed alpha of 0.05. Therefore, we had adequate power to detect the aforementioned association with fibrosis progression. Descriptive statistics of participant demographic, laboratory, histological, and imaging characteristics at baseline were presented at baseline and follow-up. The association between change in liver stiffness dichotomized to ≥15% increase versus <15% increase, and fibrosis progression was assessed using the chi-squared test. Similarly, the association between change in liver stiffness dichotomized to ≥15% decrease versus <15% decrease, and fibrosis improvement was assessed using the chi-squared test. Univariate and multivariate logistic regression analyses to assess for the association between a ≥15% increase as the independent variable and fibrosis progression as the dependent variable was performed. Additional analysis to assess for the association between a ≥15% decrease as the independent variable and fibrosis improvement as the dependent variable was also performed. Multivariate analysis included age, sex, and BMI chosen a priori. Univariate logistic regression of baseline and change in predictors of progression to advanced fibrosis among those without advanced fibrosis at baseline was performed. The association between change in levels of FIB-4 and NFS and dichotomized change in liver stiffness by MRE was assessed with the Student t test. Statistical significance was defined as a two-tailed P value of ≤0.05. All statistical analyses were performed on SAS, version 9.4 (SAS Institute, Cary, NC).
Results
CHARACTERISTICS OF THE STUDY POPULATION
One hundred and two patients with NAFLD with paired liver biopsies and paired MRE were included. Participants had a mean age of 51.7 years and were predominantly female (63%); 39% were of Hispanic ethnicity, and the mean BMI was 32.6 kg/m2. At baseline, 92 (90%) of the 102 participants were classified as definite NASH, 8 (8%) as NAFLD not NASH, and 2 (2%) as “borderline” NASH; 27% had no fibrosis, 35% stage 1, 12% stage 2, 17% stage 3, and 10% stage 4 fibrosis (Table 1).
TABLE 1.
Clinical, Demographic, Histologic, and Imaging Characteristics at Baseline and Follow-Up
| Baseline (n = 102) | Follow-Up (n = 102) | |
|---|---|---|
| Demographic | ||
| Age in years, mean (SD) | 51.7 (13.6) | 53.4 (13.5) |
| Male, n (%) | 38 (37.3) | |
| BMI (kg/m2), mean (SD) | 32.6 (5.3) | 32.7 (5.6) |
| Race/ethnicity, n (%) | ||
| White | 43 (42.2) | |
| African American | 2 (2.0) | |
| Asian | 13 (12.7) | |
| Hispanic | 40 (39.2) | |
| Other | 4 (3.9) | |
| Diabetes, n (%) | 47 (46.1) | |
| Biochemical profile | ||
| AST (U/L), median (IQR) | 35.0 (33.0) | 33.5 (30.0) |
| ALT (U/L), median (IQR) | 45.5 (46.0) | 45.5 (46.0) |
| Alkaline phosphatase (U/l), median (IQR) | 73.5 (27.0) | 75.5 (32.0) |
| Total bilirubin (mg/dL), median (IQR) | 0.4 (0.3) | 0.4 (0.3) |
| Albumin (g/dL), median (IQR) | 4.4 (0.4) | 4.5 (0.4) |
| HOMA-IR median (IQR) | 6.5 (7.4) | 7.3 (6.1) |
| Triglycerides (mg/dL), median (IQR) | 145.5 (88.0) | 144.0 (83.0) |
| Total cholesterol (mg/dL), median (IQR) | 182.0 (48.0) | 174.0 (60.0) |
| HDL (mg/dL), median (IQR) | 43.0 (18.0) | 47.0 (19.0) |
| LDL (mg/dL), median (IQR) | 99.5 (43.0) | 93.0 (46.0) |
| Platelet count (109/L), median (IQR) | 246.0 (84.0) | 235.0 (96.0) |
| Clinical prediction rule | ||
| FIB-4 | 1.3 (1.1) | 1.2 (1.1) |
| NFS | –1.3 (2.2) | –1.4 (2.1) |
| Histology | ||
| Fibrosis stage, n (%) | ||
| 0 | 27 (26.5) | 30 (29.4) |
| 1 | 36 (35.3) | 30 (29.4) |
| 2 | 12 (11.8) | 12 (11.8) |
| 3 | 17 (16.7) | 19 (18.6) |
| 4 | 10 (9.8) | 11 (10.8) |
| NASH classification, n (%) | ||
| Not NAFLD | 0 | 3 (2.9) |
| NAFLD not NASH | 8 (7.8) | 28 (27.5) |
| Borderline NASH | 2 (2.0) | 6 (5.9) |
| Definite NASH | 92 (90.2) | 65 (63.7) |
| Steatosis grade, n (%) | ||
| 0 | 1 (1.0) | 3 (2.9) |
| 1 | 35 (34.3) | 54 (52.9) |
| 2 | 41 (40.2) | 34 (33.3) |
| 3 | 25 (24.5) | 11 (10.8) |
| Lobular inflammation grade, n (%) | ||
| 0 | 0 | 1 (1) |
| 1 | 39 (38.2) | 46 (45.1) |
| 2 | 58 (56.9) | 48 (47.1) |
| 3 | 5 (4.9) | 7 (6.9) |
| Ballooning grade, n (%) | ||
| 0 | 10 (9.8) | 31 (30.4) |
| 1 | 56 (54.9) | 54 (52.9) |
| 2 | 36 (35.3) | 17 (16.7) |
| NAS median (IQR), n (%) | 5.0 (2.0) | 4.0 (2.0) |
| Imaging | ||
| Baseline MRI-PDFF (%), mean (SD) | 14.1 (10.5) | 12.5 (10.9) |
| MRE (kPa) | 2.9 (1.4) | 2.8 (1.4) |
Abbreviations: HDL, high-density lipoprotein; HOMA-IR, Homeostatic model assessment method for insulin resistance, calculated as (fasting insulin [microunits per milliliter] × fasting glucose [millimoles per liter])/22.5; LDL, low-density lipoprotein; MRI-PDFF, MRI-based proton density fat fraction; NAS, NAFLD activity score.
At baseline and follow-up, the mean (SD) baseline MRE value was 2.9 kPa (±1.4) and 2.8 kPa (±1.4), respectively. Liver stiffness on MRE had a positive correlation with fibrosis stage (Fig. 1). MRE had excellent diagnostic accuracy for advanced fibrosis at baseline (c = 0.92) and at follow-up (c = 0.91). The median (IQR) time between biopsies was 1.4 (2.15) years and did not vary between those with and without fibrosis progression (P = 0.94 . The mean biopsy length at baseline and follow-up were 2.2 cm and 1.9 cm, respectively. At follow-up biopsy, 23 (25%) of the 92 patients without cirrhosis at baseline had fibrosis progression on histology. Among 75 patients with fibrosis at baseline, 21 (28%) had fibrosis improvement on follow-up liver biopsy. Overall, 58 patients had no change in fibrosis stage from baseline to follow-up.
FIG. 1.

Distribution of liver stiffness on MRE with box plot (y-axis) by fibrosis stage (x-axis) at baseline (left) and follow-up (right). Spearman correlation coefficients at baseline and follow-up are 0.630 and 0.655, with P values of <0.0001 and <0.0001, respectively. Abbreviation: 2D, two-dimensional.
ASSOCIATION BETWEEN A ≥15% INCREASE IN MRE AND FIBROSIS PROGRESSION
Of 92 patients without cirrhosis at baseline, 17 (18%) had a ≥15% increase in liver stiffness. Patients with a ≥15% increase in liver stiffness on MRE had more fibrosis progression than those with a <15% increase in liver stiffness on MRE (47.1% versus 20.0%, P = 0.0298) (Table 2). The diagnostic characteristics of alternate cutoff points resulted in lower specificity or decreased negative predictive value (Supporting Table S1). A ≥15% increase in liver stiffness on MRE had an unadjusted odds ratio (OR) of 3.56 (95% confidence interval [CI], 1.17–10.76; P = 0.0248) for fibrosis progression among 92 patients without cirrhosis at baseline. The association between a ≥15% increase in MRE and fibrosis progression was similar regardless of baseline fibrosis stage. In patients with F0, F1, F2, and F3 at baseline, a ≥15% increase in MRE was associated with OR (95% CI) for fibrosis progression of 6.86 (0.603–77.98), 3.47 (0.456–26.37), 7.00 (0.397–123.3), and 2.75 (0.137–55.17), respectively. After adjustment for baseline factors chosen a priori, BMI, age, and sex, the association between a ≥15% increase in liver stiffness on MRE and fibrosis progression remained statistically significant (OR, 3.36; 95% CI, 1.10–10.31; P = 0.0339) (Fig. 2).
TABLE 2.
Longitudinal Changes in Patient Characteristics by Fibrosis Progression by ≥15% Increase in MRE
| Change in Patient Characteristics | <15% Increase MRE (n = 82) | ≥15% Increase MRE (n = 20) | P |
|---|---|---|---|
| Demographic and biochemical | |||
| BMI (kg/m2) | 0 (2.1) | 0 (1.1) | 0.58 |
| AST (U/l) | −3 (20) | 5 (17) | 0.08 |
| ALT (U/l) | −3 (27) | 0 (50.5) | 0.22 |
| Alkaline phosphatase (U/l) | 1 (18) | 5.5 (19.5) | 0.07 |
| Total bilirubin (mg/dL) | 0 (0.2) | 0 (0.2) | 0.59 |
| Albumin (g/dL) | 0 (0.3) | 0 (0.3) | 0.74 |
| HOMA-IR | 0.9 (5.4) | 1.1 (3.3) | 0.79 |
| Triglycerides (mg/dL) | 3 (78) | −17 (46) | 0.08 |
| Total cholesterol (mg/dL) | 2.5 (35) | −12 (37) | 0.13 |
| HDL (mg/dL) | 1 (8) | 3 (10) | 0.99 |
| LDL (mg/dL) | −2 (31) | −2 (28) | 0.53 |
| Platelet count (109/L) | 1 (45) | 3.5 (60) | 0.62 |
| Histology | |||
| Fibrosis progression,* n (%) | 15 (20.0) | 8 (47.1) | 0.03 |
| Fibrosis improvement,† n (%) | 17 (28.8) | 4 (25.0) | 1.00 |
| No change in fibrosis, n (%) | 50 (61.0) | 8 (40.0) | 0.09 |
| Steatosis grade | 0 (1) | 0 (1.5) | 0.21 |
| Lobular inflammation grade | 0 (1) | 0 (2) | 0.73 |
| Ballooning grade | 0 (1) | 0 (1) | 0.48 |
| NAS | −1 (2) | 0 (3) | 0.14 |
| Clinical prediction rules | |||
| FIB-4 | −0.1 (0.4) | 0.1 (0.6) | 0.07 |
| NFS | −0.1 (0.7) | 0.2 (1.1) | 0.18 |
| Imaging | |||
| LSM on MRE (kPa) | −0.3 (0.6) | 0.9 (0.8) | <0.001 |
All values are median (IQR) unless otherwise specified. Bold indicates significance.
Fibrosis progression limited to patients without cirrhosis at baseline, for <15% increase on MRE and ≥15% increase on MRE n = 75 and n = 17, respectively.
Fibrosis improvement limited to patients with fibrosis at baseline, for <15% increase on MRE and ≥15% increase on MRE n = 59 and n = 16, respectively.
Abbreviations: HDL, high-density lipoprotein; HOMA-IR, homeostatic model assessment method for insulin resistance, (fasting insulin [microunits per milliliter] × fasting glucose [millimoles per liter])/22.5; LDL, low-density lipoprotein; LSM, liver stiffness measurement; NAS, NAFLD activity score.
FIG. 2.

ORs for fibrosis progression by change in liver stiffness on MRE. Abbreviation: aOR, adjusted OR.
Baseline median values of the NFS were −0.83 and −1.51 for those with and without a ≥15% increase in liver stiffness on MRE, respectively (P = 0.3453). Median changes in NFS were +0.2 and −0.8 for those with and without a ≥15% increase in liver stiffness on MRE, respectively (P = 0.1813). Baseline median values of FIB-4 were 1.39 and 1.26 for those with and without a ≥15% increase in liver stiffness on MRE, respectively (P = 0.6713). Median changes in FIB-4 were +0.13 and –0.05 for those with and without a ≥15% increase in liver stiffness on MRE, respectively (P = 0.0723) (Table 2). Increase in FIB-4, but not NFS, was associated with fibrosis progression in univariate logistic regression analysis: FIB-4 (OR, 1.40 [per 0.2-unit change]; 95% CI, 1.11–1.771; P = 0.0046) and NFS (OR 1.16 [per 0.2-unit change]; 95% CI, 0.96–4.85; P = 0.0642). The longitudinal change in MRE, liver histology, and clinical prediction rules of a representative patient are depicted in Fig. 3. Among the patients with fibrosis progression, FIB-4, NFS, aspartate aminotransferase (AST), and alanine aminotransferase (ALT) all increased in patients with ≥15% increase in MRE stiffness compared to those without (Supporting Table S2).
FIG. 3.
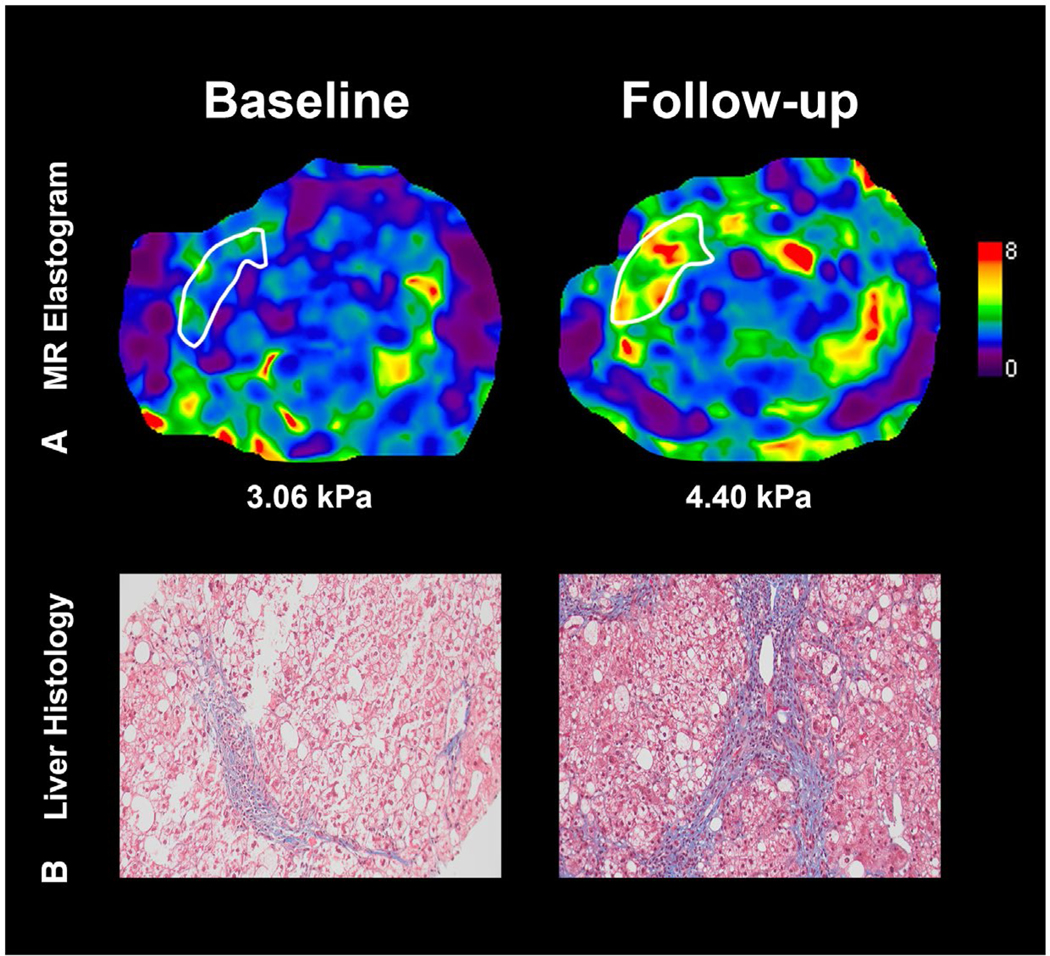
Longitudinal fibrosis progression by MRE assessment. (A) MRE of the liver. The patient’s MRE-assessed liver stiffness increased from 3.06 to 4.40 kPa (a value above 3.63 is associated with a 92% accuracy for stage 3–4 fibrosis). (B) Liver histology depicting fibrosis progression from stage 2 to stage 3 on the NASH CRN histologic scoring system at follow-up. Values of clinical prediction rules FIB-4 and NFS at baseline and follow-up were 0.96 and 0.08 and 2.10 and 0.81, respectively.
ASSOCIATION BETWEEN A ≥15% DECREASE IN MRE AND FIBROSIS IMPROVEMENT
Of 75 patients with fibrosis at baseline, 20 (27%) had a ≥15% decrease in liver stiffness. Patients with a ≥15% decrease in liver stiffness on MRE did not have more fibrosis improvement than those with a <15% decrease in liver stiffness on MRE (20% versus 31%, P = 0.3521). In sensitivity analysis excluding patients with liver biopsy length <2 cm at baseline or follow-up, 50% of patients with a ≥15% decrease in liver stiffness on MRE had fibrosis improvement compared to 22% without a ≥15% decrease in MRI; however, the difference was not statistically significant (P = 0.53).
Baseline median values of the NFS were −1.59 and −0.98 for those with and without a ≥15% decrease in liver stiffness on MRE, respectively (P = 0.6890). Median changes in NFS scores were −0.08 and −0.04 for those with and without a ≥15% decrease in liver stiffness on MRE, respectively (P = 0.4625). Baseline median values of FIB-4 were 1.27 and 1.28 for those with and without a ≥15% decrease in liver stiffness on MRE, respectively (P = 0.6462). Median changes in FIB-4 were −0.05 and −0.02 for those with and without a ≥15% decrease in liver stiffness on MRE, respectively (P = 0.3204). Neither change in FIB-4 nor NFS were associated with histologic improvement on univariate logistic regression analysis.
PREDICTORS OF RAPID PROGRESSION TO ADVANCED FIBROSIS
Seventy-five patients with F0-F2 fibrosis at baseline were at risk for progression to advanced fibrosis, of whom 7% (n = 5) progressed to advanced fibrosis at follow-up over a median (IQR) of 1.32 (0.73) years. In univariate analysis a ≥15% increase in MRE was the strongest predictor of progression to advanced fibrosis (OR, 4.90; 95% CI, 1.35–17.84; P = 0.0159). Baseline age, sex, BMI, presence of diabetes, race, and hepatocyte ballooning grade were not significantly associated with rapid progression to advanced fibrosis. Increase in AST and decrease platelet count were associated with progression to advanced fibrosis but change in ALT was not (Table 3). Additional detail regarding these 5 patients is provided in the Supporting Information. Two patients had a ≥15% increase in MRE stiffness and rapid progression, both of whom went on to develop clinically significant portal hypertension. Two patients were likely understaged at baseline by biopsy but correctly staged on MRE. Both had a longitudinal decrease on MRE. One of these patients had a third liver biopsy with improvement in liver fibrosis, supporting the veracity of the MRE improvement. Importantly, the patients’ NITs also improved. The other patient had an NFS and MRE consistent with advanced fibrosis at baseline but had stage 1 fibrosis on liver histology. Follow-up liver biopsy 16 months later revealed stage 3 fibrosis. Finally, one patient with minimal change on MRE may have had overstaged liver fibrosis on liver histology compared to MRE. The patient had a third liver biopsy 3 years later revealing stage 0 fibrosis, which was consistent with prior MRE results.
TABLE 3.
Univariate Predictors of Progression to Advanced Fibrosis, n = 75
| Univariate Predictors | OR (95% CI) | P |
|---|---|---|
| Baseline factors | ||
| Age (year) | 0.99 (0.96–1.03) | 0.6106 |
| Female | 1.86 (0.65–5.32) | 0.2492 |
| BMI (kg/m2) | 1.06 (0.96–1.19) | 0.2573 |
| Diabetes | 1.09 (0.39–3.03) | 0.8673 |
| Race (white versus other) | 2.03 (0.73–5.63) | 0.1758 |
| Hepatocyte ballooning (grade 2 versus 0–1) | 0.99 (0.30–3.22) | 0.9808 |
| Change in factors | ||
| MRE ≥15% increase in LSM | 4.90 (1.35–17.84) | 0.0159 |
| AST (U/L) | 1.02 (1.00–1.04) | 0.0424 |
| ALT (U/L) | 1.01 (1.00–1.02) | 0.0917 |
| Platelet count (109/L) | 0.99 (0.97–1.00) | 0.0380 |
| BMI (kg/m2) | 1.27 (0.95–1.69) | 0.1139 |
Bold indicates significance.
Discussion
MAIN FINDINGS
Using a prospective, longitudinal cohort of well-characterized NAFLD patients with paired liver biopsies and paired MRE measurements, we demonstrate that a 15% increase in MRE was associated with histologic fibrosis progression and that this association remained significant despite adjustment for age, sex, and BMI. Importantly, a subset of patients with NAFLD may have rapid histologic progression to advanced fibrosis, and a 15% increase in MRE was the strongest predictor of progression from early fibrosis to advanced fibrosis and helped distinguish true progression from possible biopsy misclassification in 5 patients with long-term follow-up. In this study, a 15% improvement in MRE was not associated with fibrosis improvement. These data suggest that a ≥15% increase in liver stiffness on MRE may help identify patients with early fibrosis who are progressing to advanced fibrosis.
IN CONTEXT WITH PUBLISHED LITERATURE
With fibrosis stage established as the strongest predictor of outcomes in patients with NAFLD, change in fibrosis stage has been recognized as an important endpoint in both treatment trials and the clinical management of NAFLD. Progression in fibrosis may indicate the need for screening for hepatocellular carcinoma or esophageal varices and in the future may represent an indication for pharmacologic intervention. Current NITs have been limited in their ability to detect NAFLD fibrosis progression. A key component of this limitation may be related to the inherent limitations of liver biopsy as a gold standard that has substantial diagnostic limitations based on the size of the sample, (35) heterogeneous distribution of the disease,(7) and interobserver variability(36) in pathologic interpretation.
The ability of serum NITs to predict changes in histologic fibrosis is mixed. While baseline levels of the enhanced liver fibrosis (ELF) panel were associated with progression to cirrhosis and hepatic decompensation in a secondary analysis of the simtuzumab trial, change in ELF was not associated with progression to cirrhosis.(37) Similarly, changes in FIB-4 were not associated with fibrosis improvement in a secondary analysis of a trial of lifestyle intervention; however, change in NFS was associated with change in fibrosis.(38) In a secondary analysis of the Farnesoid X Nuclear Receptor Ligand Obeticholic Acid in NASH Treatment trial comparing obeticholic acid to placebo among patients with biopsy-proven NASH, a change in FIB-4, but not NFS, was associated with fibrosis improvement.(39) Optimal thresholds for change in VCTE measurement associated with one-stage progression or regression have not yet been defined in NAFLD. In chronic hepatitis C, VCTE values improve with sustained virological response before putative fibrosis improvement.(40) A secondary analysis of a phase 2 clinical trial demonstrated that change in MRE correlated with changes in fibrosis but was limited to only 8 patients with fibrosis progression and 24 weeks of follow-up.(21)
This study incorporated a substantially larger sample size and longer follow-up and demonstrated that an increase in MRE is associated with histologic disease progression independent of age, sex, and BMI. The optimal cutoff point for increase in a biomarker depends upon the within-person coefficient of variation, which is low (7%) for MRE based on a recent meta-analysis.(41) This coefficient of variation was the basis for the recommendation from the Quantitative Imaging Biomarkers Alliance that a 19% change in MRE coincides with 95% confidence of a true change. Importantly, the meta-analysis included studies with substantial heterogeneity, and many studies did not report if the patients were imaged in fasting conditions, which could contribute to greater within-person variation. In this study all imaging was performed at the NAFLD Research Center, UCSD, which has substantial experience with MRE; and patients were imaged in the fasting state. Therefore, a lower threshold of change, a 15% increase, can be reasonably associated with high confidence for a true change in liver stiffness.
Importantly, MRE demonstrated excellent cross-sectional diagnostic accuracy in this study, and the association between a 15% increase in MRE and fibrosis progression was similar regardless of the baseline stage of fibrosis. A ≥15% increase in MRE may be useful in detecting changes in earlier stages of fibrosis, which parallels the superior cross-sectional diagnostic accuracy of MRE compared to other NITs among patients with early fibrosis.
STRENGTHS AND LIMITATIONS
Although our study provides a rigorous evaluation of the association between longitudinal changes in liver histology and MRE among patients with NAFLD, certain limitations exist. Fibrosis progression in NAFLD is typically slow, with a previous meta-analysis finding that on average patients with NASH progress one stage of fibrosis every 7 years.(42) Importantly, 20% of patients who progressed in this meta-analysis, did so rapidly; and if validated, change in MRE may serve as an NIT to detect this high risk population. In our study, patients with rapid progression (n = 5) had long-term follow-up, which demonstrated that 60% of them may have been misclassified by liver biopsy and may not reflect true histologic progression. The patients with histologic progression and a ≥15% increase in MRE went on to develop cirrhosis with portal hypertension, suggesting that a longitudinal increase in MRE may help discriminate true rapid progression from possible biopsy misclassification. Larger multicenter studies of patients with rapid histologic progression and data on changes in NITs are needed to better discriminate possible biopsy misclassification from true disease progression. A 15% decrease in liver stiffness on MRE was not associated with fibrosis improvement in our study; therefore, a 15% threshold of change in liver stiffness cannot be used as a marker of histologic improvement. However, in sensitivity analysis limited to patients with biopsy length ≥2 cm at baseline and follow-up, patients with a ≥15% decrease in MRE had more fibrosis improvement, albeit not statistically significant. This highlights a potential limitation of liver biopsy as an imperfect gold standard and warrants further study before dismissing the potential prognostic value of an improvement in liver stiffness on MRE. Furthermore, due to the limited number of patients who progressed by greater than one stage of fibrosis (n = 4) a “dose response” could not be sufficiently characterized. The limited number of patients with disease progression also led to wide confidence intervals and limits our ability to perform multivariate adjustment; therefore, validation studies are required. In addition, while MRE was associated with fibrosis progression, its sensitivity in this study was not adequate for it to serve as a stand-alone noninvasive biomarker of fibrosis progression. Determining if this limitation is related to using histology as a reference will require larger long-term studies with assessment of histology-independent outcomes including hepatic decompensation and death. Finally, MRE is not widely available; however, MRI is broadly available, and with increasing automation, cross-platform compatibility, and minimal additional hardware requirements, broader use of MRE is potentially feasible where MRI is available.
IMPLICATIONS FOR FUTURE RESEARCH
This study provides evidence that longitudinal changes in MRE are associated with histologic fibrosis progression. Furthermore, these findings appear robust to adjustment for patient demographics and demonstrate similar performance across the spectrum of fibrosis. Larger, multicenter studies validating these findings and evaluating a possible association between improvement in MRE and histologic improvement in fibrosis are warranted. Additional studies are needed to assess the association between baseline and change in liver stiffness on MRE and clinical outcomes including progression to cirrhosis, hepatic decompensation, and mortality. In conclusion, our study demonstrates that a 15% increase in MRE is associated with fibrosis progression including the transition from early fibrosis to advanced fibrosis, which is associated with an exponential increase in the risk of liver-related mortality for patients with NAFLD. These data require further validation in a larger multicenter study linking change in MRE with liver-related outcomes.
Supplementary Material
Acknowledgments
Supported by Atlantic Philanthropies, Inc., and the John A. Hartford Foundation; additional support from the National Institute of Environmental Health Sciences (5P42ES010337, to R.L.), the National Center for Advancing Translational Sciences (5UL1TR001442, to R.L.), the National Institute of Diabetes and Digestive and Kidney Diseases (R01DK106419, P30DK120515, to R.L.), the Department of Defense’s Peer Reviewed Cancer Research Program (CA170674P2, to R.L.), and the American Association for the Study of Liver Diseases Foundation Clinical and Translational Research Award (to V.A.).
Abbreviations:
- ALT
alanine aminotransferase
- AST
aspartate aminotransferase
- BMI
body mass index
- CI
confidence interval
- IQR
interquartile range
- MRE
magnetic resonance elastography
- MRI
magnetic resonance imaging
- NAFLD
nonalcoholic fatty liver disease
- NASH
nonalcoholic steatohepatitis
- NASH CRN
Nonalcoholic Steatohepatitis Clinical Research Network
- NFS
NAFLD fibrosis score
- NIT
noninvasive test
- OR
odds ratio
- UCSD
University of California at San Diego
- VCTE
vibration-controlled transient elastography
Footnotes
The content is solely the responsibility of the authors and does not necessarily represent the official views of the National Institutes of Health.
Supporting Information
Additional Supporting Information may be found at onlinelibrary.wiley.com/doi/10.1002/hep.30974/suppinfo.
Potential conflict of interest: Dr. Loomba serves as a consultant or advisory board member for Bird Rock Bio, Celgene, Enanta, GRI Bio, Madrigal, Metacrine, NGM, Sanofi, Arrowhead Research, Galmed, NGM, GNI, NovoNordisk, Merck, Siemens, Pfizer, Gilead. Glympsebio, In addition, his institution has received grant support from Allergan, BMS, BI, Daiichi-Sankyo Inc., Eli-Lilly, Galectin, Galmed, GE, Genfit, Intercept, Janssen Inc, Madrigal, Merck, NGM, Pfizer, Prometheus, Siemens, and Sirius. He is also co-founder of Liponexus Inc. Dr. Sirlin consults, is on the speakers’ bureau for, and received grants from Bayer and GE Healthcare. He consults for and advises AMRA. He consults for Epigenomics, Boehringer-Ingelheim, Fulcrum, and IBM. He advises Guerbet and Bristol-Myers Squibb. He received grants from Gilead, Siemens, GE MRI, GE Digital, GE US, ACR Innovation, Philips, Celgene, Enanta, ICON Medical Imaging, Shire, Virtualscopics, Intercept, Synageva, Takeda, Genzyme, Janssen, NuSirt, Celgene-Parexel, and Organovo.
REFERENCES
- 1).Younossi ZM, Koenig AB, Abdelatif D, Fazel Y, Henry L, Wymer M. Global epidemiology of nonalcoholic fatty liver disease—meta-analytic assessment of prevalence, incidence, and outcomes. Hepatology 2016;64:73–84. [DOI] [PubMed] [Google Scholar]
- 2).Loomba R, Sanyal AJ. The global NAFLD epidemic. Nat Rev Gastroenterol Hepatol 2013;10:686–690. [DOI] [PubMed] [Google Scholar]
- 3).Estes C, Razavi H, Loomba R, Younossi Z, Sanyal AJ. Modeling the epidemic of nonalcoholic fatty liver disease demonstrates an exponential increase in burden of disease. Hepatology 2018;67:123–133. [DOI] [PMC free article] [PubMed] [Google Scholar]
- 4).Dulai PS, Singh S, Patel J, Soni M, Prokop LJ, Younossi Z, et al. Increased risk of mortality by fibrosis stage in nonalcoholic fatty liver disease: systematic review and meta-analysis. Hepatology 2017;65:1557–1565. [DOI] [PMC free article] [PubMed] [Google Scholar]
- 5).Angulo P, Kleiner DE, Dam-Larsen S, Adams LA, Bjornsson ES, Charatcharoenwitthaya P, et al. Liver fibrosis, but no other histologic features, is associated with long-term outcomes of patients with nonalcoholic fatty liver disease. Gastroenterology 2015;149:389–397. [DOI] [PMC free article] [PubMed] [Google Scholar]
- 6).Ekstedt M, Hagstrom H, Nasr P, Fredrikson M, Stal P, Kechagias S. Fibrosis stage is the strongest predictor for disease-specific mortality in NAFLD after up to 33 years of follow-up. Hepatology 2015;61:1547–1554. [DOI] [PubMed] [Google Scholar]
- 7).Ratziu V, Charlotte F, Heurtier A, Gombert S, Giral P, Bruckert E, et al. Sampling variability of liver biopsy in nonalcoholic fatty liver disease. Gastroenterology 2005;128:1898–1906. [DOI] [PubMed] [Google Scholar]
- 8).Castera L, Friedrich-Rust M, Loomba R. Noninvasive assessment of liver disease in patients with nonalcoholic fatty liver disease. Gastroenterology 2019;156:1264–1281. [DOI] [PMC free article] [PubMed] [Google Scholar]
- 9).Xiao G, Zhu S, Xiao X, Yan L, Yang J, Wu G. Comparison of laboratory tests, ultrasound, or magnetic resonance elastography to detect fibrosis in patients with nonalcoholic fatty liver disease: a meta-analysis. Hepatology 2017;66:1486–1501. [DOI] [PubMed] [Google Scholar]
- 10).Vilar-Gomez E, Chalasani N. Non-invasive assessment of nonalcoholic fatty liver disease: clinical prediction rules and blood-based biomarkers. J Hepatol 2018;68:305–315. [DOI] [PubMed] [Google Scholar]
- 11).McPherson S, Hardy T, Dufour JF, Petta S, Romero-Gomez M, Allison M, et al. Age as a confounding factor for the accurate non-invasive diagnosis of advanced NAFLD fibrosis. Am J Gastroenterol 2017;112:740–751. [DOI] [PMC free article] [PubMed] [Google Scholar]
- 12).Hsu C, Caussy C, Imajo K, Chen J, Singh S, Kaulback K, et al. Magnetic resonance vs transient elastography analysis of patients with nonalcoholic fatty liver disease: a systematic review and pooled analysis of individual participants. Clin Gastroenterol Hepatol 2019;17:630–637. [DOI] [PMC free article] [PubMed] [Google Scholar]
- 13).Park CC, Nguyen P, Hernandez C, Bettencourt R, Ramirez K, Fortney L, et al. Magnetic resonance elastography vs transient elastography in detection of fibrosis and noninvasive measurement of steatosis in patients with biopsy-proven nonalcoholic fatty liver disease. Gastroenterology 2017;152:598–607. [DOI] [PMC free article] [PubMed] [Google Scholar]
- 14).Imajo K, Kessoku T, Honda Y, Tomeno W, Ogawa Y, Mawatari H, et al. Magnetic resonance imaging more accurately classifies steatosis and fibrosis in patients with nonalcoholic fatty liver disease than transient elastography. Gastroenterology 2016;150:626–637. [DOI] [PubMed] [Google Scholar]
- 15).Venkatesh SK, Wang G, Teo LL, Ang BW. Magnetic resonance elastography of liver in healthy Asians: normal liver stiffness quan-tification and reproducibility assessment. J Magn Reson Imaging 2014;39:1–8. [DOI] [PubMed] [Google Scholar]
- 16).Runge JH, Bohte AE, Verheij J, Terpstra V, Nederveen AJ, van Nieuwkerk KM, et al. Comparison of interobserver agreement of magnetic resonance elastography with histopathological staging of liver fibrosis. Abdom Imaging 2014;39:283–290. [DOI] [PubMed] [Google Scholar]
- 17).Vilar-Gomez E, Martinez-Perez Y, Calzadilla-Bertot L, Torres-Gonzalez A, Gra-Oramas B, Gonzalez-Fabian L, et al. Weight loss through lifestyle modification significantly reduces features of nonalcoholic steatohepatitis. Gastroenterology 2015;149:367–378. e365; quiz e314–365. [DOI] [PubMed] [Google Scholar]
- 18).Patel NS, Hooker J, Gonzalez M, Bhatt A, Nguyen P, Ramirez K, et al. Weight loss decreases magnetic resonance elastography estimated liver stiffness in nonalcoholic fatty liver disease. Clin Gastroenterol Hepatol 2017;15:463–464. [DOI] [PMC free article] [PubMed] [Google Scholar]
- 19).Loomba R, Lawitz E, Mantry PS, Jayakumar S, Caldwell SH, Arnold H, et al. The ASK1 inhibitor selonsertib in patients with nonalcoholic steatohepatitis: a randomized, phase 2 trial. Hepatology 2018;67:549–559. [DOI] [PMC free article] [PubMed] [Google Scholar]
- 20).Sanyal A, Charles ED, Neuschwander-Tetri BA, Loomba R, Harrison SA, Abdelmalek MF, et al. Pegbelfermin (BMS-986036), a PEGylated fibroblast growth factor 21 analogue, in patients with non-alcoholic steatohepatitis: a randomised, double-blind, placebo-controlled, phase 2a trial. Lancet 2019;392:2705–2717. [DOI] [PubMed] [Google Scholar]
- 21).Jayakumar S, Middleton MS, Lawitz EJ, Mantry PS, Caldwell SH, Arnold H, et al. Longitudinal correlations between MRE, MRI-PDFF, and liver histology in patients with non-alcoholic steatohepatitis: analysis of data from a phase II trial of selonsertib. J Hepatol 2019;70:133–141. [DOI] [PubMed] [Google Scholar]
- 22).Le TA, Chen J, Changchien C, Peterson MR, Kono Y, Patton H, et al. Effect of colesevelam on liver fat quantified by magnetic resonance in nonalcoholic steatohepatitis: a randomized controlled trial. Hepatology 2012;56:922–932. [DOI] [PMC free article] [PubMed] [Google Scholar]
- 23).Loomba R, Sirlin CB, Ang B, Bettencourt R, Jain R, Salotti J, et al. Ezetimibe for the treatment of nonalcoholic steatohepatitis: assessment by novel magnetic resonance imaging and magnetic resonance elastography in a randomized trial (MOZART trial). Hepatology 2015;61:1239–1250. [DOI] [PMC free article] [PubMed] [Google Scholar]
- 24).Loomba R, Schork N, Chen CH, Bettencourt R, Bhatt A, Ang B, et al. Heritability of hepatic fibrosis and steatosis based on a prospective twin study. Gastroenterology 2015;149:1784–1793. [DOI] [PMC free article] [PubMed] [Google Scholar]
- 25).Doycheva I, Cui J, Nguyen P, Costa EA, Hooker J, Hofflich H, et al. Non-invasive screening of diabetics in primary care for NAFLD and advanced fibrosis by MRI and MRE. Aliment Pharmacol Ther 2016;43:83–95. [DOI] [PMC free article] [PubMed] [Google Scholar]
- 26).Loomba R, Cui J, Wolfson T, Haufe W, Hooker J, Szeverenyi N, et al. Novel 3D magnetic resonance elastography for the noninvasive diagnosis of advanced fibrosis in NAFLD: a prospective study. Am J Gastroenterol 2016;111:986–994. [DOI] [PMC free article] [PubMed] [Google Scholar]
- 27).Kleiner DE, Brunt EM, Van Natta M, Behling C, Contos MJ, Cummings OW, et al. Design and validation of a histological scoring system for nonalcoholic fatty liver disease. Hepatology 2005;41:1313–1321. [DOI] [PubMed] [Google Scholar]
- 28).Neuschwander-Tetri BA, Loomba R, Sanyal AJ, Lavine JE, Van Natta ML, Abdelmalek MF, et al. Farnesoid X nuclear receptor ligand obeticholic acid for non-cirrhotic, non-alcoholic steatohepatitis (FLINT): a multicentre, randomised, placebo-controlled trial. Lancet 2015;385:956–965. [DOI] [PMC free article] [PubMed] [Google Scholar]
- 29).Tang A, Desai A, Hamilton G, Wolfson T, Gamst A, Lam J, et al. Accuracy of MR imaging–estimated proton density fat fraction for classification of dichotomized histologic steatosis grades in nonalcoholic fatty liver disease. Radiology 2015;274:416–425. [DOI] [PMC free article] [PubMed] [Google Scholar]
- 30).Tang A, Tan J, Sun M, Hamilton G, Bydder M, Wolfson T, et al. Nonalcoholic fatty liver disease: MR imaging of liver proton density fat fraction to assess hepatic steatosis. Radiology 2013;267:422–431. [DOI] [PMC free article] [PubMed] [Google Scholar]
- 31).Reeder SB, Robson PM, Yu H, Shimakawa A, Hines CD, McKenzie CA, et al. Quantification of hepatic steatosis with MRI: the effects of accurate fat spectral modeling. J Magn Reson Imaging 2009;29:1332–1339. [DOI] [PMC free article] [PubMed] [Google Scholar]
- 32).Hines CD, Frydrychowicz A, Hamilton G, Tudorascu DL, Vigen KK, Yu H, et al. T(1) independent, T(2) (*) corrected chemical shift based fat-water separation with multi-peak fat spectral modeling is an accurate and precise measure of hepatic steatosis. J Magn Reson Imaging 2011;33:873–881. [DOI] [PMC free article] [PubMed] [Google Scholar]
- 33).Permutt Z, Le TA, Peterson MR, Seki E, Brenner DA, Sirlin C, et al. Correlation between liver histology and novel magnetic resonance imaging in adult patients with non-alcoholic fatty liver disease—MRI accurately quantifies hepatic steatosis in NAFLD. Aliment Pharmacol Ther 2012;36:22–29. [DOI] [PMC free article] [PubMed] [Google Scholar]
- 34).Hsu E, Feghali-Bostwick CA. Insulin-like growth factor-II is increased in systemic sclerosis–associated pulmonary fibrosis and contributes to the fibrotic process via Jun N-terminal kinase- and phosphatidylinositol-3 kinase-dependent pathways. Am J Pathol 2008;172:1580–1590. [DOI] [PMC free article] [PubMed] [Google Scholar]
- 35).Bedossa P, Dargere D, Paradis V. Sampling variability of liver fibrosis in chronic hepatitis C. Hepatology 2003;38:1449–1457. [DOI] [PubMed] [Google Scholar]
- 36).Merriman RB, Ferrell LD, Patti MG, Weston SR, Pabst MS, Aouizerat BE, et al. Correlation of paired liver biopsies in morbidly obese patients with suspected nonalcoholic fatty liver disease. Hepatology 2006;44:874–880. [DOI] [PubMed] [Google Scholar]
- 37).Harrison SA, Abdelmalek MF, Diehl AM, Caldwell S, Shiffman ML, Ghalib R, et al. Prospective validation of the enhanced liver fibrosis (ELF) test for the prediction of disease progression in patients with nonalcoholic steatohepatitis (NASH) and advanced fibrosis. Hepatology 2017;66:1120A–1121A. [Google Scholar]
- 38).Vilar-Gomez E, Calzadilla-Bertot L, Friedman SL, Gra-Oramas B, Gonzalez-Fabian L, Lazo-Del Vallin S, et al. Serum biomarkers can predict a change in liver fibrosis 1 year after lifestyle intervention for biopsy-proven NASH. Liver Int 2017;37:1887–1896. [DOI] [PubMed] [Google Scholar]
- 39).Chalasani N, Abdelmalek MF, Loomba R, Kowdley KV, McCullough AJ, Dasarathy S, et al. Relationship between three commonly used non-invasive fibrosis biomarkers and improvement in fibrosis stage in patients with non-alcoholic steatohepatitis. Liver Int 2019;39:924–932. [DOI] [PMC free article] [PubMed] [Google Scholar]
- 40).Ogawa E, Furusyo N, Toyoda K, Takeoka H, Maeda S, Hayashi J. The longitudinal quantitative assessment by transient elastography of chronic hepatitis C patients treated with pegylated interferon alpha-2b and ribavirin. Antiviral Res 2009;83:127–134. [DOI] [PubMed] [Google Scholar]
- 41).Serai SD, Obuchowski NA, Venkatesh SK, Sirlin CB, Miller FH, Ashton E, et al. Repeatability of MR elastography of liver: a meta-analysis. Radiology 2017;285:92–100. [DOI] [PMC free article] [PubMed] [Google Scholar]
- 42).Singh S, Allen AM, Wang Z, Prokop LJ, Murad MH, Loomba R. Fibrosis progression in nonalcoholic fatty liver vs nonalcoholic steatohepatitis: a systematic review and meta-analysis of paired-biopsy studies. Clin Gastroenterol Hepatol 2015;13:643–654. [DOI] [PMC free article] [PubMed] [Google Scholar]
Associated Data
This section collects any data citations, data availability statements, or supplementary materials included in this article.