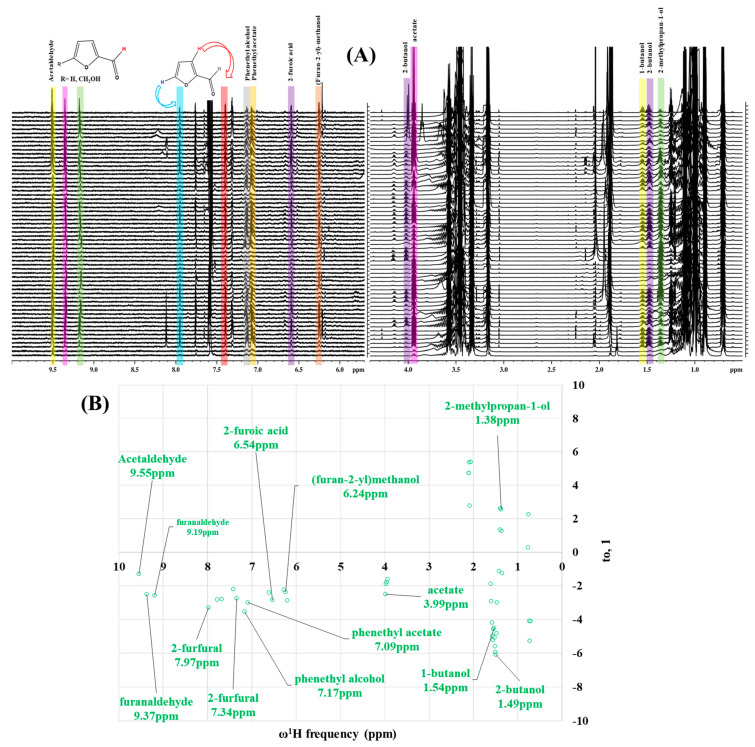
Abstract
The oenological industry has benefited from the use of Nuclear Magnetic Resonance (1H-NMR) spectroscopy in combination with Multivariate Statistical Analysis (MSA) as a foodomics tool for retrieving discriminant features related to geographical origins, grape varieties, and further quality controls. Said omics methods have gained such attention that Intergovernmental Organizations and Control Agencies are currently recommending their massive use amongst countries as quality compliances for tracking standard and degradation parameters, fermentation products, polyphenols, amino acids, geographical origins, appellations d’origine contrôlée and type of monovarietal strains in wines. This study presents, for the first time, a 1H-NMR/MSA profiling of industrial Mexican wines, finding excellent statistical features to discriminate between oenological regions and grape varieties with supervised Orthogonal Projections to Latent Structures Discriminant Analysis (OPLS-DA). In a comparative way, it is applied with the 1H-NMR/OPLS-DA workflow for the first time in ancestral and artisanal Mexican mezcals with promising results to discriminate between regions, agave species and manufacturing processes. The central aim of this comparative study is to extrapolate the know-how of wine-omics into the non-professionalized mezcal industry for establishing the NMR acquisition, preprocessing and statistical analysis basis to implement novel, non-invasive and highly reproducible regional, agave species and manufacturing-quality controls.
Keywords: ancestral and artisanal mezcals, industrialized wines, proton nuclear magnetic resonance, supervised orthogonal projections to latent structures discriminant analysis
1. Introduction
Robust analytical methods to determine food quality attributes, identity and authenticity remain a priority task within their chain supply, to preserve consumers’ protection. Each food matrix possesses intrinsic metabolites related to their manufacturing such as shikimic or caftaric acids in wines [1] or furfural moieties in agave spirits [2,3]. The full set of said primary and/or special metabolites that are intrinsic to the food matrix growth and manufacture at specific conditions and locations can be identified and targeted with the use of omics multisampling technology such as spectroscopic or spectrometric techniques, in order to obtain discriminant observables related to geographical origins, varieties, manufacturing processes, authenticity, amongst others [4,5].
The combination of high-reproducible, non-invasive, rapid and simple-use proton Nuclear Magnetic Resonance Spectroscopy (1H-NMR) with Multivariate Statistical Analysis (MSA) for foodstuff metabolomics (foodomics) [6] has emerged over the last decades for the implementation of models to trace food quality, origin, manufacture, or authenticity. 1H-NMR metabolomics has been implemented in foodstuff for tracing authenticity and adulterations in acacia honeys by means of sugar profiles [7], discriminations between orange and pulp wash juices as a tool for controlling adulteration practices [8], characterization of the compositional changes in “Tommy Atkins” cultivar mango juices to control postharvest quality [9], quality assessment in traditional balsamic vinegar of Modena according to the ageing process [10] and determination of some compounds defining the originality of Swiss Emmental cheese and discrimination of the studied samples according to their geographical origins [11,12].
Comprising 1H-NMR/MSA metabolomics for analysis of the spirits, several reports have emerged over the last decade. Godelman et al. [1] applied the basis of water-to-ethanol multipresaturation during mixing times and recovery delays with 1D-NOESY schemes in approximately 600 German wine samples, for obtaining the data matrix for classifying grape varieties, geographical origins and ageing of five wine-growing areas of southern Germany (Rheinpfalz, Rheinhessen, Mosel, Baden, and Württemberg) with principal component analysis (PCA), linear discrimination analysis (LDA) and multivariate analysis of variance (MANOVA). Noticeable improvements to generate discriminative features within the NMR data matrix of German wine samples were achieved with Independent component Analysis (ICA) combined with LDA [13]. With the use of a T1-relaxation filter as a strategy for ethanol suppression instead of water-to-ethanol multi-suppression, proton NMR profiling in combination with PCA, LDA and hierarchical cluster analysis (HCA) was used to discriminate between Italian “Fiano di Avellino” wines produced with the same grape variety, but fermented with commercial or autochthonous yeast starters [14]. Recently, 1H-NMR targeted metabolomics were used to discriminate between Chinese wine regions [15] and varieties such as Cabernet Sauvignon, Merlot and Cabernet Gernischt dry red wines [16], as well as different Chardonnay dry white wines treated with different inactive yeasts prior to ageing [17]. Discriminative features came, respectively, from ethyl acetate, lactic acid, alanine, succinic acid, proline, malic acid, gallic acid (red wines) and 2,3-butanediol, ethyl acetate, malic acid, valine, succinic acid, lactic acid, tartaric acid, glycerol, gallic acid, choline, proline, and alanine (white wines) spin systems. Furthermore, specific oenological improvements such as the use of Hanseniaspora vineae yeast strains for enhancing aromatic profiles in Spanish Albillo white wines, with respect standard fermentations, was evaluated with both 1H-NMR and GC-FID targeted metabolomics [18].
As for wine metabolomics, several improvements have been reported for other commercial alcoholic beverages such as beer [19,20] or whisky [21,22]. In contrast, few reports have emerged comprising the use of NMR/MSA metabolomics for the profiling and/or targeting of North and Central Latin America agave spirits such as tequila or mezcal. Regarding mezcal, its manufacture involves harvesting, cooking, milling, yeast-free fermentation and double distillation of agave’s hearts [23,24,25,26], in agreement with its Nahuatl etymology: Metlixcalli which means oven-cooked agaves. Certified mezcals are classified by local regulations by at least three general classes: industrial, artisanal, and ancestral mezcal [27]. Ancestral mezcal is defined as the spirit manufactured by exclusively pit-cooking and mallet or stone-milling the maguey (agave’s common name), with a final distillation comprising a direct heating of the raw fermented material contained in clay pots that are sealed with clay or wooden jackets, by preserving the heating with agave’s bagasse. The use of stainless steel in ancestral mezcal production is not authorized. In contrast, artisanal mezcal can use mechanical shredders for milling, and copper alembics or stainless-steel pots for distillation. Nevertheless, the use of autoclaves for cooking, diffusers to extract juices from cooked maguey and column stills for distillation is prohibited for artisanal mezcal. In Mexico, the appellation d’origine contrôlée (AOC) or controlled designation of origin for mezcals is granted for specific counties in the States of Oaxaca, San Luis Potosí, Puebla, Guerrero, Guanajuato, Durango, Tamaulipas, Zacatecas and Michoacán. Majorly, the commercial mezcals offered from these regions are produced under artisanal practices [28]. All 100% designed mezcals shall not have other sugar source during fermentation rather than those provided by agave sources.
Despite the intrinsic human heritage that implies the fusion between pre-Hispanic fermentations with European distillation processes that derived into ancestral and artisanal mezcals [29], these processes not surprisingly lack standardizations that can guarantee quality and reproducibility amongst batches [24,28]. Mezcals are regulated by the Mexican Official Norm No. NOM-070-SCFI-2016, wherein the essential quality attributes required for compliance are: (i) alcohol by volume [30], (ii) higher alcohol contents [31] (iii) methanol content [32] and ash/dry matter content [33]. Such technical controls are adapted to mezcals’ traditional processes and are not as strict as the compliances required for equivalent spirits such as tequila [34], revealing, in turn, the necessity to find strategies for providing standardization of artisanal or ancestral processes.
The present work uses the combination of 1H-NMR spectroscopy and multivariate statistical analysis applied for the first time in a series of artisanal and ancestral mezcals from three different regions and produced from the most representative types of agaves in Mexico. In parallel, it is presented with a scoop, the NMR-MSA profiling of a series comprising two Mexican monovarietal wines, from three different regions and different ageing processes with the same NMR acquisition, pre-processing and multivariate statistical analysis methodologies as with mezcals. Taking, as an advantage, the full set of standardization procedures that exist within the local [35] and international [36] oenological industry that can guarantee its quality amongst batches, the present study proposes the application of the same NMR-MSA workflow in both spirits as a qualitative form to obtain Orthogonal Projections to Latent Structures Discriminant Analysis (OPLS-DA) fingerprints related to geographical origins, raw varieties and specific manufacturing processes amongst individual batches. Finally, standardization procedure differences between mezcals and wines are revealed by the analysis of specific 1H NMR-OPLS-DA spectroscopic and statistical features.
2. Materials and Methods
2.1. Mezcals
A set of 60 types of artisanal, ancestral and industrial mezcal samples from three different regions of Mexico (Oaxaca, Puebla and San Luis Potosí) comprising 3 different types of agaves (Agave angustifolia Haw, commonly named as Agave Espadín; Agave potatorum Zacc, locally denominated as Agave Tobalá and Agave salmiana ssp. Crassispina), all from a 2019 harvest, were used for the present study. Two types of blends were used for the analysis: Blend 1 is a mixture of Agave potatorum, Agave angustifolia Haw and Agave cupreata; Blend 2 is a mixture of Agave americana and Agave oaxacensis. Counties per region are labelled as follows: (i) TM: Tlacolula de Matamoros [16°59′10″ N, 96°30′47″ W], (ii) SJT: San Jerónimo Tlacochahuaya [17°00′45″ N, 96°33′08″ W], (iii) TV: Teotitlán del Valle [17°01′13″ N, 96°34′43″ W], (iv) VSV: Villa Sola de Vega [16°29′30″ N, 96°58′34″ W], (v) SFS: San Francisco Sola [16°29′48″ N, 96°57′26″ W], (vi) ZA: Zimatlán de Álvarez [16°52′16″ N, 96°46′42″ W], (vii) SAA: San Agustín Amatengo [16°30′36″ N, 96°47′19″ W], (viii) SBC: San Baltazar Chichicapam [16°45′43″ N, 96°29′23″ W ], (ix) SM: Santiago Matatlán [16°51′60″ N, 96°22′58″ W], (x) CA: Caltepec [18°10′53″ N, 97°28′47″ W], (xi) AT: Atlixco [19°1′25″ N, 98°14′29″ W], (xii) AH: Ahualulco [22°24′1″ N, 101°10′0″ W] and (xiii) MC: Mezquitic de Carmona [22°16′0″ N, 101°6′47″ W]. Full data set comprising processes, regions, counties, and agave species are resumed in Table 1.
Table 1.
Set of mezcals’ sampling used for NMR/MSA profiling arranged by agave’s species, counties, regions and manufacturing processes.
| Mezcal Sampling | Agave Species | County | Region | Process |
|---|---|---|---|---|
| 1 | Agave potatorum | TM | Oaxaca | Artisanal |
| 2 | Agave angustifolia Haw | TM | Oaxaca | Artisanal |
| 3 | Agave angustifolia Haw | SJT | Oaxaca | Artisanal |
| 4 | Agave angustifolia Haw | TV | Oaxaca | Artisanal |
| 5 | Agave potatorum | TV | Oaxaca | Artisanal |
| 6 | Agave angustifolia Haw | VSV | Oaxaca | Ancestral |
| 7 | Agave potatorum | VSV | Oaxaca | Ancestral |
| 8 | Agave angustifolia Haw | VSV | Oaxaca | Ancestral |
| 9 | Agave potatorum | VSV | Oaxaca | Ancestral |
| 10 | Agave potatorum | VSV | Oaxaca | Ancestral |
| 11 | Agave angustifolia Haw | VSV | Oaxaca | Ancestral |
| 12 | Agave angustifolia Haw | VSV | Oaxaca | Ancestral |
| 13 | Agave cupreata | SFS | Oaxaca | Ancestral |
| 14 | Blend No. 1 | SFS | Oaxaca | Ancestral |
| 15 | Agave angustifolia Haw | VSV | Oaxaca | Ancestral |
| 16 | Agave potatorum | VSV | Oaxaca | Ancestral |
| 17 | Blend No. 2 | VSV | Oaxaca | Ancestral |
| 18 | Agave angustifolia Haw | ZA | Oaxaca | Artisanal |
| 19 | Agave angustifolia Haw | ZA | Oaxaca | Artisanal |
| 20 | Agave potatorum | SAA | Oaxaca | Artisanal |
| 21 | Agave potatorum | SBC | Oaxaca | Artisanal |
| 22 | Agave angustifolia Haw | SM | Oaxaca | Artisanal |
| 23 | Agave potatorum | CA | Puebla | Artisanal |
| 24 | Agave angustifolia Haw | AT | Puebla | Artisanal |
| 25 | Agave salmiana ssp. crassispina | AH | San Luis Potosí | Artisanal |
| 26 | Agave salmiana ssp. crassispina | MC | San Luis Potosí | Artisanal |
2.2. Wines
A set of 31 types of Mexican monovarietal wines (Merlot and Cabernet Sauvignon) from 3 different regions (Baja California [32°17′34″ N, 115°5′28″ W], Coahuila [25°27′2″ N, 102°10′37″ W], and Querétaro [20°39′55″ N, 99°53′54″ W]), and different years of vintage (2018 for all Cabernet Sauvignons and both 2017 and 2018 years of vintage for Merlot samples) were used for the present study. Counties per region are labelled as follows: (i) VG: Valle de Guadalupe, (ii) P: Parras and (iii) EM: Ezequiel Montes. Different ageing strategies were used for Merlot and Cabernet Sauvignon samples and coded as [37]: (i) Merlot 2017 aged within a 2017- Tonnellerie d’Aquitaine French barrel, (ii): Merlot 2017 Gran Reserva taken from a 24-months bottled aging, (iii): Merlot 2018 aged within a 2018-Tonnellerie d’Aquitaine French barrel, (iv): Merlot 2018 aged within a 2016-Tonnellerie d’Aquitaine French barrel, (v): Merlot 2018 directly taken from the fermentation tank, (vi): Merlot 2018 aged within a 2016-Boutes French barrel, and (vii): Merlot 2018 aged within a 2018-Demptos American barrel. Full data set comprising type of ageing, regions, counties, and varieties are resumed in Table 2.
Table 2.
Full set of 31 Mexican monovarietal wines’ sampling used for NMR/MSA profiling, arranged by varieties, counties, regions and ageing processes with the year of vintage.
| Wine Sampling | Variety | County | Region | Ageing Process (Year of Vintage) |
|---|---|---|---|---|
| 1 | Cabernet Sauvignon | P | Coahuila | Demptos American barrel (2018) |
| 2 | Cabernet Sauvignon | VG | Baja California | Boutes French barrel (2018) |
| 3 | Merlot | EM | Querétaro | T. d’Aquitaine French barrel (2017) |
| 4 | Merlot | EM | Querétaro | Demptos American barrel (2018) |
| 5 | Merlot | EM | Querétaro | Boutes French barrel (2018) |
| 6 | Merlot | EM | Querétaro | T. d’Aquitaine French barrel (2018) |
| 7 | Merlot | EM | Querétaro | Fermentation tank (2018) |
2.3. 1H-NMR Acquisition
Solution-state NMR spectroscopy was carried with a Bruker Avance-III HD spectrometer (Bruker Biospin, Rheinstetten, Germany), operating at 14.1 T of the magnetic field (equivalent to 600 MHz of proton frequency) with a 1H/D BBO probehead and a z-gradient. Both mezcal and wine samples were prepared at equivalent conditions for NMR spectroscopy as follows: each mixture containing 540 µL of spirit and 60 µL of deuterium oxide solution 99.9 atom % D that, in turn, contains 0.05 wt% of 3-(trimethylsilyl) propionic-2,2,3,3-d4 acid, sodium salt as an internal reference (CAS No. 7789-20-0) and 0.1% of phosphonate KH2PO4 (CAS No. 7778-70-0) buffer were prepared and pH adjusted to a value of 3.1 [1,37]. The following NMR schemes were acquired for the full set of wine and mezcal samplings, which, respectively, comprise 31 and 60 samples:
-
(a)
Standard direct-excitation one-dimensional proton nuclear magnetic resonance spectra needed to prepare water-to-ethanol off-resonance multipresaturations [37,38,39] were carried out by recording a total of 64 transients, which were collected in 28,844 complex data, with a spectral width of 20 ppm (12,019 Hz), an optimized recovery delay of 6 s and acquisition times of 1.2 s, produced experimental times of 6 min per spectrum. No apodization function was applied during the Fourier Transform.
-
(b)
1Hwater_presat NMR: 1D single pulse NOESY experiments with an off-resonance shaped-pulse water presaturation during both relaxation delay (10 s) and mixing times (100 milliseconds) and 8.19 × 10⁻⁴ W (vide infra) and 1.18 × 10⁻³ W power level irradiations, respectively, for wine and mezcal samples, were acquired for all samples at the following conditions: a total of 128 transients were collected within 28K complex data points, with a spectral width of 12,019 Hz and acquisition times of 1.2 s, producing experimental times of 16 min.
2.4. 1H-NMR Post-Processing and Multivariate Statistical Analysis (MSA)
NMR post-processing for producing the MSA input variables was carried out as follows: ppm calibration and manual phase corrections were conducted with the use of Bruker TopSpin 4.0.8 software. Global and intermediate baseline corrections, least-squares or parametric time warping NMR alignments, variable size bucketing for untargeted profiling and data matrix normalization were carried out with NMRProcFlow software [40]. Scaling and statistical analysis workflow for obtaining the Principal Component (PCA) and the Orthogonal Projections to Latent Structures Discriminant Analysis (OPLS-DA), from the constant sum normalized NMR data matrix, were developed with the BioStatFlow 2.9.2 software. In all cases, T2 Hotelling’s regions depicted by ellipses in score plots of each model define a 95% confidence interval [41]. Supervised OPLS-DA was carried out with Monte-Carlo Cross Validations with 10-test partitions per 100 permutations for testing [42]. In all cases, p-values, R2X and Q2 statistical parameters that define the quality of each model are expressed [43].
3. Results and Discussion
A fair comparison between two different spirits, by means of a 1H-NMR/MSA comparable approach, begins with a proper water-to-ethanol multipresaturation proton NMR scheme per case, for obtaining exploitable spectra for multivariate statistical analysis. Figure S1 (Supplementary Material) shows a representative set of two standard direct-excitation one-dimensional proton nuclear magnetic resonance spectra of wine and mezcals. Due to their particular alcohol by volume percentage (%ABV) values, the off resonance multipresaturation pulse must be specific to each spirit and applied in the same way between batches. Power levels of 8.19 × 10⁻⁴ W and 1.18 × 10⁻³ W were found to be optimal respectively for wine and mezcal batches in order to produce 1H-NMR spectra with equivalent signal to noise ratios. It is important to highlight that the higher power level for the off resonance multipresaturation pulse in mezcals is intrinsically related to their higher %ABV of around 50% with respect the %ABV of selected wines of around 14.5%.
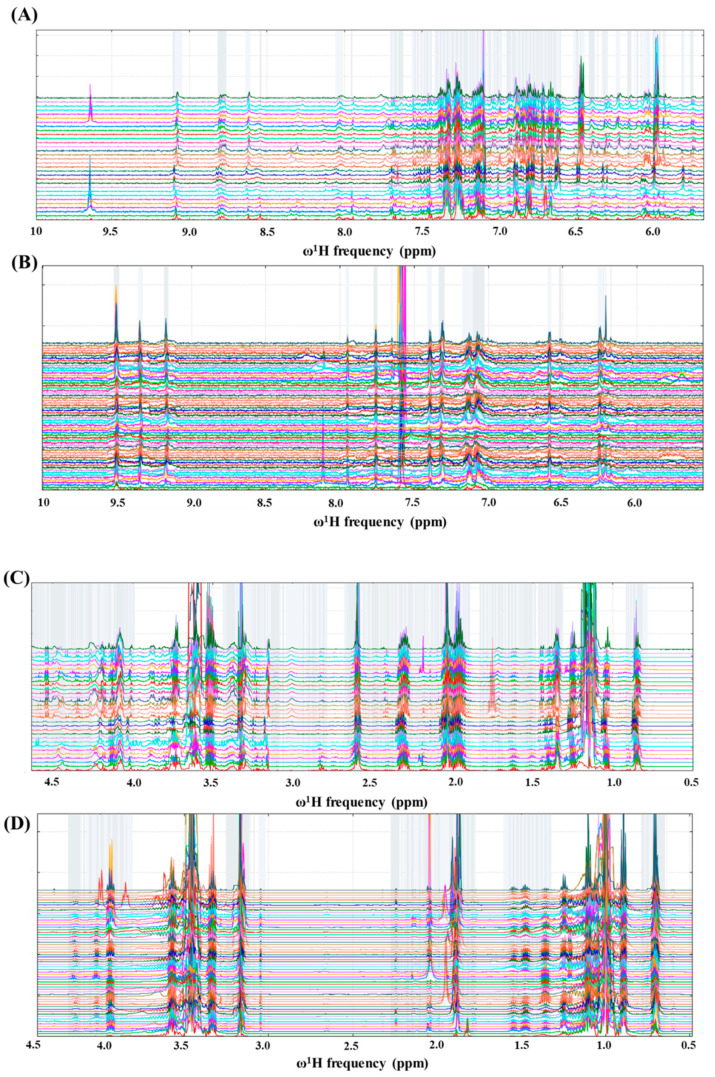
Figure 1 presents selected spectral widths of the stacked one dimensional {1Hwater_presat NMR} spectra of Mexican Cabernet & Merlot wines (A and C, see Table 2) and Agave angustifolia Haw, Agave potatorum Zacc, Agave salmiana ssp. Crassispina, Agave cupreata mezcals, as well as selected blends (B and D, See Table 1), showing, within the figure, gray buckets, the application of an intelligent binning algorithm amongst aromatic (A and B in Figure 1; 10 ppm ≤ ω1H ≤ 5.5 ppm) and aliphatic (C and D in Figure 1; 4.5 ppm ≤ ω1H ≤ 0.5 ppm) frequency regions, for the NMR bucketing strategy to produce the reduced data matrices. As observed in Figure 1, all resonances in proximity with to CH3 (1.14 ppm) and CH2 (3.51 ppm) ethanol signal residuals and to their corresponding 13C satellites (±0.1 ppm/±60 Hz at 14.1 Tesla) were not considered for the NMR bucketing strategy. Despite the use of frequency alignment algorithms in both NMR data matrices, such as parametric time warping [44], it can be observed in Figure 1 that some misalignments coexist, mostly in mezcal samples, like the typical acetate singlet at around 2.0 ppm, which could possibly be due to several physicochemical interactions related to the lack of quality controls, particularly during non-standardized ancestral or artisanal agaves’ thermal hydrolysis: the cooking process for liberating fermentable sugars, wherein the final distilled mezcals contain a series of alcohols, aldehydes and organic acids (vide infra) that would challenge the standardization of pH buffering [28]. These imperfections will be reflected in the quality of the produced NMR data matrix submitted to multivariate statistical analysis.
Figure 1.
Stacked one dimensional 1Hwater_presat NMR spectra of Mexican Cabernet and Merlot wines (A,C) and Agave angustifolia Haw, Agave potatorum Zacc, Agave salmiana ssp. Crassispina, Agave cupreata and selected blends (see Table 1) from Mexican mezcal samples (B,D). Regions A and B comprise the 1H frequency range between 10 and 5.5 ppm, whilst 1H NMR expansions in C and D run from 4.5 to 0.5 ppm. Binning strategies for both systems to obtain data dimensionality are highlighted with gray boxes.
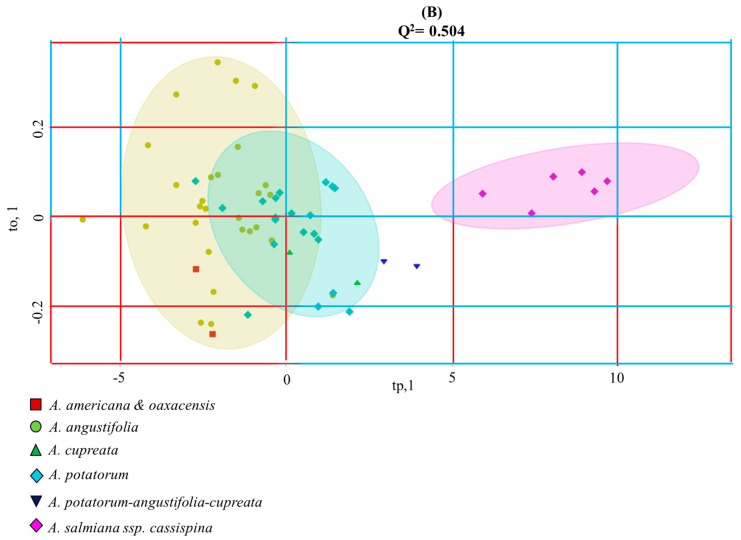
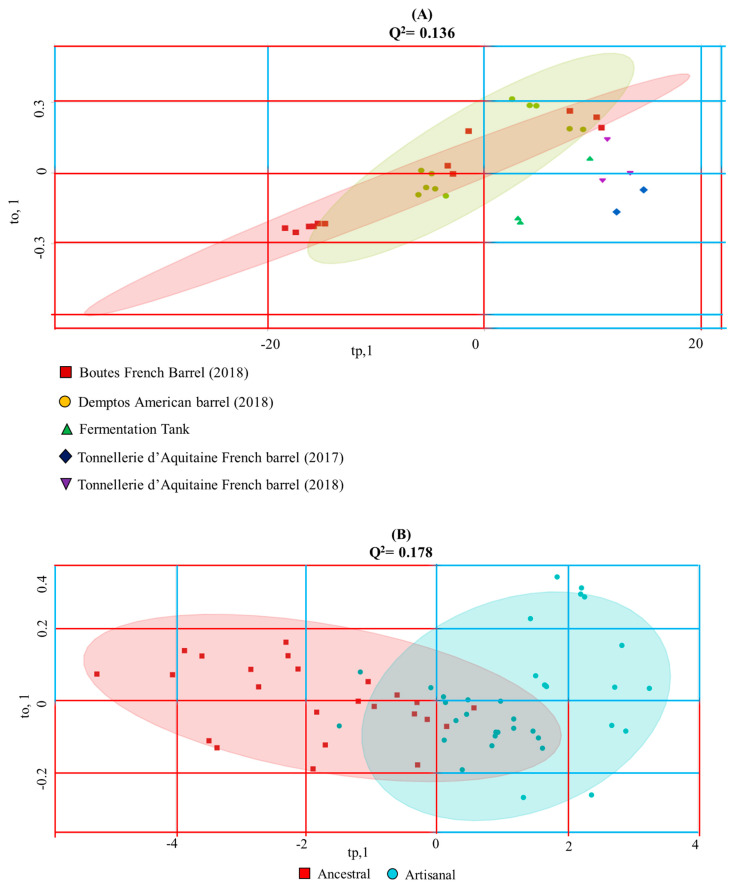
Figure 2, Figure 3 and Figure 4 and Figures S2 to S7 (Supplementary Materials) present the full set of multivariate statistical analyses comprising the Orthogonal Projections to Latent Structures Discriminant Analysis (OPLS-DA) from the constant sum of the normalized NMR data matrix (main text) as well as the prediction accuracy curves as a function of PLS components, permutation tests, Principal Component Analysis (PCA) obtained from the same NMR data matrix and OPLS-DA loading plots of wines’ and mezcal’ data matrices (supporting information material). Unsupervised principal component analysis is generally used for organizing the NMR data matrix and for determining correlations between selected factors (geographical regions, wine’s varieties or agaves’ species and specific ageing or manufacturing process) and outliers (discriminant NMR resonances). In order to maximize separations amongst samples, supervised OPLS-DA was applied to each NMR data matrix. OPLS-DA permits us to obtain optimal information from the dataset by the identification of a more refined multivariate subspace for the maximum group separations by applying Monte-Carlo Cross Validations with a set of partitions per number of permutations (see Section 2.4). At first glance, PCA was applied on both wine and mezcal NMR data matrices, producing plots with equivalent and poor separations between groups described within two-dimensional projections (PC1 = 29%, PC2 around 15 and 17%, Figures S2 to S7). For that, OPLS-DA modeling was applied over the full set of wines’ and mezcals’ data matrices for obtaining improved separations amongst factors that allowed pairwise comparisons of discriminative features between wine and mezcals regions, varieties and species and ageing and manufacturing processes.
Figure 2.
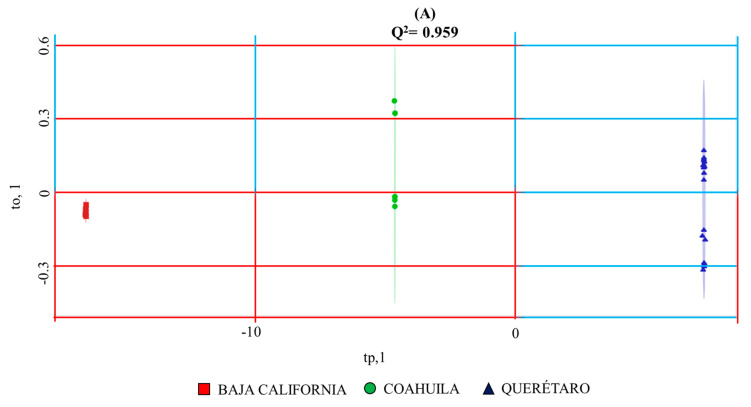
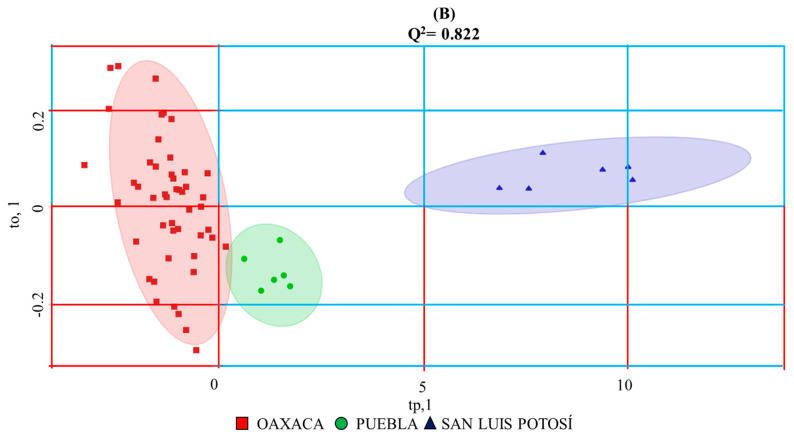
OPLS-DA multivariate statistical analysis score plots generated from 1Hwater_presat NMR data matrix (Figure 1) considering the regional factor of wines (A) and mezcals (B) described in Table 1 and Table 2. T2 Hotelling’s ellipses have a 95% confidence level. Prediction accuracy curves as a function of PLS components, permutation tests, PCA analysis obtained from the same NMR data matrix and OPLS-DA loading plots of wines’ and mezcal’ analysis can be consulted, respectively, in Figures S2 and S3.
Figure 3.
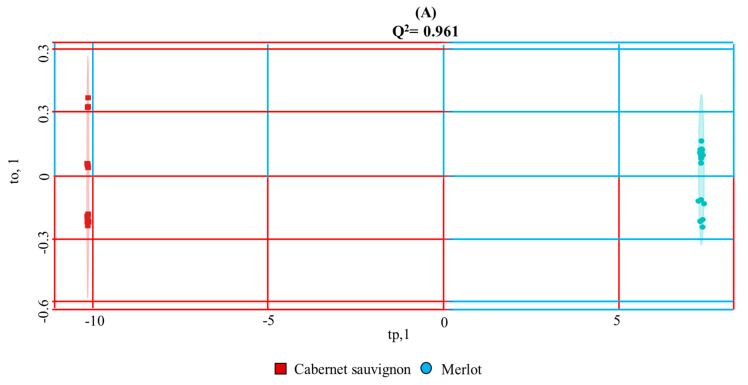
OPLS-DA multivariate statistical analysis score plots generated from 1Hwater_presat NMR data matrix (Figure 1) considering wines’ variety (A) and agaves’ species (B) described in Table 1 and Table 2. T2 Hotelling’s ellipses have a 95% confidence level. Prediction accuracy curves as a function of PLS components, permutation tests, PCA analysis obtained from the same NMR data matrix and OPLS-DA loading plots of wines’ and mezcal’ analysis can be consulted, respectively, in Figures S4 and S5.
Figure 4.
OPLS-DA multivariate statistical analysis score plots generated from 1Hwater_presat NMR data matrix (Figure 1) considering wines’ (A) and mezcals’ (B) ageing and manufacturing processes described in Table 1 and Table 2. T2 Hotelling’s ellipses have a 95% confidence level. Prediction accuracy curves as a function of PLS components, permutation tests, PCA analysis obtained from the same NMR data matrix and OPLS-DA loading plots of wines’ and mezcal’ analysis can be consulted respectively in Figures S6 and S7.
Discriminations between wines from Baja California, Coahuila and Querétaro and mezcals from Oaxaca, Puebla and San Luis Potosí by supervised OPLS-DA discriminative analysis are highlighted in Figure 2. Selected oenological regions can be unambiguously discriminated with the use of the selected NMR outlier (R2X= 0.999996; Q2 = 0.959; p-value < 0.004). With less discriminative responses, but still with accurate agreements, agave spirits from Oaxaca, Puebla and San Luis Potosí can be differentiated with the equivalent mezcals’ NMR outlier (R2X = 0.8756; Q2 = 0.822; p-value < 8.48 × 10⁻⁵). In both cases, the use of 3 PLS components are sufficient to represent observed discriminations of, respectively, 96% and 82%. The higher the amount of discrimination between wines from Baja California, Coahuila and Querétaro relies, not only due to the important set of discriminant loadings obtained from wines’ NMR data matrix, but also from the physical geographical distances between selected regions located, respectively, at the following coordinates: [32°17′34″ N, 115°5′28″ W], [25°27′2″ N, 102°10′37″ W] and [20°39′55″ N, 99°53′54″ W]). In contrast, geographical proximity, mostly between mezcals from Oaxaca (around 16–17° N, 96°22−58′ W) and Puebla (around 18−19° N, 97°–98° W), considerably limits regional discriminations, when compared to wines. Despite the said proximity even with the farthest San Luis Potosí region (around 22°16–24′ N, 101° 6–10′ W), statistically acceptable discriminations are observed with the use of the mezcals’ NMR data matrix.
Discriminations between wines from Merlot and Cabernet Sauvignon wine varieties and mezcals from monovarietal Agave angustifolia Haw; Agave potatorum Zacc; Agave salmiana ssp. Crassispina magueys and selected blends (Agave potatorum, Agave angustifolia Haw and Agave cupreata); (Agave americana with Agave oaxacensis) by supervised OPLS-DA discriminative analysis are described in Figure 3. Wine varieties can be unambiguously discriminated with the use of the selected NMR outlier (R2X = 0.99998; Q2 = 0.961; p-value < 0.00089). Again, with less discriminative responses, but still with accurate agreements, different agave species can be differentiated with the equivalent mezcals’ NMR outlier (R2X = 0.7049; Q2 = 0.503; p-value < 7.6 × 10⁻⁴). For wine varieties, the use of 3 PLS components are sufficient to represent observed discriminations above 90%. In contrast, the observed maximum 50% of discrimination between mezcal species is obtained with 2 PLS components, in turn decaying its prediction accuracy when increasing the number of PLS components (Figure S5A).
The OPLS-DA supervised model can easily discriminate the San Luis Potosí Agave salmiana ssp. Crassispina mezcals from the rest of the species (magenta diamonds in Figure 3). The discriminative analysis also defines two T2 Hotelling’s regions with a 95% confidence interval that slightly delimits Agave angustifolia (yellow circles in Figure 3) and Agave potatorum (green diamonds Figure 3) species. Furthermore, samples from Agave potatorum, Agave angustifolia Haw and Agave cupreata mezcal blend rely closely on the Agave potatorum (tp, to) subspace, strongly suggesting the contribution of A. potatorum to the blend. However, it is not possible to define a subspace of both Agave americana and Agave oaxacensis blend and Agave cupreata monovarietal samples and to distinguish them from Agave angustifolia and Agave potatorum by diverse possible reasons: (i) the limited loadings that mezcals’ NMR data matrix produces; (ii) the uncertainty that even the mezcal masters claim concerning the authenticity of their magueys due to the lack of an accessible and routine 13C-isotopic fractionation analytical method for crassulacean acid metabolism (CAM) plants such as agaves [45,46] throughout the country; (iii) the lack of control comprising the exchange of native agave plants performed by inhabitants of a particular region, mostly from vicinal states such as in Oaxaca and Puebla [47], amongst other reasons.
Discriminations between ageing strategies in wines and the artisanal and ancestral processes in mezcals with supervised OPLS-DA discriminative analysis are presented in Figure 4. Wine NMR outliers that effectively discriminate both oenological regions and varieties produce null discriminations when the OPLS-DA factor relates samples aged in different barrels with respect to samples directly taken from the fermentation tank (R2X = 0.409704; Q2 = 0.136; p-value < 0.177). Interestingly, ancestral and artisanal mezcals can be slightly discriminated (R2X = 0.6012; Q2 = 0.178; p-value < 6.38 × 10⁻³) by means of two 95% confidence T2 Hotelling’s ellipses, wherein ancestral mezcals scores have a range of tp,1 < 0, whilst their artisanal counterparts rely within the tp,1 > 0 range. The use of 3 PLS components are sufficient to represent the observed 18% discriminations.
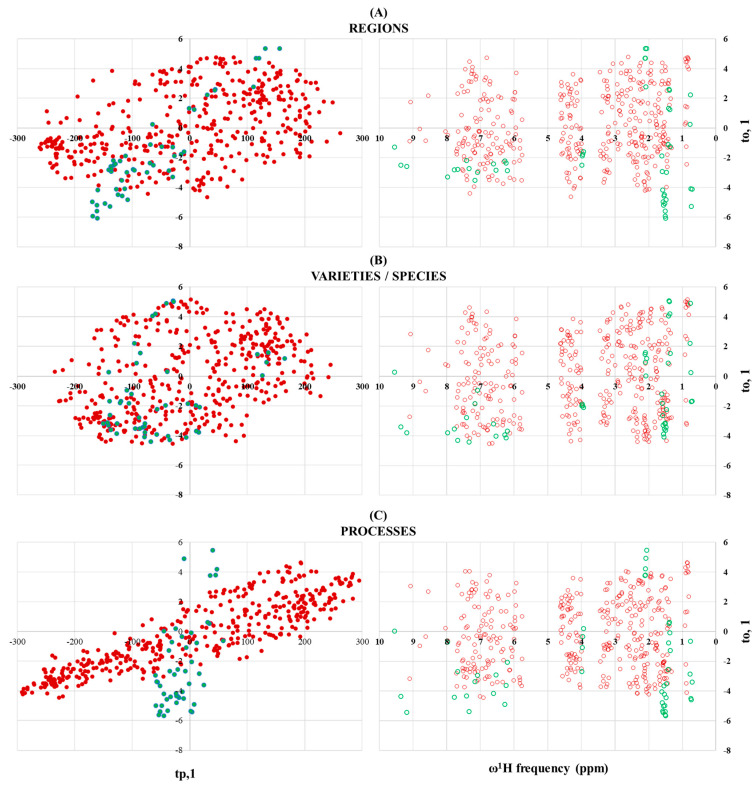
Finally, OPLS-DA loading plots in Figure 5 resume some key points of the present comparative study as follows: (i) rigorous quality controls applied to Mexican wine samples are responsible of the high 1H-NMR spectral reproducibility that in turn allow to the MSA routine, the identification of spectroscopical regions responsible for discriminations; (ii) consequently, an important amount of loadings around the four (to,1/tp,1) quadrants are obtained for wine analysis that allow unequivocal discrimination between selected regions (top left, Figure 5) and varieties (middle left, Figure 5); and (iii) null discriminations amongst different ageing processes in wines is related to a reduced amount of loadings, particularly concentrated in the [-,-] and [+,+] (to,1/tp,1) subspace; iv) to,1 = f(ω1H frequency) plots (right, Figure 5) show that discriminant 1H-NMR resonances are found all along the wines’ spectral frequency range (red dots).
Figure 5.
OPLS-DA loading plots of wine (red dots) and mezcal (green dots) regional (A), varieties/species (B) and processes (C) discriminant factors. Orthogonal components (to,1) are expressed as a function of predictive components (tp,1, left plots) and proton chemical shifts (ω1H frequency, left plots) from wines’ and mezcals’ NMR data matrices.
Overlay between wine (red dots, Figure 5) and mezcal (green dots, Figure 5) loadings at equivalent (to,1/tp,1/ω1H frequency) ranges confirms the validity of comparing mezcals’ regional, species and processes discriminant efficiency as with their wines’ counterparts in the following way: (i) the lack of rigorous quality controls in artisanal and ancestral mezcals is reflected in the 1H-NMR data matrix, which in turn produces much less loadings that directly affect the above-mentioned discriminations; (ii) despite said limitations, it is possible to propose regional discriminations regardless their geographical proximity; (iii) difficulty in proposing a species’ of robust discriminant holistic fingerprint relies on the lack of good practices discussed above. Last limitation is expressed within the (to,1/tp,1) subspace, stressed as loadings majorly charged in the tp,1 < 0 quadrants (left middle, Figure 5): (iv) slight discriminations between artisanal and ancestral mezcals are produced due to an important concentration of loadings within the negative (to,1/tp,1) quadrant and v) most of the aliphatic and aromatic/aldehydic 1H-NMR discriminant shifts in mezcals correlate with loadings defined at the negative (to,1) quadrants.
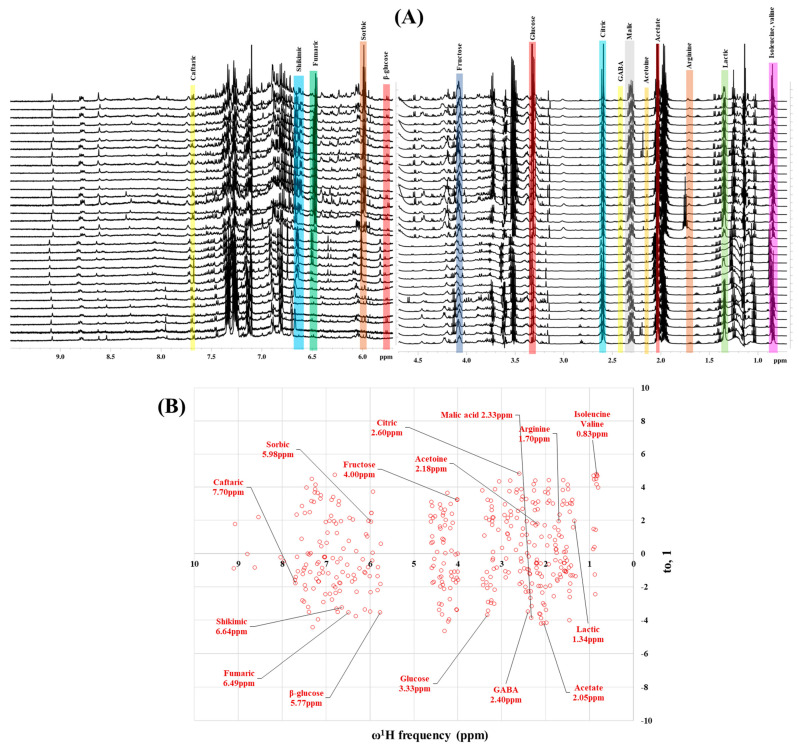
Preliminary partial 1H NMR assignments for chemical identification of discriminant metabolites in both wine and mezcal spirits presented in Figure 6 and Figure 7 were achieved by comparison to previous reports [1,15,18,28,48] and databases [49]. For both cases, identified discriminant metabolites are shown in independent [1] loading plots as a function of proton chemical shifts. 1H NMR allowed the identification of 16 discriminant metabolites in wines (caftaric acid, shikimic acid, fumaric acid, sorbic acid, (β)-glucose, fructose, citric acid, acetoine, malic acid, γ-amino butyric acid (GABA), lactic acid, acetate and some free amino acids such as arginine, isoleucine and valine, see also Table 3) and 11 discriminant metabolites in mezcals (acetaldehyde, 5-substituted furanaldehyde, possibly 5-hydroxymethyl furfural, unsubstituted furfural, 2-furoic acid, (furan-2-yl)-methanol, phenethyl alcohol, phenethyl acetate, ethyl acetate, 1-butanol, 2-butanol and 2-methylpropan-1-ol, see also Table 4).
Figure 6.
1H NMR stacked plot spectra of Mexican Cabernet & Merlot wines (as in Figure 1) with preliminary signal assignments based on literature (A) and OPLS-DA [to,1] loading plots as a function of proton chemical shifts with identified metabolites and their assigned chemical shifts (B).
Figure 7.
1H NMR stacked plot spectra of Mexican mezcals (as in Figure 1) with preliminary signal assignments based on literature (A) and OPLS-DA [to,1] loading plots as a function of proton chemical shifts with identified metabolites and their assigned chemical shifts (B).
Table 3.
Assigned 1H NMR resonances with chemical shifts (δ, ppm), proton homonuclear scalar couplings (J, Hz) and signal multiplicity of identified metabolites in Mexican wines, showing in each case the assigned shifts within the molecular reduced formula.
| Molecular Reduced Formula (Assigned 1H in Red) | (δ, ppm), J (Hz), Multiplicity |
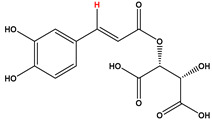 Caftaric acid |
δ = 7.70 ppm, J = 15.02 Hz, doublet |
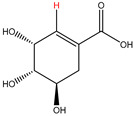 Shikimic acid |
δ = 6.64 ppm, J = 8.1 Hz, doublet |
 Fumaric acid |
δ = 6.49 ppm, J = 15.1 Hz, doublet |
 Sorbic acid |
δ = 5.98 ppm, multiplet |
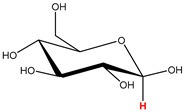 β-glucose |
δ = 5.77 ppm, J = 7.55 Hz, doublet |
 Fructose |
δ = 4.00 ppm, multiplet |
 Citric acid |
δ = 2.60 ppm, singlet |
| Molecular Reduced Formula (Assigned 1H in Red) | (δ, ppm), J (Hz), Multiplicity |
 Acetoine |
δ = 2.18 ppm, singlet |
 γ-amino butyric acid (GABA) |
δ = 2.40 ppm, J= 7.31 Hz, triplet |
 Malic acid (diastereotopic protons) |
δ = 2.33 ppm, J = 8.7 Hz, overlaid triplets |
 Acetate |
δ = 2.05 ppm, singlet |
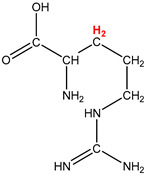 Arginine |
δ = 1.70 ppm, J = 6.7 Hz, multiplet |
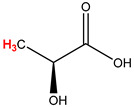 Lactic acid |
δ = 1.34 ppm, J = 6.7 Hz, doublet |
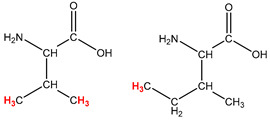 Valine/Isoleucine |
δmax = 0.83 ppm, multiplet |
Table 4.
Assigned 1H NMR resonances with chemical shifts (δ, ppm), proton homonuclear scalar couplings (J, Hz) and signal multiplicity of identified metabolites in Mexican mezcals, showing in each case the assigned shifts within the molecular reduced formula.
| Molecular Reduced Formula (Assigned 1H in Red) | (δ, ppm), J (Hz), Multiplicity |
 Acetaldehyde |
δ = 9.55 ppm, J = 2.82 Hz, quartet |
 5-substituted furanaldehyde and 2-furfural |
δ = 9.37 ppm, singlet δ = 9.19 ppm, singlet |
 2-furfural |
δ = 7.97 ppm, multiplet |
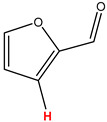 2-furfural |
δ = 7.34 ppm, multiplet |
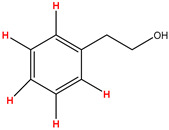 Phenethyl alcohol |
δ = 7.17 ppm, J = 7.47 Hz, multiplet |
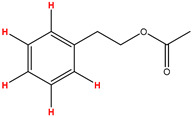 Phenethyl acetate |
δ = 7.09 ppm, J = 7.48 Hz, multiplet |
 2-furoic acid |
δ = 6.54 ppm, J = 3.6 Hz/1.57 Hz, doublet of doublets |
| Molecular Reduced Formula (Assigned 1H in Red) | (δ, ppm), J (Hz), Multiplicity |
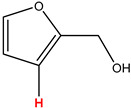 (Furan-2-yl)-methanol |
δ = 6.24 ppm, J = 3.3 Hz, doublet |
 Acetate |
δ = 3.99 ppm, J = 7.2 Hz, quartet |
 1-butanol |
δ = 1.54 ppm, J = 6.67 Hz, multiplet |
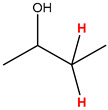 2-butanol |
δ = 1.49 ppm, J = 6.67 Hz, multiplet |
 2-methylpropan-1-ol |
δ = 1.38 ppm, J = 7.1 Hz, heptuplet |
For wines, one-dimensional 1H NMR signal assignment (Table 3) present accurate agreements with respect to previous reports, comprising the typical set of discriminant metabolites such as caftaric acid, sorbic acid, fructose, acetoine, citric acid, malic acid, arginine isoleucine and valine (positive loadings in the present NMR data matrix, see Figure 6), as well as shikimic acid, fumaric acid, glucose, GABA, acetate and lactic acid valine (negative loadings in the present NMR data matrix, see Figure 6). For mezcals, the current report presents the first efforts of a one-dimensional 1H NMR profiling based on the chemical shifts (δ, ppm), proton homonuclear scalar couplings (J, Hz) and signal multiplicity assignments of discriminant metabolites’ NMR resonances (Table 4), in comparison to the few available works reporting the major components in mezcals-produced from different agave species with chromatographic analysis [3,26,47]. All identified furane derivatives (2-furfural, 5-substituted furanaldehyde, 2-furoic acid and (furan-2-yl)-methanol), acetaldehyde, aromatic moieties (phenethyl alcohol and phenethyl acetate), ethyl acetate, and n-butanol species, present negative loadings as the fingerprint responsible for OPLS-DA regional, species, and manufacturing processes’ discriminations. In contrast, only 2-methylpropan-1-ol presented a positive loading (see Figure 7).
4. Conclusions
The use of a 1H-NMR/MSA non-targeted metabolomics workflow is presented for a first-time evaluation of ancestral and artisanal Mexican native mezcals, in order to obtain OPLS-DA regional, species and manufacturing processes holistic fingerprints, wherein their validity and discriminant capacity are supported by Q2, R2X and p-values statistical parameters that define, in turn, the quality of each model. Limitations of the 1H-NMR/MSA mezcals’ discriminant analysis are contrasted with the first-time reported OPLS-DA results obtained for industrialized Mexican wines, whereas the MSA inputs of both systems (NMR acquisition and preprocessing routines) were carefully taken at equivalent conditions. The comparative 1H-NMR/MSA produces for both spirits, limited discriminant unsupervised PCA results and trustworthy regional and grape variety or agave species OPLS-DA non-targeted fingerprints, whereas the reduced discriminant capacity of mezcals’ selected regions and agave species with respect to the excellent agreements obtained for their OPLS-DA wine counterparts are attributed to the quality of mezcals’ NMR data matrix, that in turn reflects the lack of rigorous quality controls in mezcals’ production. However, statistically acceptable OPLS-DA results obtained to discriminate between regions and species in mezcals shall be the starting point to encourage producers and local food agencies to use the presented 1H-NMR/MSA methodology as a starting point of a national mezcal repository that could serve as an instrument for quality controls within the industry, such as oenological data bases have recently contributed to enhance and control wines’ quality attributes. Null discriminant features encountered for different ageing strategies in wines shall be alleviated by means of modifying the NMR outliers, such as the use of refocusing pulses instead of multipresaturation schemes that could selectively excite the aromatic 1H-NMR frequency range for better profiling and targeting the NMR region associated to tannins, differently produced at specific oenological ageing schemes. In the same sense, efforts to retrieve discriminant features for disentangling artisanal from ancestral mezcal production are herein presented, whereas the corresponding OPLS-DA results strongly suggest that by only increasing the dataset will systematically perform the way to distinguish amongst said processes in order to use the proposed 1H-NMR/MSA model for quality controls. Once again, the gained knowledge in wine NMR non-targeted metabolomics of the last decade has been applied in one hand to confirm the discriminant metabolites in Mexican wines implied in the OPLS-DA fingerprints related to geographical origins and grape varieties, and on the other hand to apply it in the novel mezcals’ foodomics approach, herein reported. However, further NMR multidimensional methodologies shall be applied in order to confirm the present preliminary 1H NMR assignment.
Acknowledgments
All authors gratefully acknowledge the following persons and institutions that have provided all wine samples for research purposes, whereas the acronyms in parenthesis are in agreement with those presented in Table 2: Francisco Rodríguez from Casa Madero (P), Cristina Pino-Villar from Santo Tomás (VG) and Lluis Raventós-Llopart from Sala Vivé Freixenet (EM), as well as Paz Austin Quiñones, Hans Backoff, Jimena Cuevas and Aarón Robles Bernal from Consejo Mexicano Vitivinícola as the contacts between academy and oenological industry in Mexico. For mezcals, all samples and travel expenses were possible thanks to the 20009-DTT-62 grant (Universidad Autónoma Chapingo).
Supplementary Materials
The following are available online at https://www.mdpi.com/2304-8158/10/1/157/s1, Figure S1: Standard direct-excitation one-dimensional proton nuclear magnetic resonance spectra of a wine (red) and mezcal (green) representative sample. Signal integration of intense water (4.83 ppm) and ethanol CH2 (3.51 ppm)—CH3 (1.14) spin systems is the starting point to predict effective power level of suppression off-resonance shaped pulses, applied in the {1Hwater_presat NMR}: 1D single pulse NOESY experiments, needed to produce NMR outliers (Figure 1, Main text) used in MSA. Relative ethanol signal integration with respect water resonances reflect the different %ABV content in both spirits, that in turn defines the off-resonance shaped pulses amplitude differences in each case: 8.19 × 10⁻⁴ W (for wine samples) and 1.18 × 10⁻³ W (for mezcal samples), Figure S2: Prediction accuracy curves as a function of PLS components, permutation tests, Principal Component Analysis (PCA) obtained from the same NMR data matrix and OPLS-DA loading plots of wines’ regional supervised discriminative analysis presented in Figure 2 top, main text, Figure S3: Prediction accuracy curves as a function of PLS components, permutation tests, Principal Component Analysis (PCA) obtained from the same NMR data matrix and OPLS-DA loading plots of mezcals’ regional supervised discriminative analysis presented in Figure 2 bottom, main text, Figure S4: Prediction accuracy curves as a function of PLS components, permutation tests, Principal Component Analysis (PCA) obtained from the same NMR data matrix and OPLS-DA loading plots of wines’ varieties supervised discriminative analysis presented in Figure 3 top, main text, Figure S5: Prediction accuracy curves as a function of PLS components, permutation tests, Principal Component Analysis (PCA) obtained from the same NMR data matrix and OPLS-DA loading plots of mezcals’ species supervised discriminative analysis presented in Figure 3 bottom, main text, Figure S6: Prediction accuracy curves as a function of PLS components, permutation tests, Principal Component Analysis (PCA) obtained from the same NMR data matrix and OPLS-DA loading plots of wines’ ageing processes supervised discriminative analysis presented in Figure 4 top, main text, Figure S7: Prediction accuracy curves as a function of PLS components, permutation tests, Principal Component Analysis (PCA) obtained from the same NMR data matrix and OPLS-DA loading plots of mezcals’ manufacturing processes supervised discriminative analysis presented in Figure 4 bottom, main text.
Author Contributions
R.L.-A.: Investigation, field work for obtaining mezcal samples, validation and writing original draft, H.Z.-P.: Supervision. A.H.-M.: Resources, supervision, funding acquisition. J.E.H.-P.: Conceptualization, NMR resources, methodology, investigation, formal analysis, writing-review and editing. All authors have read and agreed to the published version of the manuscript.
Funding
Different funding sources from the Mexican Ministry of Science and Technology (CONACyT) are acknowledged: R.L.-A. for a CONACyT graduate scholarship No. 733574, J.E.H.-P. for the CONACyT program No. 682 “Catedras CONACyT” (Junior Research Faculty). All authors acknowledge CONACyT program No. LN295321 “Laboratorios Nacionales” and CONACyT-INFRA 269012 (NMR instrumentation) for the acquisition and maintenance of the 600 MHz NMR instrument. All authors gratefully acknowledge Universidad Autónoma Chapingo for all financial support through the 20009-DTT-62 grant used to obtain the full set of mezcal samples from Oaxaca, Puebla and San Luis Potosí.
Data Availability Statement
The data presented in this study are available on request from the corresponding author. The data will be publicly available in national NMR national repositories, currently under progress.
Conflicts of Interest
All authors declare no conflict of interest.
Footnotes
Publisher’s Note: MDPI stays neutral with regard to jurisdictional claims in published maps and institutional affiliations.
References
- 1.Godelmann R., Fang F., Humpfer E., Schütz B., Bansbach M., Schäfer H., Spraul M. Targeted and Nontargeted Wine Analysis by 1H NMR Spectroscopy Combined with Multivariate Statistical Analysis. Differentiation of Important Parameters: Grape Variety, Geographical Origin, Year of Vintage. J. Agric. Food Chem. 2013;61:5610–5619. doi: 10.1021/jf400800d. [DOI] [PubMed] [Google Scholar]
- 2.Sárvári I., Franzén C., Taherzadeh M., Niklasson C., Lidén G. Effects of Furfural on the Respiratory Metabolism of Saccharomyces cerevisiae in Glucose-Limited Chemostats. Appl. Environ. Microbiol. 2003;69:4076–4086. doi: 10.1128/AEM.69.7.4076-4086.2003. [DOI] [PMC free article] [PubMed] [Google Scholar]
- 3.Palmqvist E., Hahn-Hägerdal B. Fermentation of lignocellulosic hydrolysates. II: Inhibitors and mechanisms of inhibition. Bioresour. Technol. 2000;74:25–33. doi: 10.1016/S0960-8524(99)00161-3. [DOI] [Google Scholar]
- 4.Deborde C., Moing A., Roch L., Jacob D., Rolin D., Giraudeau P. Plant metabolism as studied by NMR spectroscopy. Prog. Nucl. Magn. Reson. Spectrosc. 2017;102–103:61–97. doi: 10.1016/j.pnmrs.2017.05.001. [DOI] [PubMed] [Google Scholar]
- 5.Esslinger S., Riedl J., Fauhl-Hassek C. Potential and limitations of non-targeted fingerprinting for authentication of food in official control. Food Res. Int. 2014;60:189–204. doi: 10.1016/j.foodres.2013.10.015. [DOI] [Google Scholar]
- 6.Hatzakis E. Nuclear magnetic resonance (NMR) spectroscopy in food science: A comprehensive review. Compr. Rev. Food Sci. Food Saf. 2019;18:189–220. doi: 10.1111/1541-4337.12408. [DOI] [PubMed] [Google Scholar]
- 7.Schievano E., Sbrizza M., Zuccato V., Piana L., Tessari M. NMR carbohydrate profile in tracing acacia honey authenticity. Food Chem. 2020;309:125788. doi: 10.1016/j.foodchem.2019.125788. [DOI] [PubMed] [Google Scholar]
- 8.Le Gall G., Puaud M., Colquhoun I.J. Discrimination between orange juice and pulp wash by 1H nuclear magnetic resonance spectroscopy: Identification of marker compounds. J. Agric. Food Chem. 2001;49:580–588. doi: 10.1021/jf001046e. [DOI] [PubMed] [Google Scholar]
- 9.Gil A.M., Duarte I.F., Delgadillo I., Colquhoun I.J., Casuscelli F., Humpfer E., Spraul M. Study of the Compositional Changes of Mango during Ripening by Use of Nuclear Magnetic Resonance Spectroscopy. J. Agric. Food Chem. 2000;48:1524–1536. doi: 10.1021/jf9911287. [DOI] [PubMed] [Google Scholar]
- 10.Papotti G., Bertelli D., Graziosi R., Maietti A., Tedeschi P., Marchetti A., Plessi M. Traditional balsamic vinegar and balsamic vinegar of Modena analyzed by nuclear magnetic resonance spectroscopy coupled with multivariate data analysis. LWT Food Sci. Technol. 2015;60:1017–1024. doi: 10.1016/j.lwt.2014.10.042. [DOI] [Google Scholar]
- 11.Shintu L., Caldarelli S. Toward the Determination of the Geographical Origin of Emmental(er) Cheese via High Resolution MAS NMR: A Preliminary Investigation. J. Agric. Food Chem. 2006;54:4148–4154. doi: 10.1021/jf060532k. [DOI] [PubMed] [Google Scholar]
- 12.Corsaro C., Cicero N., Mallamace D., Vasi S., Naccari C., Salvo A., Giofrè S.V., Dugo G. HR-MAS and NMR towards foodomics. Food Res. Int. 2016;89:1085–1094. doi: 10.1016/j.foodres.2016.09.033. [DOI] [Google Scholar]
- 13.Monakhova Y., Godelmann R., Kuballa T., Mushtakova S., Rutledge D. Independent components analysis to increase efficiency of discriminant analysis methods (FDA and LDA): Application to NMR fingerprinting of wine. Talanta. 2015;141:60–65. doi: 10.1016/j.talanta.2015.03.037. [DOI] [PubMed] [Google Scholar]
- 14.Mazzei P., Spaccini R., Francesca N., Moschetti G., Piccolo A. Metabolomic by 1H NMR spectrosocopy differentiates “Fiano di Avellino” white wines obtained with different yeast strains. J. Agric. Food Chem. 2013;61:10816–10822. doi: 10.1021/jf403567x. [DOI] [PubMed] [Google Scholar]
- 15.Gougeon L., Da Costa G., Le Mao I., Ma W., Teissedre P., Guyon F., Richard T. Wine Analysis and Authenticity Using 1H-NMR Metabolomics Data: Application to Chinese Wines. Food Anal. Methods. 2018;11:3425–3434. doi: 10.1007/s12161-018-1310-2. [DOI] [Google Scholar]
- 16.Hu B., Gao J., Xu S., Zhu J., Fan X., Zhou X. Quality evaluation of different varieties of dry red wine based on nuclear magnetic resonance metabolomics. Appl. Biol. Chem. 2020;63:1–8. doi: 10.1186/s13765-020-00509-x. [DOI] [Google Scholar]
- 17.Hu B., Cao Y., Zhu J., Xu W., Wu W. Analysis of metabolites in chardonnay dry white wine with various inactive yeasts by 1 H NMR spectroscopy combined with pattern recognition analysis. AMB Express. 2019;9:140. doi: 10.1186/s13568-019-0861-y. [DOI] [PMC free article] [PubMed] [Google Scholar]
- 18.Del Fresno J.M., Escott C., Loira I., Herbert-Pucheta J.E., Schneider R., Carrau F., Cuerda R., Morata A. Impact of Hanseniaspora Vineae in Alcoholic Fermentation and Ageing on Lees of High-Quality White Wine. Fermentation. 2020;6:66. doi: 10.3390/fermentation6030066. [DOI] [Google Scholar]
- 19.Duarte I., Barros A., Belton P.S., Righelato R., Spraul M., Humpfer E., Gil A.M. High-Resolution Nuclear Magnetic Resonance Spectroscopy and Multivariate Analysis for the Characterization of Beer. J. Agric. Food Chem. 2002;50:2475–2481. doi: 10.1021/jf011345j. [DOI] [PubMed] [Google Scholar]
- 20.Rodrigues J.E., Gil A.M. NMR methods for beer characterization and quality control. Magn. Reson. Chem. 2011;49:S37–45. doi: 10.1002/mrc.2844. [DOI] [PubMed] [Google Scholar]
- 21.Kew W., Goodall I., Uhrín D. Analysis of Scotch Whisky by 1H NMR and chemometrics yields insight into its complex chemistry. Food Chem. 2019;298:125052. doi: 10.1016/j.foodchem.2019.125052. [DOI] [PubMed] [Google Scholar]
- 22.Kew W., Bell N.G.A., Goodall I., Uhrín D. Advanced solvent signal suppression for the acquisition of 1D and 2D NMR spectra of Scotch Whisky. Magn. Reson. Chem. 2017;55:785–796. doi: 10.1002/mrc.4621. [DOI] [PMC free article] [PubMed] [Google Scholar]
- 23.Escalante-Minakata P., Barba de la Rosa A.P., Santos L., De León-Rodríguez A. Aspectos Químicos y moleculares del Proceso de Producción del Mezcal. BioTecnología. 2012;16:57–70. [Google Scholar]
- 24.Kirchmayr M.R., Segura-García L.E., Lappe-Oliveras P., Moreno-Terrazas R., De la Rosa M., Gschaedler-Mathis A. Impact of environmental conditions and process modifications on microbial diversity, fermentation efficiency and chemical profile during the fermentation of mezcal in Oaxaca. LWT Food Sci. Technol. 2017;79:160–169. doi: 10.1016/j.lwt.2016.12.052. [DOI] [Google Scholar]
- 25.Villanueva-Rodriguez S. Tequila and mezcal: Sensory attributes and sensory evaluation. Alcohol. Beverages Sens. Evaluation. Consum. Res. 2012:359–378. doi: 10.1533/9780857095176.3.359. [DOI] [Google Scholar]
- 26.Nolasco-Cancino H., Santiago-Urbina J.A., Wacher C., Ruíz-Terán F. Predominant Yeasts During Artisanal Mezcal Fermentation and Their Capacity to Ferment Maguey Juice. Front. Microbiol. 2018;9 doi: 10.3389/fmicb.2018.02900. [DOI] [PMC free article] [PubMed] [Google Scholar]
- 27.NOM-070-SCFI-2016 Bebidas Alcohólicas-Mezcal-Especificaciones. Norma Oficial Mexicana, Diario Oficial de la Federación. (Mexican Official Norm) [(accessed on 7 December 2020)]; Available online: https://dof.gob.mx/nota_detalle.php?codigo=5472787&fecha=23/02/2017.
- 28.Chavez-Parga M.D.C., Pérez Hernández E., González Hernández J.C. Revisión del agave y el mezcal. Rev. Colomb. Biotecnol. 2016;18:148–164. doi: 10.15446/rev.colomb.biote.v18n1.49552. [DOI] [Google Scholar]
- 29.Agave Landscape and Ancient Industrial Facilities of Tequila. [(accessed on 7 December 2020)]; Available online: https://whc.unesco.org/en/list/1209/
- 30.NMX-V-013-NORMEX-2019 Bebidas Alcohólicas-Determinación del Contenido Alcohólico (Por Ciento de Alcohol en Volumen a 20 °C) (%Alc. Vol.)-Métodos de Ensayo (Prueba). Normas Mexicanas. Dirección General de Normas (Mexican Official Norm) [(accessed on 8 December 2020)]; Available online: https://www.dof.gob.mx/nota_detalle.php?codigo=5594809&fecha=11/06/2020.
- 31.NMX-V-014-1986 Bebidas Alcohólicas Destiladas Determinación de Alcoholes Superiores (aceite de fusel). Normas Mexicanas. Dirección General de Normas. (Mexican Official Norm) [(accessed on 8 December 2020)]; Available online: https://www.colpos.mx/bancodenormas/nmexicanas/NMX-V-014-1986.PDF.
- 32.NMX-V-021-1986 Bebidas Alcohólicas Destiladas. Determinación de Metanol. Normas Mexicanas. Dirección General de Normas. (Mexican Official Norm) [(accessed on 8 December 2020)]; Available online: https://www.colpos.mx/bancodenormas/nmexicanas/NMX-V-021-1986.PDF.
- 33.NMX-V-017-S-2014 Bebidas Alcohólicas. Determinación De Extracto Seco y Cenizas. Normas Mexicanas. Dirección General de Normas. (Mexican Official Norm) [(accessed on 8 December 2020)]; Available online: https://www.dof.gob.mx/nota_detalle.php?codigo=5594808&fecha=11/06/2020.
- 34.NOM-006-SCFI-2012 Norma Oficial Mexicana NOM-006-SCFI-2005, Bebidas alcohólicas-Tequila-Especificaciones Normas Mexicanas. Dirección General de Normas. (Mexican Official Norm) [(accessed on 8 December 2020)]; Available online: http://www.dof.gob.mx/nota_detalle.php?codigo=5282165&fecha=13/12/2012.
- 35.NMX-V-012-NORMEX-2005. NMX-V-012-1986 Bebidas alcohólicas. Vinos. Especificaciones. Alcoholic Beverages. Wines. Specifications. Normas Mexicanas. Dirección General de Normas. (Mexican Official Norm) [(accessed on 8 December 2020)]; Available online: https://www.colpos.mx/bancodenormas/nmexicanas/NMX-V-012-1986.PDF.
- 36.International Oenological CODEX, World Organization of Vine and Wine. [(accessed on 8 December 2020)]; Available online: http://www.oiv.int/public/medias/6550/codex-2019-en.pdf.
- 37.Herbert-Pucheta J.E., Padilla-Maya G., Milmo-Brittingham D., Lojero D., Gilmore A.D., Raventós-Llopart L., Hernández-Pulido K.E., Zepeda-Vallejo L.G. Multivariate spectroscopy for targeting phenolic choreography in wine with A-TEEMTM and NMR crosscheck non-targeted metabolomics. EDP Sci. BIO Web Conf. 2019;15:02006. doi: 10.1051/bioconf/20191502006. [DOI] [Google Scholar]
- 38.Vázquez-Leyva S., Vallejo-Castillo L., López-Morales C.A., Herbert-Pucheta J.E., Zepeda-Vallejo L.G., Velasco-Velázquez M., Pavón L., Pérez-Tapia S.M., Medina-Rivero E. Identity profiling of complex mixtures of peptide products by structural and mass mobility orthogonal analysis. Anal. Chem. 2019;91:14392–14400. doi: 10.1021/acs.analchem.9b02873. [DOI] [PubMed] [Google Scholar]
- 39.López-Morales C.A., Vázquez-Leyva S., Vallejo-Castillo L., Carballo-Uicab G., Muñoz-García L., Herbert-Pucheta J.E., Zepeda-Vallejo L.G., Velasco-Velázquez M., Pavón L., Pérez-Tapia S.M., et al. Determination of Peptide Profile Consistency and Safety of Collagen Hydrolysates as Quality Attributes. J. Food Sci. 2019;84:430–439. doi: 10.1111/1750-3841.14466. [DOI] [PMC free article] [PubMed] [Google Scholar]
- 40.Jacob D., Deborde C., Lefevbre M., Maucourt M., Moing A. NMRProcFlow: A graphical and interactive tool dedicated to 1D spectra processing for NMR-based metabolomics. Metabolomics. 2017;13:36. doi: 10.1007/s11306-017-1178-y. [DOI] [PMC free article] [PubMed] [Google Scholar]
- 41.Holmes E., Loo R.L., Stamler J., Bictash M., Yap I.K.S., Chan Q., Ebbels T., De Iorio M., Brown I.J., Veselkov K.A., et al. Human metabolic phenotype diversity and its association with diet and blood pressure. Nature. 2008;453:396–400. doi: 10.1038/nature06882. [DOI] [PMC free article] [PubMed] [Google Scholar]
- 42.Qing-Song X., Yi-Zeng L. Monte Carlo cross validation. Chemom. Intell. Lab. Syst. 2001;56:1–11. doi: 10.1016/S0169-7439(00)00122-2. [DOI] [Google Scholar]
- 43.De Meyer T., Sinnaeve D., Van Gasse B., Tsiporkova E., Rietzschel E., De Buyzere M., Gillebert T., Bekaert S., Martins J.C., Van Criekinge W. NMR-based characterization of metabolic alterations in hypertension using an adaptive, intelligent binning algorithm. Anal. Chem. 2008;80:3783–3790. doi: 10.1021/ac7025964. [DOI] [PubMed] [Google Scholar]
- 44.Bloemberg T., Gerretzen J., Wouters H., Gloerich J., Dael M.V., Wessels H., Heuvel L., Eilers P., Buydens L., Wehrens R. Improved parametric time warping for proteomics. Chemom. Intell. Lab. Syst. 2010;104:65–74. doi: 10.1016/j.chemolab.2010.04.008. [DOI] [Google Scholar]
- 45.O’Leary M. Carbon isotope fractionation in plants. Phytochemistry. 1981;20:553–567. doi: 10.1016/0031-9422(81)85134-5. [DOI] [Google Scholar]
- 46.Thomas F., Randet C., Gilbert A., Silvestre V., Jamin E., Akoka S., Remaud G., Segebarth N., Guillou C. Improved Characterization of the Botanical Origin of Sugar by Carbon-13 SNIF-NMR Applied to Ethanol. J. Agric. Food Chem. 2010;58:11580–11585. doi: 10.1021/jf102983v. [DOI] [PubMed] [Google Scholar]
- 47.Torres-García I., Rendón-Sandoval F.J., Blancas J., Casas A., Moreno-Calles A.I. The genus Agave in agroforestry systems of Mexico. Bol. Soc. Bot. Mex. 2019;97:263–290. [Google Scholar]
- 48.De los Rios-Deras G.C., Rutiaga-Quiñones O.M., López-Miranda J., Páez-Páez-Lerma J.B., López M., Soto-Cruz N.O. Improving Agave duranguensis must for enhanced fermentation. C/N ratio effects on mezcal composition and sensory properties. Rev. Mex. Ing. Química. 2015;14:363–371. [Google Scholar]
- 49.Plant metabolomics Repository of Bordeaux (MeRy-B) [(accessed on 30 December 2020)]; Available online: https://services.cbib.u-bordeaux.fr/MERYB/query/raw_data_query.php?&taxo_id=29760.
Associated Data
This section collects any data citations, data availability statements, or supplementary materials included in this article.
Supplementary Materials
Data Availability Statement
The data presented in this study are available on request from the corresponding author. The data will be publicly available in national NMR national repositories, currently under progress.


