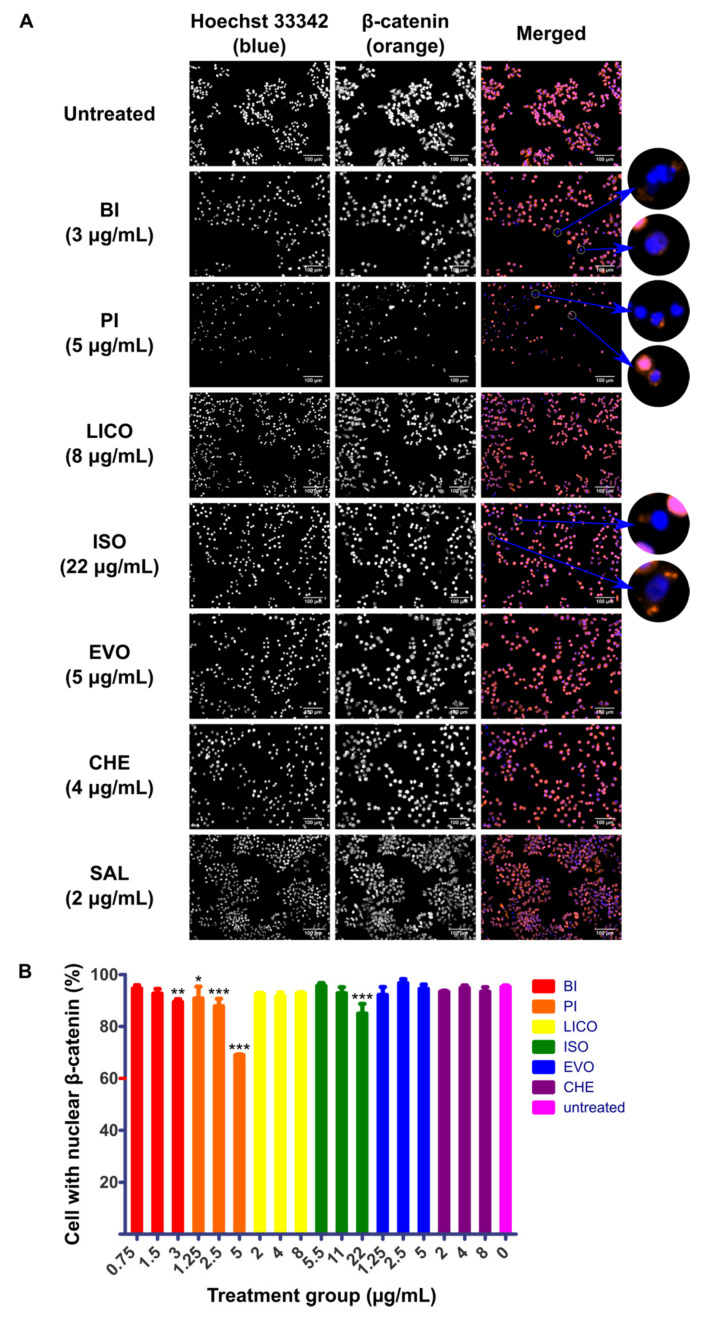
Figure 3.
Immunofluorescence detecting localization behavior of β-catenin in phytochemicals-treated HLCSC. HLCSC was pre-treated with GSK3i at 8 μM for 24 h followed by phytochemicals treatments for 24 h. (A) Representative micrographs depicting immunofluorescence staining of β-catenin (orange) counterstained with Hoechst 33342 (blue) to indicate nuclei in phytochemicals-treated HLCSC. White circles highlight cells with diminished β-catenin localization in nucleus. Scale bars represent 100 μm. (B) Graph representing percentage of HLCSC with nuclear β-catenin calculated in response to treatment at ¼ IC50, ½ IC50 and IC50 concentrations of respective phytochemicals. The quantification data were derived from a representative immunostaining experiment. Error bars are expressed as mean ± SD from triplicate data in an independent experiment. Statistical significance is expressed as *** p < 0.001; ** p < 0.01; * p < 0.05.

