Abstract
The need for healthcare equipment has increased due to the COVID-19 outbreak. Forecasting of these demands allows states to use their resources effectively. Artificial intelligence-based forecasting models play an important role in the forecasting of medical equipment demand during infectious disease periods. In this study, a deep model approach is presented, which is based on a multilayer long short-term memory network for forecasting of medical equipment demand and outbreak spreading, during the coronavirus outbreak (COVID-19). The proposed model consists of stages: normalization, deep LSTM networks and dropout-dense-regression layers, in order of process. Firstly, the daily input data were subjected to a normalization process. Afterward, the multilayer LSTM network model, which was a deep learning approach, was created and then fed into a dropout layer and a fully connected layer. Finally, the weights of the trained model were used to predict medical equipment demand and outbreak spreading in the following days. In experimental studies, 77-day COVID-19 data collected from the statistics data put together in Turkey were used. In order to test the proposed system, the data belonging to last 9 days of this data set were used and the performance of the proposed system was calculated using statistical algorithms, MAPE and R2. As a result of the experiments carried out, it was observed that the proposed model could be used to estimate the number of cases and medical equipment demand in the future in relation to COVID-19 disease.
Keywords: Deep LSTM network, Demand forecasting, COVID-19, Supply chain, Pandemic plan
Introduction
Clusters of pneumonia, for which some local health institutions in China do not have clear information about the cause, have been on the world agenda since December 2019 [1]. After the first findings were obtained, the World Health Organization (WHO) was warned by Chinese officials regarding this pneumonia patient group. At the beginning of the 2020, Chinese officials pointed at a new coronavirus as the cause of pneumonia [2]. When it came to December 2020, it was confirmed that there were 70 million confirmed cases of COVID-19 and 1.6 million deaths worldwide (covid19.who.int). These high numbers put pressure on public policy-makers and health sector managers.
It is now seen that the virus, of which human-to-human transmission is unpreventable, causes various diseases and deaths. Studies on related diseases, public health policies and containment mechanisms continue. Countries endeavor to ensure that hospitals can respond to the demands for healthcare services by preventing the rapid rising of infections through different quarantine practices. In a possible worse scenario, it is anticipated that healthcare institutions may not be able to respond to patients' demands for healthcare services if the number of COVID-19 patients increases. When the infection rates, too, are taken into consideration, it is important that the health capacities of the countries are used effectively and the need for the equipment required for the medical infrastructure is predictable. It is suggested that public health strategies be developed in this regard [3].
Recent experiences in Italy have also revealed the high demand for intensive care equipment in the event of a peak of the outbreak [4]. It is known that COVID-19 patients have a 5% intensive care ratio [5]. Due to the effect of COVID-19 on the airways, the ventilators and intensive care beds are often at the forefront of medical equipment in demand. The reason is that the absence of the equipment in question causes patient deaths due to insufficiency of health care [6, 7]. In this study, the demand for healthcare equipment and the number of patients during the course of the pandemic are attempted to be estimated through deep learning methods. It is seen that there is a limited number of studies in the literature with regard to the subject. In the studies conducted, mathematical and statistical methods were frequently used as demand forecasting method [8, 9]. However, there are serious disagreements regarding the use of mathematical methods [10]. This study contributes to the literature, especially with the increasing demand for medical equipment due to COVID-19 and the use of deep learning methods to predict the number of patients.
Recently, several studies based on machine learning have been conducted using the regression algorithms, in relation to the COVID-19 outbreak. Many of these studies were carried out for forecasting of COVID-19 cases. Out of these studies; Hu et al. [11] proposed a modified stacked autoencoder to real-time forecast the confirmed cases of Covid-19 in China. The experimental studies showed that the accuracy of the AI-based methods used for forecasting of the outbreak of COVID-19 was high. Ceylan [12] presented a model to predict the epidemiological COVID-19 prevalence in Italy, Spain and France, the most affected countries of Europe. This model included ARIMA models, which were formulated with different ARIMA parameters. In experimental studies, they used the prevalence data of COVID-19 from February 21, 2020, to April 15, 2020. According to the results obtained, the lowest MAPE values for Italy, Spain, and France were calculated as 4.75%, 5.84%, and 5.63%, respectively. Torrealba-Rodriguez et al. [13] evaluated the performances of Gompertz model, logistic model and artificial neural network for prediction of COVID-19 outbreak in Mexico. The experimental results show that performance (R2) of the Gompertz, logistic and artificial neural networks models was obtained as 99.98%, 99.96%, 99.99%, respectively. Parbat and Chakraborty [14] used support vector regression model to predict the total number of deaths, recovered cases, cumulative number of confirmed cases and number of daily cases in India. This model achieved above 97% accuracy for predicting deaths, recoveries, cumulative number of confirmed cases and 87% accuracy for predicting daily new cases. Similar to all these studies, Ribeiro et al. [15] and Utkucan and Tezcan [16] conducted studies that were based on machine learning for forecasting of the COVID-19 cumulative confirmed cases.
In this paper, a novel hybrid scheme for forecasting of demand for medical equipment and outbreak spreading of COVID-19 disease is presented. The proposed model uses a multilayer LSTM network to effectively forecast the number of respiratory equipment and intensive care bed needed due to COVID19 pandemic. The input layer of the system proposed is fed with COVID-19 data belonging to the first 68 days of occurrence in Turkey. Normalization process was applied to these data and then fed into different LSTM layers, and the LSTM layers were then sequentially connected to each other. After the last LSTM layer, the system proposed was trained by adding a dropout layer, a fully connected layer and a regression layer. Then, the proposed model based on trained weights was tested using the last 9 days of data. According to results obtained from in experimental studies, it was observed that the proposed model would yield a high success ratio for forecasting of the medical equipment demand and the number of COVID-19 cases.
The study continues with a second section, where materials and methods are presented. The proposed forecasting model is presented in the third section, while the findings based on the experimental studies are given in the fourth section. Finally, the study is concluded with Conclusion section.
Materials and methods
Dataset
The dataset used in this study consists of confirmed COVID-19 data that occurred in Turkey from March 27, 2020, up until June 11, 2020. This dataset was extracted from the Web site (https://covid19.saglik.gov.tr/) belonging to Health Ministry of Turkey. The dataset included number of intensive care patients and intubated patients as well as confirmed daily cases. In addition, a sample for the data available in the dataset is illustrated in Table 1.
Table 1.
Eight-day data belonging to COVID19 disease
| Date | Number of cases | Total number of intensive care patients | Total number of intubated patients |
|---|---|---|---|
| March 27, 2020 | 2069 | 344 | 241 |
| March 28, 2020 | 1704 | 445 | 309 |
| March 29, 2020 | 1815 | 568 | 394 |
| March 30, 2020 | 1610 | 725 | 523 |
| March 31, 2020 | 2704 | 847 | 622 |
| April 01, 2020 | 2148 | 979 | 692 |
| April 02, 2020 | 2456 | 1101 | 783 |
| April 03, 2020 | 2786 | 1251 | 867 |
During the experimental studies for intensive care patients and intubated patients, data for the first 68 days in the dataset were used for the purpose of training, whilst the remaining data for the last 9 days were used in testing the network model proposed. In addition, for confirmed daily cases, the first 84 days in the dataset were used for training, whilst the last 9 days were used in testing.
Long short-term memory network
The long short-term memory was proposed by Hochreiter and Schmidhuber as a type of recurrent neural network (RNN) architecture for modeling sequential data [17]. RNN architecture is based on analyzing information in input data, taking into account the values of the previous output. The working principle of LSTM architecture is based on long-term information reminder approach. This architecture contains hidden units, called memory cells. In general, the LSTM structure includes layers of forget, input and output gates. These layers determine whether an entry is significant and what information to delete or save [17–19]. The overall structure of the LSTM architecture is shown in Fig. 1.
Fig. 1.
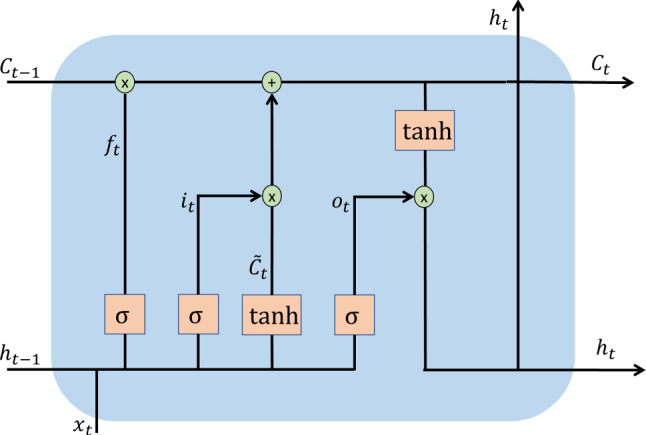
LSTM structure
As can be seen in Fig. 1, LSTM architecture consists of repetitive sequential blocks. The general processing steps of this architecture are as follows [18–21]:
- Firstly, using the information and , what information is to be deleted from the cell state is decided. These operations are carried out using in Eq. (1) in the forget layer:
where sigmoid is used as the activation function. h, w and b refer to the output of the LSTM, the weight matrix and the bias vector, respectively.1 - The next step is to decide what new information to store on the cell state. First, the information is updated using the sigmoid function (). Then, the tanh function is used for candidate values that will generate new information (). These operations are formulated by Eqs. (2) and (3):
2
Then, new information is created using Eq. (4):3 4
ADAM algorithm
ADAM (Adaptive Moment Estimation) [22] is a popular optimization method used in neural networks. This algorithm is designed to combine the advantages of Adagrad and Rmsprop methods. The updating of w (weight) and b (bias) values using this algorithm is given in Eq. (7):
| 7 |
where and are the exponentially weighted average of past gradients and gradients square history, respectively. In addition, and represent the learning rate, and the fixed value assigned to prevent the learning coefficient from being divided by 0, respectively [22–24].
Proposed forecasting model
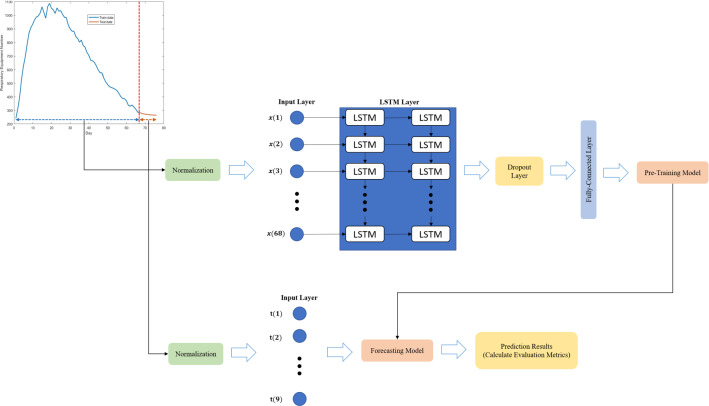
This section describes model proposed for forecasting of the demand for medical equipment as well as the number of cases in COVID19 disease. The proposed model consists of three main steps, normalization, multilayer LSTM network and dropout-dense-regression layers.
These steps are as follows:
In order to facilitate the calculations in the training, we applied the normalization process in input data. The max–min method was used for the normalization process.
The normalized data are fed into the multilayer LSTM network, and the LSTM layers are, then, sequentially connected to each other.
Following the processes in the last LSTM layer, dropout layer and dense layer are employed for the training of the proposed system.
Finally, using the trained weights of the test data, forecasting of the number of Intensive Care Beds, the number of Respiratory Equipment and the number of cases was performed.
A general representation of the working principle of the above-mentioned proposed model is presented in Fig. 2.
Fig. 2.
The operation principle of the proposed system
In this paper, an experimental study was carried out for the individual estimation of the number of intensive care beds, the number of respiratory equipment and number of cases using the proposed system. For this purpose, the total number of intensive care patients was used to estimate the number of Intensive Care Beds. Similarly, the total number of intubated patients used for the estimation of the number of respiratory equipment is fed as the input in the system.
In the training phase of the proposed method, the number of hidden units in the LSTM layers was set in the range of [5 100]. The training parameters and values are presented in Table 2.
Table 2.
Training parameters and values
| Parameter | Value |
|---|---|
| Initial learning rate | 0.001 |
| Learn rate schedule | Piecewise |
| Learn drop period | 100 |
| Learn drop factor | 0.001 |
| Gradient threshold | 2 |
Considering the parameters given in Table 2, the number of epochs was set in the range of [10, 100] with a step size of 5 and the batch sizes of 8, 16 and 24 were used. The “ADAM” optimization algorithm was used in the training of the LSTM network.
Experimental studies
The experimental studies were performed using MATLAB 2019b software on a computer with an Intel Xeon Silver 2.19 GHz processor, NVDIA P4000 Quadro GPU card and 32 GB RAM. In this study, the performance metrics used for the analysis of the experimental studies are the mean absolute percentage error (MAPE) and R2 values. The mathematical equations for each of these metrics are given in Eqs. (8) and (9):
| 8 |
| 9 |
where is the actual value, is the mean value of the actual value, is the predicted value, is the mean value of predicted value and is the size of the dataset.
In this paper, performance measures of proposed model for forecasting of the medical equipment demand, and number of cases in COVID19 disease were calculated. The results obtained from these experimental studies are detailed below.
Forecasting of number of cases
In this section, the forecast values of the multilayer LSTM-based model proposed for the number of COVID-19 cases are calculated. For this purpose, the number of cases in a 93-day period was used. The figures in the first 84 days of this period were used for training and the last 9 days for testing. Performance measures obtained from these experimental studies are presented in Table 3.
Table 3.
Performance results (%) of model proposed for forecasting of case numbers
| Date | Test | Prediction | MAPE | R2 |
|---|---|---|---|---|
| June 3, 2020 | 867 | 926.44 | 6.42 | 99.55 |
| June 4, 2020 | 988 | 961.05 | 2.80 | 99.92 |
| June 5, 2020 | 930 | 963.52 | 3.48 | 99.88 |
| June 6, 2020 | 878 | 957.64 | 8.32 | 99.31 |
| June 7, 2020 | 914 | 950.38 | 3.82 | 99.85 |
| June 8, 2020 | 989 | 943.46 | 4.83 | 99.77 |
| June 9, 2020 | 993 | 937.11 | 5.96 | 99.64 |
| June 10, 2020 | 922 | 931.25 | 0.99 | 99.99 |
| June 11, 2020 | 987 | 925.72 | 6.62 | 99.56 |
| Average values | 4.80 | 99.72 |
In Table 3, MAPE and R2 values based on the predicted and actual number of cases are given. When the predictions made are analyzed, the number of cases was predicted, by the model proposed, to be 931 for June 10, where the actual number of cases is 922, and MAPE value of 0.99% was obtained. Other estimates are included in Table 3. Based on these results, the forecasting results of the last 9 days are observed to be very close to the real values. In addition, the best estimates were made for cases on date: June 4, June 5, June 7 and June 10. In conclusion, MAPE and R2 values were obtained as 4.8% and 99.72%, respectively, on average using the model proposed for COVID19 case estimation. The time graph showing the forecasting of the values with the test data by means of the proposed model is given in Fig. 3.
Fig. 3.
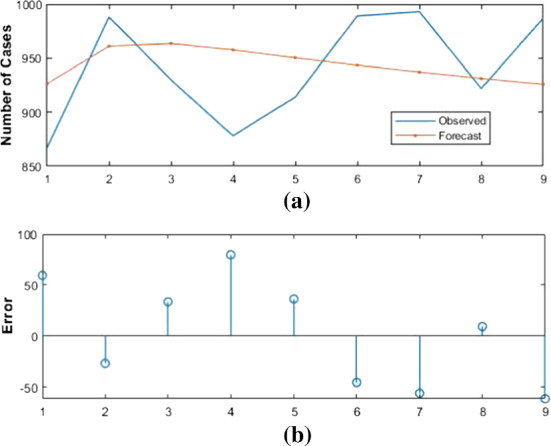
Forecasting results of proposed model and actual values for number of COVID-19 cases
Figure 3 shows the actual values of the test data between June 3–June 11 and the values estimated by the proposed model. As far as Fig. 3a is concerned, it is observed that the forecast values of the model proposed exhibit approximately the same tendency compared to the actual values. In addition, the forecasting results appear to be very close to actual values. On the other hand, Fig. 3b shows the number of residual errors between the actual values and the estimated values of the proposed model. According to these results, June 11 is the day in which the model proposed has the highest number of errors. The relationship between the 84-day data used for raw training and the forecast values of the model proposed for the last 9 days is presented in Fig. 4.
Fig. 4.
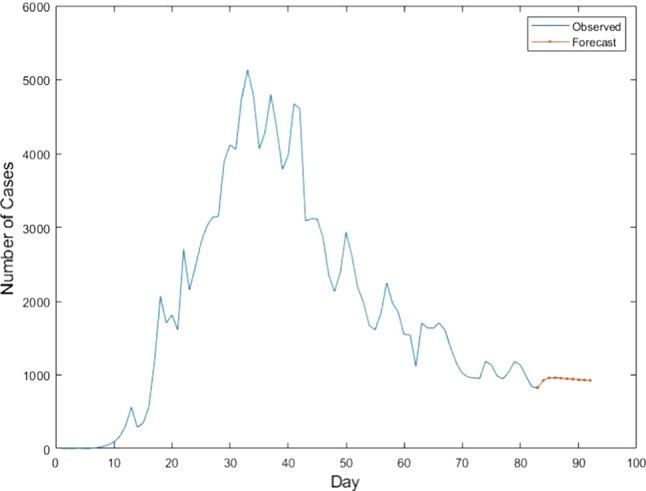
Forecasting values of model proposed and training values for number of COVID-19 cases
The training phase of the proposed LSTM network-based model for forecasting of number of cases was ended after 300 iterations. In addition, batch size, the first layer and the second layer of the LSTM network achieved the best performance using the values of 16, 30 and 10, respectively.
Forecasting of intensive care bed number
In this section, the forecast values of the multilayer LSTM-based model proposed for the number of intensive care beds are calculated. For this purpose, the total number of intensive care patients in a 77-day period was used. The figures in the first 68 days of this period were used for training and the last 9 days for testing. Performance measures obtained from these experimental studies are presented in Table 4.
Table 4.
Performance results (%) of model proposed for forecasting of intensive care bed number
| Date | Test | Prediction | MAPE | R2 |
|---|---|---|---|---|
| June 3, 2020 | 612 | 626.98 | 2.39 | 99.94 |
| June 4, 2020 | 602 | 620.76 | 3.05 | 99.91 |
| June 5, 2020 | 592 | 616.29 | 3.94 | 99.84 |
| June 6, 2020 | 591 | 613.48 | 3.66 | 99.87 |
| June 7, 2020 | 613 | 612.20 | 0.13 | 100 |
| June 8, 2020 | 625 | 612.34 | 2.06 | 99.96 |
| June 9, 2020 | 642 | 613.71 | 4.61 | 99.79 |
| June 10, 2020 | 631 | 616.17 | 2.40 | 99.94 |
| June 11, 2020 | 643 | 619.57 | 3.78 | 99.86 |
| Average values | 2.89 | 99.90 |
In Table 4, MAPE and R2 values based on the predicted and actual number of intensive care beds are given. When the predictions made are analyzed, the number of intensive care beds was predicted, by the model proposed, to be about 612 for June 7, where the actual number of intensive care beds is 613, and MAPE value of 0.13% was obtained. Other estimates are included in Table 4. Based on these results, the forecasting results of the last 9 days are observed to be very close to the real values. In addition, the best estimates were made for intensive care beds on date: June 3, June 7, June 8 and June 10. In conclusion, MAPE and R2 values were obtained as 2.89% and 99.90%, respectively, on average using the model proposed for COVID19 intensive care bed estimation. The time graph showing the forecasting of the values with the test data by means of the proposed model is given in Fig. 5.
Fig. 5.
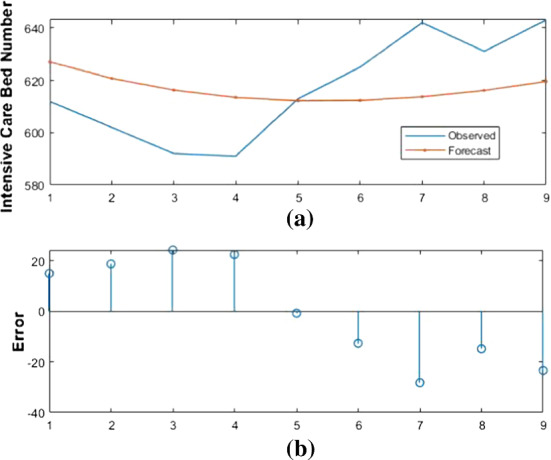
Forecasting results of proposed model and actual values for number of COVID-19 intensive care beds
Figure 5 shows the actual values of the test data between June 3–June 11 and the values estimated by the proposed model. As far as Fig. 5a is concerned, it is observed that the forecast values of the model proposed exhibit approximately the same tendency compared to the actual values. In addition, the forecasting results appear to be very close to actual values. On the other hand, Fig. 5b shows the number of residual errors between the actual values and the estimated values of the proposed model. According to these results, June 9 is the day in which the model proposed has the highest number of errors. The relationship between the 67-day data used for raw training and the forecast values of the model proposed for the last 9 days is presented in Fig. 6.
Fig. 6.
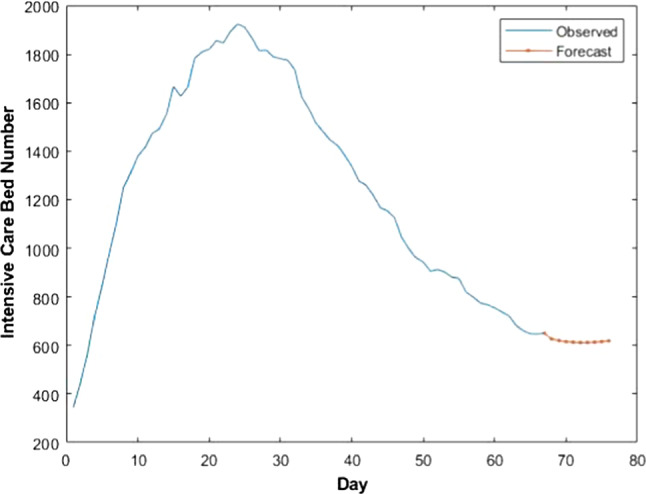
Forecasting values of model proposed and training values for number of COVID-19 intensive care beds
The training phase of the proposed LSTM network-based model for forecasting of number of intensive care beds was ended after 500 iterations. In addition, batch size, the first layer and the second layer of the LSTM network achieved the best performance using the values of 16, 20 and 10, respectively.
Forecasting of respiratory equipment number
In this section, the forecast values of the multilayer LSTM-based model proposed for the number of respiratory equipment are calculated. For this purpose, the total number of intubated patients in a 77-day period was used. The figures in the first 68 days of this period were used for training and the last 9 days for testing. Performance measures obtained from these experimental studies are presented in Table 5.
Table 5.
Performance results (%) of model proposed for forecasting of respiratory equipment number
| Date | Test | Prediction | MAPE | R2 |
|---|---|---|---|---|
| June 3, 2020 | 261 | 278.72 | 6.35 | 99.60 |
| June 4, 2020 | 265 | 274.77 | 3.55 | 99.87 |
| June 5, 2020 | 269 | 271.79 | 1.02 | 99.99 |
| June 6, 2020 | 264 | 269.50 | 2.04 | 99.96 |
| June 7, 2020 | 274 | 267.50 | 2.33 | 99.95 |
| June 8, 2020 | 261 | 266.42 | 2.03 | 99.96 |
| June 9, 2020 | 281 | 265.42 | 5.86 | 99.66 |
| June 10, 2020 | 280 | 264.49 | 5.78 | 99.67 |
| June 11, 2020 | 266 | 264.17 | 0.69 | 100 |
| Average values | 3.29 | 99.85 |
In Table 5, MAPE and R2 values based on the predicted and actual number of respiratory equipment are given. When the predictions made are analyzed, the number of respiratory equipment was predicted, by the model proposed, to be about 264 for June 11, where the actual number of respiratory equipment is 266, and MAPE value of 0.69% was obtained. Other estimates are included in Table 5. Based on these results, the forecasting results of the last 9 days are observed to be very close to the real values. In addition, the best estimates were made for respiratory equipment on dates: June 5, June 6, June 7 and June 11. In conclusion, MAPE and R2 values were obtained as 2.65% and 99.90%, respectively, on average using the model proposed for COVID19 respiratory equipment estimation. The time graph showing the forecasting of the values with the test data by means of the proposed model is given in Fig. 7.
Fig. 7.
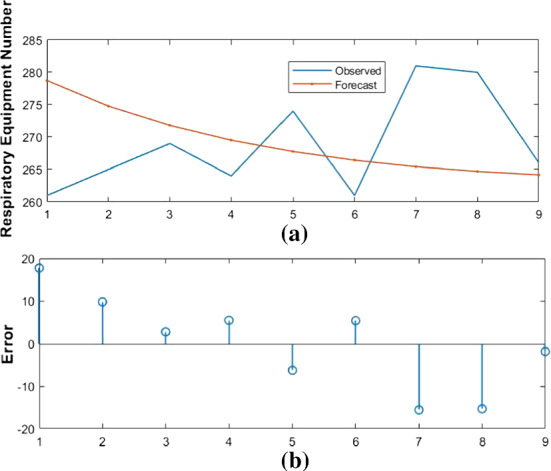
Forecasting results of proposed model and actual values for number of COVID-19 respiratory equipment
Figure 7 shows the actual values of the test data between June 3 and June 11and the values estimated by the proposed model. As far as Fig. 7a is concerned, the forecasting results appear to be very close to actual values. On the other hand, Fig. 7b shows the number of residual errors between the actual values and the estimated values of the proposed model. According to these results, June 3 is the day in which the model proposed has the highest number of errors. The relationship between the 67-day data used for raw training and the forecast values of the model proposed for the last 9 days is presented in Fig. 8.
Fig. 8.
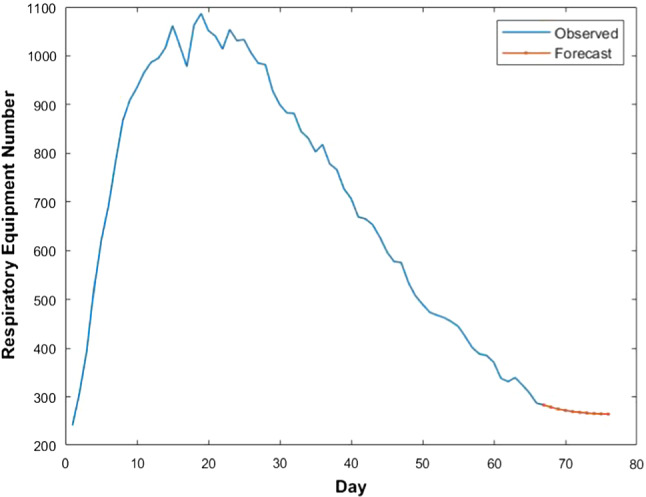
Forecasting values of model proposed and training values for number of COVID-19 respiratory equipment
The training phase of the proposed LSTM network-based model for forecasting of number of respiratory equipment was ended after 200 iterations. In addition, batch size, the first layer and the second layer of the LSTM network achieved the best performance using the values of 8, 10 and 5, respectively.
Discussion
In this paper, a multilayer long short-term memory network model is proposed for forecasting of medical equipment demand and outbreak spreading, during the coronavirus outbreak (COVID-19). To test the proposed approach, a dataset containing information on the number of intensive care patients and intubated patients as well as confirmed daily COVID-19 cases occurring in Turkey was used. Experimental studies were carried out independently for each of these three parameters. In the experimental studies carried out, MAPE and R2 values were used to evaluate the performance of the proposed model. Among these values, MAPE is a statistical method more widely accepted in the literature. MAPE values are classified as “Highly Accurate”, “Accurate”, “Acceptable”, and “Inaccurate”, if they are below 10%, between 10 and 20%, between 20 and 50%, and over 50%, respectively [25, 26]. According to the results obtained from the experimental studies carried out in this study,
MAPE and R2 values for forecasting of case numbers were 4.8% and 99.72%, respectively.
MAPE and R2 values for forecasting of intensive care bed numbers were 2.89% and 99.90%, respectively.
MAPE and R2 for forecasting of respiratory equipment numbers were 3.29% and 99.85%, respectively.
Based on the results given above, the MAPE values of the model proposed for all three parameters are below 10%. This clearly illustrates that the proposed model is highly accurate. In addition, the proposed model performs well for the prediction of intensive care bed number, whereas the forecasting of the number of confirmed cases resulted in a weaker performance than that of other methods.
In this study, the multilayer LSTM network proposed for forecasting of the medical equipment demand and the number of cases in COVID-19 outbreak was compared with traditional prediction methods. In accordance with this purpose, we used prediction methods such as AR, ARIMA, SVM, decision tree and linear regression. MAPE values obtained from these experimental studies are given in Table 6.
Table 6.
Comparison of traditional prediction methods with proposed model
| Case numbers (%) | Intensive care bed numbers (%) | Respiratory equipment number (%) | |
|---|---|---|---|
| AR | 17.25 | 5.03 | 8.82 |
| ARIMA | 12.57 | 5.53 | 7.96 |
| SVM | 14.01 | 5.25 | 5.73 |
| Decision tree | 15.17 | 8.92 | 6.11 |
| Linear regression | 23.76 | 14.56 | 13.55 |
| Proposed model | 4.8 | 2.89 | 3.29 |
As can be understood from Table 6, the MAPE value of the model proposed in the current study is observed to be more successful than those of the traditional prediction methods for forecasting of case numbers, intensive care bed numbers, respiratory equipment number. In addition, while the average best MAPE values among traditional prediction methods were obtained with the SVM and ARIMA method, the average worst MAPE value was achieved with the linear regression method.
When the studies carried out on the COVID-19 outbreak in the literature are considered, the studies in [11–13, 15, 16, 27, 28] are focused on forecasting of confirmed cases, the studies in [14, 29] are focused on forecasting of the numbers of confirmed cases, recovered cases and deaths, and the study in [30] is focused on forecasting of the number of deaths. In these studies, machine learning-based regression methods such as ARIMA model, support vector regression and artificial neural network were used. Contrary to all previous studies, in this study, the forecasting of demand for medical equipment as well as the number of cases was performed. This has made a significant contribution in determining needs of the countries for intensive care beds and respiratory equipment during the COVID-19 outbreak in the future. In addition, in spite of the fact that the numbers of confirmed cases and the deaths were attempted to be forecast through LSTM network in the studies [31–34], the LSTM network has been used in this study, for the first time, to forecast the number of intensive care beds and respiratory equipment. This study is believed to be a pioneer to the future studies to be carried out on forecasting of demands for medical equipment.
The advantages and limitations of the multilayer LSTM-based model proposed are as follows:
Advantages:
This paper is one of the first studies carried out on forecasting of demand for medical equipment.
The multilayer long short-term memory network model proposed reduces the training complexity of operations.
Best parameters were selected to make forecast based on LSTM network.
The proposed model has high forecasting potential other prediction methods.
Limitations:
Insufficient data on the COVID-19 outbreak.
Finding optimal parameters of LSTM network.
Showing the variability of daily data according to the policies of the countries.
Conclusion
Demand for healthcare equipment increases due to infectious diseases. Forecasting of these increasing demands allows countries to plan and manage their resources effectively. For this purpose, statistical and artificial intelligence-based forecasting models play an important role for the prediction of increased demand for medical equipment during infectious disease periods. In this study, a deep learning approach based on deep long short-term memory network is proposed for forecasting of the medical equipment demand and the number of cases in COVID-19 outbreak. The system proposed uses a normalization layer, a multilayer LSTM network, a dropout layer, a fully connected layer and a regression layer. The model trained with the proposed system is used for forecasting the number of intensive care beds, the number of respiratory equipment and the number of cases in the days to come. To verify the validity of the proposed system, a dataset containing 77-day COVID-19 data was used: 68 days for training and 9 days for testing. The experimental results showed that the model proposed for the forecasting of the number of intensive care beds, the number of respiratory equipment, and the number of cases yielded MAPE values of (2.89%, 3.29%, 4.80%) and R2 values of (99.90%, 99.85%, 99.72%), respectively.
In this paper, the current state of COVID-19 outbreak in Turkey is presented, and extensive experimental studies were carried out on the forecasting of the medical equipment demand during the course of the outbreak. To the best knowledge of the authors, this study is one of the first studies to apply deep learning based methods on the LSTM network for the forecasting of the number of intensive care beds, the number of respiratory equipment, and the number of COVID-19 cases in Turkey. In addition, the model proposed is believed to help the Turkish government monitor the current situation and identify the medical equipment needs.
In future works, the authors are planning to use the multiobjective optimization methods to optimize the parameters of the LSTM network used in the system proposed. In addition, data augmentation methods for small data and other regression algorithms will be investigated.
Footnotes
Publisher's Note
Springer Nature remains neutral with regard to jurisdictional claims in published maps and institutional affiliations.
References
- 1.Zhu N, et al. A novel coronavirus from patients with pneumonia in China, 2019. N. Engl. J. Med. 2020;382(8):727–733. doi: 10.1056/NEJMoa2001017. [DOI] [PMC free article] [PubMed] [Google Scholar]
- 2.World Health Organization. 2019 Novel Coronavirus (2019‑nCoV): Strategic Preparedness and Response Plan. 2020. Accessed in 28nd April, 2020. https://www.who.int/publications-detail/strategic-preparedness-and-response-plan-for-the-new-coronavirus.
- 3.Kumar A, Rajasekharan Nayar K, Koya SF. COVID-19: Challenges and its consequences for rural health care in India. Public Health Pract. 2020;1(May):100009. doi: 10.1016/j.puhip.2020.100009. [DOI] [PMC free article] [PubMed] [Google Scholar]
- 4.Fox, G.J., Trauer Head, J.M., Mcbryde, E.: Modelling the impact of COVID-19 upon intensive care services in New South Wales. Med. J. Australia 1–21 (2020) [DOI] [PMC free article] [PubMed]
- 5.Grasselli G, Ospedale G, Policlinico M, Pesenti A, Ospedale G, Policlinico M, Cecconi M. Critical care utilization for the COVID-19 outbreak in Lombardy, Italy early experience and forecast during an emergency response. JAMA. 2020;323(16):1545–1546. doi: 10.1001/jama.2020.4031. [DOI] [PubMed] [Google Scholar]
- 6.Her M. Repurposing and reshaping of hospitals during the COVID-19 outbreak in South Korea. One Health. 2020;10:100137. doi: 10.1016/j.onehlt.2020.100137. [DOI] [PMC free article] [PubMed] [Google Scholar]
- 7.Massonnaud, C., Roux, J., Crépey, P.: COVID-19: Forecasting short term hospital needs in France. MedRxiv (January), 20036939 (2020)
- 8.Ankaralı, H., Ankaralı, S.: Forecasting of the number of intensive care beds and hospital capacity for COVID-19 outbreak in Turkey until the end of April. Turk. J. Intens. Care (2020)
- 9.Murray CJ. Forecasting COVID-19 impact on hospital bed-days, ICU-days, ventilator-days and deaths by US state in the next 4 months. MedRxiv. 2020;114:20043752. [Google Scholar]
- 10.Mas-Coma, S., Jones, M.K., Marty, A.M.: COVID-19 and globalization. One Health 9 (2020) [DOI] [PMC free article] [PubMed]
- 11.Hu, Z., Ge, Q., Jin, L., Xiong, M.: Artificial intelligence forecasting of covid-19 in China. arXiv preprint arXiv:2002.07112 (2020) [DOI] [PMC free article] [PubMed]
- 12.Ceylan, Z.: Estimation of COVID-19 prevalence in Italy, Spain, and France. Sci. Total Environ. 138817 (2020) [DOI] [PMC free article] [PubMed]
- 13.Torrealba-Rodriguez, O., Conde-Gutiérrez, R.A., Hernández-Javier, A.L.: Modeling and prediction of COVID-19 in Mexico applying mathematical and computational models. Chaos Solitons Fract. 109946 (2020) [DOI] [PMC free article] [PubMed]
- 14.Parbat, D., Chakraborty, M.: A Python based support vector regression model for prediction of Covid19 cases in India. Chaos Solitons Fract. 109942 (2020) [DOI] [PMC free article] [PubMed]
- 15.Ribeiro, M.H.D.M., da Silva, R.G., Mariani, V.C., dos Santos Coelho, L.: Short-term forecasting COVID-19 cumulative confirmed cases: perspectives for Brazil. Chaos Solitons Fract. 109853 (2020) [DOI] [PMC free article] [PubMed]
- 16.Utkucan, Ş., Tezcan, Ş.: Forecasting the cumulative number of confirmed cases of COVID-19 in Italy, UK and USA using fractional nonlinear grey Bernoulli model. Chaos Solitons Fract. 109948 (2020) [DOI] [PMC free article] [PubMed]
- 17.Hochreiter S, Schmidhuber J. Long short-term memory. Neural Comput. 1997;9(8):1735–1780. doi: 10.1162/neco.1997.9.8.1735. [DOI] [PubMed] [Google Scholar]
- 18.Pandey, S.K., Janghel, R.R.: Automatic arrhythmia recognition from electrocardiogram signals using different feature methods with long short-term memory network model. Signal Image Video Process. 1–9 (2020)
- 19.Turkoglu, M., Hanbay, D., Sengur, A.: Multi-model LSTM-based convolutional neural networks for detection of apple diseases and pests. J. Ambient Intell. Human. Comput. 1–11 (2019)
- 20.Welhenge AM, Taparugssanagorn A. Human activity classification using long short-term memory network. SIViP. 2019;13(4):651–656. doi: 10.1007/s11760-018-1393-7. [DOI] [Google Scholar]
- 21.Dolek, I.: LSTM, Deep Learning Turkey. https://medium.com/@ishakdolek/lstm-d2c281b92aac. Accessed 10 May 2019
- 22.Kingma, D.P., Ba, J.A.: A method for stochastic optimization. arXiv preprint arXiv:1412.6980(2014)
- 23.Ser, G., Bati, C.T.: Determining the best model with deep neural networks: Keras application on mushroom data. YYU J. Agric. Sci. 29(3), 406–417
- 24.Deep Learning Tips and Tricks cheatsheet. Accessed in 14th September, 2020. https://stanford.edu/~shervine/teaching/cs-230/cheatsheet-deep-learning-tips-and-tricks
- 25.Witt SF, Witt CA. Modeling and Forecasting Demand in Tourism. Londra: Academic Press; 1992. [Google Scholar]
- 26.Lewis CD. Industrial and Business Forecasting Methods. Londra: Butterworths Publishing; 1982. [Google Scholar]
- 27.Tomar, A., Gupta, N.: Prediction for the spread of COVID-19 in India and effectiveness of preventive measures. Sci. Total Environ. 138762 (2020) [DOI] [PMC free article] [PubMed]
- 28.Ahmar, A.S., del Val, E.B.: SutteARIMA: Short-term forecasting method, a case: Covid-19 and stock market in Spain. Sci. The Total Environ. 138883 (2020) [DOI] [PMC free article] [PubMed]
- 29.Yousaf, M., Zahir, S., Riaz, M., Hussain, S.M., Shah, K.: Statistical analysis of forecasting COVID-19 for upcoming month in Pakistan. Chaos Solitons Fract. 109926 (2020) [DOI] [PMC free article] [PubMed]
- 30.Singh, S., Parmar, K.S., Kumar, J., Makkhan, S.J.S.: Development of new hybrid model of discrete wavelet decomposition and autoregressive integrated moving average (ARIMA) models in application to one month forecast the casualties cases of COVID-19. Chaos Solitons Fract. 109866 (2020) [DOI] [PMC free article] [PubMed]
- 31.Yan, B., et al.: An improved method of COVID-19 case fitting and prediction based on LSTM. arXiv preprint arXiv:2005.03446 (2020)
- 32.Chimmula, V.K.R., Zhang, L.: Time series forecasting of covid-19 transmission in canada using lstm networks. Chaos Solitons Fract. 109864 (2020) [DOI] [PMC free article] [PubMed]
- 33.Azarafza, M., Azarafza, M., Tanha, J.: COVID-19 infection forecasting based on deep learning in Iran. MedRxiv (2020)
- 34.Zandavi, S.M., Rashidi, T.H., Vafaee, F.: Forecasting the spread of Covid-19 under control scenarios using LSTM and dynamic behavioral models. arXiv preprint arXiv:2005.12270 (2020)


