Abstract
The quick spread of coronavirus disease (COVID-19) has resulted in a global pandemic and more than fifteen million confirmed cases. To battle this spread, clinical imaging techniques, for example, computed tomography (CT), can be utilized for diagnosis. Automatic identification software tools are essential for helping to screen COVID-19 using CT images. However, there are few datasets available, making it difficult to train deep learning (DL) networks. To address this issue, a generative adversarial network (GAN) is proposed in this work to generate more CT images. The Whale Optimization Algorithm (WOA) is used to optimize the hyperparameters of GAN's generator. The proposed method is tested and validated with different classification and meta-heuristics algorithms using the SARS-CoV-2 CT-Scan dataset, consisting of COVID-19 and non-COVID-19 images. The performance metrics of the proposed optimized model, including accuracy (99.22%), sensitivity (99.78%), specificity (97.78%), F1-score (98.79%), positive predictive value (97.82%), and negative predictive value (99.77%), as well as its confusion matrix and receiver operating characteristic (ROC) curves, indicate that it performs better than state-of-the-art methods. This proposed model will help in the automatic screening of COVID-19 patients and decrease the burden on medicinal services frameworks.
Keywords: Automatic diagnosis, Coronavirus, COVID-19, Generative Adversarial Network, Whale Optimization Algorithm, Deep learning
Introduction
Coronavirus disease (COVID-19) is an infectious disease caused by severe acute respiratory syndrome coronavirus 2 (SARS-CoV-2). The virus emerged in Wuhan, China, and has quickly spread to different nations since December 2019. SARS-CoV-2 is named due to its trademark solar corona (crown-like) appearance when seen under an electron microscope [1]. The World Health Organization (WHO) named this infective disease COVID-19 on 11 February 2020. There have been 3.26 million confirmed cases and 233,000 deaths (as of 01 May 2020 at 12.53 PM) worldwide. COVID-19 is a respiratory disease (such as the current season’s influenza) with symptoms such as hacking coughs, dyspnea, and fever. COVID-19 generally spreads through contact with aerosolized particles from an infected person when he or she hacks or wheezes [2]. Furthermore, an individual can become infected when he or she touches a surface or object with the disease on it and then touches his or her nose, mouth, or eyes [3].
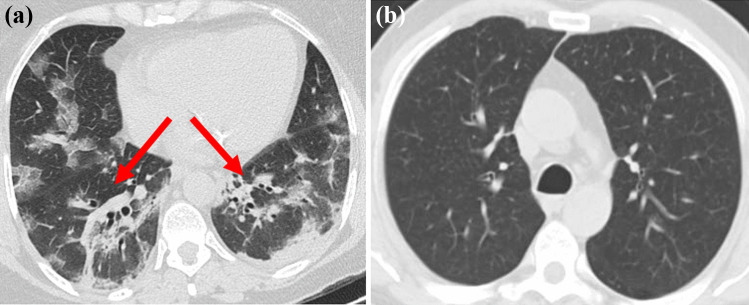
The standard method for diagnosing COVID-19 is reverse transcription-polymerase chain reaction (RT-PCR) from a nasopharyngeal swab. Even though the continuous polymerase chain reaction examination of the sputum has the best quality for detecting COVID-19, the time required to confirm the disease in infected patients can be high due to the high false-positive rate of the test [4]. Medical imaging modalities, such as chest-computed tomography (CT), can play a vital role in diagnosing positive COVID-19 patients automatically, particularly infected children and pregnant women. CT machines are available in all emergency hospitals and facilities, delivering three-dimensional (2D) projection images of the patient’s chest. For the most part, the results of CT scans are key for radiologists to distinguish chest pathology and have been applied to recognize or confirm COVID-19 on the order of seconds [5]. Figure 1 shows sample CT scan images of a patient with (Fig. 1a) and without COVID-19 (Fig. 1b).
Fig. 1.
(a) CT image of a COVID-19-infected person showing ground glass opacities. (b) CT image of a non-COVID-19-infected person [https://www.kaggle.com/plameneduardo/sarscov2-ctscan-dataset]
Early detection of COVID-19 can help in controlling the spread of the disease. Presently, a COVID-19 diagnosis is made according to the results of the RT-PCR test. However, RT-PCR has many limitations, such as low availability, high monetary and time costs, and high false-positive rates. Due to the large time consumption of the test, an automatic diagnosis method is urgently needed to improve the reliability, safety, and speed of diagnosis. These methods could help medical professionals screen COVID-19 automatically within a shorter period [6]. These are the motivations for proposing this study.
Computer-aided diagnosis (CAD) frameworks assist medical professionals with a rapid, automatic diagnosis using graphical processing units (GPUs) by processing medical images. The deep-learning (DL) architecture has been used in many CAD frameworks and numerous medical imaging applications, such as COVID-19 [7]. In recent years, generative adversarial networks (GANs) have yielded the most promising results in medical image augmentation [8]. Convolutional neural networks (CNNs) are DL algorithms used in many applications, including image classification, CAD, and computer vision [9]. These advantages motivated our attempt to propose a CNN algorithm for COVID-19 diagnosis in this paper.
The novelty of the proposed work is as follows:
An optimized GAN architecture is proposed for COVID-19 diagnosis through chest CT images.
New CT images are generated using the optimized GAN architecture to better train a proposed CNN model.
The GAN hyperparameter generator is optimized using the Whale Optimization Algorithm (WOA) to avoid overfitting and instability issues.
The generated CT images are larger than the original dataset images, which helps in effective feature extraction and performance metric improvement.
The contributions of this work are as follows:
A new optimized GAN network is proposed to generate COVID-19 and non-COVID-19 images.
The GAN hyperparameters are optimized using WOA to achieve the most accurate results in distinguishing COVID-19 from non-COVID-19 patients from CT images.
The WOA is compared with other optimization algorithms for tuning the GAN hyperparameters.
A CNN model is proposed for the automatic diagnosis of COVID-19 using CT images.
The rest of this paper is arranged as follows: Related works are introduced in “Related Works”. Relevant theoretical and mathematical fundamentals are given in “Background”. The material and methodology are presented in “Methodology”. The experiments are given in “Experiments”. Finally, the conclusion is presented in “Conclusions”.
Related Works
DL-based techniques have recently become popular for identifying and locating COVID-19. This section briefly covers ongoing attempts at making a COVID-19 diagnosis with CT images. Since uncovering the possibility of utilizing CT images to recognize COVID-19 and given the shortcomings of human detection, there have been a number of investigations attempting to create automatic COVID-19 classification frameworks, mainly utilizing CNNs. A pneumonia chest X-ray recognition framework [10] based on a DL network with transfer learning has been proposed for small datasets. The implementation of DL greatly influenced the recommended model strength and made it immune to overfitting issues and aided in producing additional images from the dataset. A similar method [11] for COVID-19 detection was proposed utilizing chest X-ray images for classifying normal, COVID-19, viral pneumonia, and bacterial pneumonia patients.
A conditional GAN (CGAN) [12] was presented based on data augmentation with transfer learning for COVID-19 screening with CT images. The constrained datasets for COVID-19, particularly in terms of the number of CT images, were the original inspiration of this method. The CGAN used in reference [10], however, yielded a low accuracy because the authors used deep transfer learning to extract the CT image dataset features. The DL network had not been trained using newly generated images; instead, features were extracted using only a pretrained network. In this paper, we trained the DL network using a large, newly generated dataset, yielding better accuracy than the CGAN.
A U-Net-based GAN [7] was described for lung segmentation using chest X-ray images. This strategy employs a fully convolutional neural network with the GAN model to segment the lungs for COVID-19 images. In recent studies [13], 90–95% of the suspected COVID-19 patients underwent a chest CT scan for diagnosis because of the high detection rate of the imaging modality. According to the authors, the CT examination is timely, fast, and more sensitive than X-ray examination. One of the symptoms related to COVID-19 is lung lesions, which can be diagnosed using CT examinations during preliminary screening.
In reference [14], the CT scan indicated that COVID-19 is related to the presence of bilateral glass opacities. The authors of [15] found CT abnormalities among their COVID-19 patients, including ground-glass opacity (88.0%), bilateral involvement (87.5%), and peripheral distribution (76%). CT abnormalities were found in a 40-year-old patient with symptoms of fever, fatigue, and chest tightness by [16]. They observed progress in peripheral consolidations, and the lungs presented with ground-glass opacities. After treatment of the diseases, CT images showed that the lesions had been almost completely absorbed. The temporal changes in the CT images over 6–11 days of illness in a child were identified by [17]. DL techniques introduced in March 2020 were used for the automatic diagnosis of this patient.
A COVID-19 diagnostic technique using deep learning through CT images was proposed by [8]. The main drawback of their approach is that the CT scan image is first preprocessed, and then, the lungs are extracted as the region of interest (ROI) using the U-net segmentation method. Then, only the ROI is passed to the convolutional neural network for identification purposes. Preprocessing and extracting ROIs using U-net increase the complexity of this algorithm. Multiple DL networks have been proposed [18] to extract graphical features of and diagnose COVID-19. An early screening method was proposed for COVID-19 using DL networks through CT images with an efficiency of 86.7% [19].
The VB-Net DL network was tested [20] to segment infected regions in CT scan images. To evaluate the proposed performance of the DL network segmentation, the Dice similarity coefficient and percentage of infection were compared between DL-based and manual segmentation. Changes in the CT scan were quantitatively evaluated [21] from COVID-19 patients’ lungs by an automated DL method. The authors measured the whole lung opacification percentage automatically using DL software and compared the results among each infected person’s mild, moderate, and severe stages.
A DL framework was developed [22] that investigates CT images to identify COVID-19 pneumonia features. An AI system was proposed [23] for making quick COVID-19 diagnoses with a precision that was essentially indistinct from that of experienced radiologists. A DL model was proposed [24] that can be utilized by radiologists or health experts to analyze COVID-19 cases quickly and accurately. However, the lack of an openly accessible dataset of X-ray and CT images makes it difficult to structure such a DL model. In this work, we construct an extensive dataset of X-ray and CT images from various sources, resulting in a necessary yet compelling COVID-19 identification procedure utilizing DL and transfer learning (TL) techniques.
A deep network was utilized [25] to improve the performance using TL methods and to perform a comparative analysis with different CNN structures. An automatic DL framework was presented and tested that utilized CT images [26]. Various CNN models [27] were compared in terms of classifying CT tests for COVID-19, influenza viral pneumonia, or normal individuals. The authors contrasted the referenced examination with one created based on existing 2D and 3D DL models, testing them based on the most recent clinical knowledge.
According to the related works, all use DL to classify normal and COVID-19 images. However, the DL networks are all data-hungry; they must be trained with a large number of images to maximize the performance of the network. However, the number of available COVID-19 CT images in this study is less. Hence, a GAN is proposed in this work to generate more images from the small number of available images. The advantage of the GAN is that it overcomes the overfitting issue even for small datasets. The motivations and research gaps of the related works are reported in Table 1.
Table 1.
Summary of related works
| Reference | Motivation | Dataset size | Limitations/research gap |
|---|---|---|---|
| [5] | Finding COVID-19 symptoms progress in pregnant women’s is quite challenge | 59 | Very small dataset, majority images are acquired from women which includes pregnant women and children’s, acquired images are low resolution |
| [10] | To generate more number of COVID-19 images | 624 | Lack of clinical studies and the generated images are low resolution |
| [11] | To generate more number of COVID-19 images sing GAN | 306 | Lack of testing and validated data |
| [12] | To increase the COVID-19 CT images with available limited CT images | 742 | Augmented images are low resolution and lack of clinical studies |
| [13] | To differentiate the symptoms of COVID-19 from general lung disease | 50 | Very small dataset and differentiating the sign of COVID-19 is difficult from the lung diseases |
| [15] | To analyze the characteristics of COVID-19 diseases using CT images | 37 | Very small dataset |
| [16] | To find the infected region of COVID-19 using CT images | 4 | Very small dataset |
| [17] | To study the CT images temporal changes in COVID-19-infected persons | 90 | Very small dataset |
| [18] | The RT-PCR testing costly and limited in numbers | 757 | Limited training data and classification accuracy is poor |
| [19] | The RT-PCR testing is the time consuming process | 618 | Training and testing samples are limited |
| [20] | High false negative in RT-PCR testing | 742 | Acquired CT images are showing more number of artifacts |
| [21] | To monitor the periodical changes of COVID-19-infected lungs | 126 | Very small dataset, lack of architecture information, and systematic evaluation has not presented |
| [24] | To develop an automated toolkit for COVID-19 detection instead of manual detection | 361 | Limited amount of training and testing images |
| [25] | To effectively use DL to make shortage of medical professional in this pandemic situation | 646 | Limited training data |
| [27] | Radiographic patterns of Ct slices produced better performance than RT-PCR test | 618 | Lack of clinical studies |
Background
Generative Adversarial Network
GANs are a subset of DL models [28]. GANs are an extraordinary type of neural system model where two systems are implemented simultaneously, one concentrating on generation and the other on discrimination. GANs provide a strategy for learning deep information without broadly clarified training information. They learn by determining reverse spread signals through a competitive procedure, including a pair of networks. This strong training plan has led to interest from both the scholarly community and industry due to its ease in confronting field changes and its viability in producing new image sets. GANs have gained extraordinary ground and been widely executed in numerous applications, such as image editing, pattern classification, and image synthesis [28].
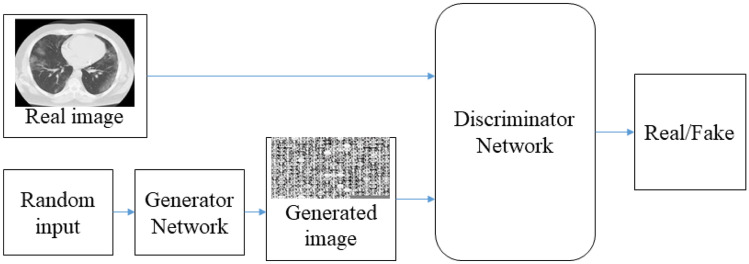
The general architecture of the GAN is shown in Fig. 2. In general, the GAN contains two kinds of systems, called generator () and discriminator (). GANs train a deep , which takes a random input to produce a sample from the necessary distribution [28].
Fig. 2.
General architecture of the generative adversarial network
Generator takes noise samples, , from a uniform distribution s as the input and outputs new data . The distribution of should be similar to the real data, . The discriminator differentiates between a real data sample and a generated data sample . The parameters of and are updated according to Eq. (1). In this way, the GAN implements an adversarial procedure to produce a new image that is very similar to the real image.
| 1 |
Whale Optimization Algorithm
The Whale Optimization Algorithm (WOA) [28] is a swarm intelligence method that mimics the behaviors of bubble-net feeding humpback whales seen in nature. The motivation for proposing the WOA for COVID-19 diagnosis is twofold. First, it is a very competitive optimization algorithm that has been applied to various research fields, such as feature selection, economic load dispatch problems, and flow scheduling problems. In addition, the WOA benefits from avoiding high local optima, which leads to avoidance of overlapping features in the problem of feature selection.
This algorithm was proposed in 2016 [28] as a reliable alternative to the existing optimization algorithms. The WOA considers the optimization algorithm as a black box and estimates the global optimum using specific mechanisms. As Algorithm 1 shows, the WOA creates and improves upon a set of solutions for a given optimization problem. This improvement is inspired by the encircling of and spiral movements around prey performed by humpback whales. The main position-updating equations in WOA are as follows:
| 2 |
where indicates a random number in the range , and designates the distance of the th whale the prey, is the constant that defines the shape of the logarithmic spiral, is the random number in between and , t indicates the current iteration, , , , a linearly decreases from 2 to 0 over the course of iterations for both exploitation and exploration stages, and r is the random vector whose values are between 0 and 1. This equation allows switching between two mechanisms: encircling prey and the spiral bubble-net mechanism. The following equations are used to update the position of each whale:
| 3 |
| 4 |
The developers of WOA demonstrated that compared with existing operating algorithms, this algorithm is very competitive and often superior when solving challenging optimization problems. This is due to several reasons, including but not limited to, a great balance of exploration and exploitation, few parameters to tune, a stochastic nature, a lack of gradient usage, and high avoidance of locally optimal solutions; these have motivated endeavors to utilize WOA as a trainer for DL because of the challenges of the learning procedure. Hypothetically, WOA should have the option to train any pretrained CNN with a suitable objective function and problem definition. Additionally, furnishing the WOA with a sufficient number of search agents and epochs will aid in the success of algorithm.
The motivation for using the WOA is hyperparameter optimization, which is a challenging task because the proper balance between exploitation and exploration should be maintained to avoid local minima. In the WOA, vector is updated using an adaptive strategy: if , some iterations are used for exploration; otherwise, for , the rest of the iterations are devoted to exploitation to search for the best solution. In this way, the WOA maintains the smooth transition between exploration and exploitation by adjusting A’s value.
Methodology
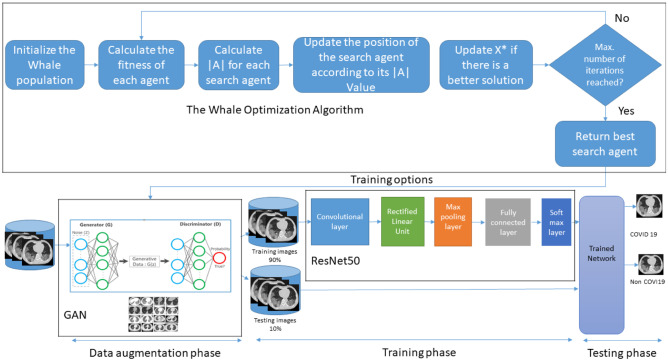
The proposed framework consists of three components: data augmentation using GAN, optimization of the GAN hyperparameters using the WOA, and classification using a pretrained InceptionV3 DL network. Figure 3 illustrates the workflow of the proposed automatic COVID-19 diagnosis system for a limited available training set.
Fig. 3.
Workflow of the proposed methodology
Data Augmentation
The GAN is used in this work for data augmentation since its standard data augmentation techniques help increase the generalizability of large datasets. However, GAN also includes a novel data augmentation technique that can even work with a small dataset. The advantage of data augmentation through the GAN is that it enables practical training even with few input images by generating additional images, which help improve the effectiveness of the training process.
The GAN trains two networks, generator and discriminator, simultaneously. Generator takes a noisy sample from a uniform distribution and generates new data that should be very similar to the true images. Discriminator differentiates between a true COVID-19 image and a generated image and, accordingly, outputs a status of real or fake. In this way, generator and discriminator play an adversarial game by updating the network’s weights and bias every epoch to generate new images that are close to the true images. The GAN network architecture is illustrated in Table 2.
Table 2.
Architecture of the proposed GAN
| Generator network G |
|---|
| Input layer: noise, number of latent inputs = 100 |
| [Layer 1]; fully connect, reshape to (4 × 4 × 512); ReLu |
| [Layer 2]; transposed convolution (4, 4, 256); stride = 2; Batchnorm; ReLu |
| [Layer 3]; transposed convolution (4, 4, 128); stride = 2; Batchnorm; ReLu |
| [Layer 4]; transposed convolution (4, 4, 64); stride = 2; Batchnorm; ReLu |
| [Layer 5]; transposed convolution (4, 4, 3); stride = 2; Tanh |
| Output: generated image (64 × 64 × 3) |
| Discriminator network D |
| Input layer: CT image (64 × 64 × 3) |
| [Layer 1]; convolution layer (5, 5, 64); stride = 2; Batchnorm; LreLu |
| [Layer 2]; convolution layer (5, 5, 128); stride = 2; Batchnorm; LreLu |
| [Layer 3]; convolution layer (5, 5, 256); stride = 2; Batchnorm; LreLu |
| [Layer 4]; convolution layer (5, 5, 512); stride = 2; Batchnorm; LreLu |
| [Layer 5]; convolution layer (4,4,1); stride = 2; Batchnorm; LreLu |
| Output: probability of real or fake |
GAN Optimization
The main issue with training the GAN is that it may suffer from limitations such as mode collapse, vanishing gradients, and instability that depend on the hyperparameters of the GAN. Choosing appropriate hyperparameters is a critical issue that will affect the GAN’s performance. To improve this performance, the WOA is used to optimize the hyperparameters of the GAN in the present work. The humpback whale’s special hunting trick, which optimizes the prey’s location, is adapted in the WOA and used to find generator’s best search agents in the given search space, i.e., discriminator. The optimization of hyperparameters consists of three rules that update the search agents’ positions, described as follows.
Encircling prey (): The leader whale recognizes the position of its prey and encircles it. For generator’s given search agents, update the positions by calculating the fitness function at every iteration to achieve the best position using Eq. (2). Equation (2) updates the position of the search agents in the region near the current best solution .
Spiral updating position (): Here, the distance between the location of generator’s search agents and the prey is calculated, and then, their position is updated using spiral Eq. (2) to imitate the helix-shaped hunting behavior of the whales.
Search for prey (): This rule is almost the same as the encircling prey rule, but the position of the search agents is updated according to random search agent instead of the best search agent according to Eqs. (3) and (4). In the optimization process, after each iteration, the discriminator network is updated to differentiate between the real samples and the fake samples generated by generator according to Eq. (5).
| 5 |
In this way, discriminator provides adaptive losses for updating the generator network’s search agents to produce a better solution.
Classification
After the optimized GAN has generated a sufficient number of images, 70% of the images are used for training, and 30% of the images are used to test the network. An increase in the number of training images using GAN will overcome the overfitting problem for the DL network, which is caused by a limited number of training images. The InceptionV3 DL network is used for training. InceptionV3 consists of convolutional and pooling layers for data preprocessing and complex feature extraction. In InceptionV3, there is no need for any segmentation of the CT images and image preprocessing. This is another main advantage of the proposed network, whose pseudocode is presented in Algorithm (1).
Experiments
The performance of the proposed network is evaluated by using the optimized GAN to generate CT images of COVID-19 and non-COVID-19 patients; experiments are performed to assess the classification performance using different DL networks.
Dataset
Chest CT images of COVID-19 and non-COVID-19 were collected from the SARS-CoV-2 CT-Scan dataset [29]. The dataset consists of 2482 COVID-19 CT scan images, consisting of 1252 COVID-19 and 1230 non-COVID-19 images. The CT scan images of the dataset were collected from Sao Paulo Hospital, Brazil. The dataset is publicly available at “https://www.kaggle.com/plameneduardo/sarscov2-ctscan-dataset”. The details of the images are shown in Table 3.
Table 3.
Details of the dataset
| Dataset | No of images | No of images generated using GAN | Total no. of images used | No. of training images | No. of testing images |
|---|---|---|---|---|---|
| SARS-COV-2 CT-scan [29] | 2482 | 518 | 3000 | 2100 | 900 |
Implementation Details
All experiments are performed on a computer with a 64 GB RAM Nvidia GPU with a Windows 10 Pro operating system using MATLAB 2020a version. It takes 8 h to train the GAN to generate new CT images on a single GPU. The proposed algorithm is evaluated using the publicly available SARS-CoV-2 CT-Scan dataset for both COVID-19 and non-COVID-19 images.
Training
The GAN architecture used for the experiments is illustrated in Table 1, including the generator and discriminator networks. All the true images are resized to 224 × 224 × 3, and the generated images from generator are of the same size. The WOA is used to optimize the hyperparameters of generator to optimize the performance of discriminator.
The Adam training algorithm is used in this work because it is an efficient adaptive stochastic optimization algorithm used in many computer vision and natural language processing applications [30, 31]. Adam’s advantages, such as its computational efficiency, low memory requirements, suitability for large amounts of input data, and appropriateness for noisy inputs, allow it to require little tuning for selecting the hyperparameters [32]. The optimized hyperparameters obtained using the WOA are given in Table 4, and sample training images of COVID-19 and non-COVID-19 patients are provided in Figs. 4 and 5, respectively.
Table 4.
Training parameters for optimized GAN
| Options | Parameters |
|---|---|
| Training algorithm | Adam |
| Adam number of epoch | 2000 |
| Number of iterations for optimization | 20 |
| Number of search agents | 20 |
| Number of dimension | 3 |
| Activation function of discriminator | Sigmoid |
| Batch size | 64 |
| Validation frequency | 1000 |
| Number of generated new images | 300 |
Fig. 4.
Sample COVID-19 training images
Fig. 5.
Sample non-COVID-19 training images
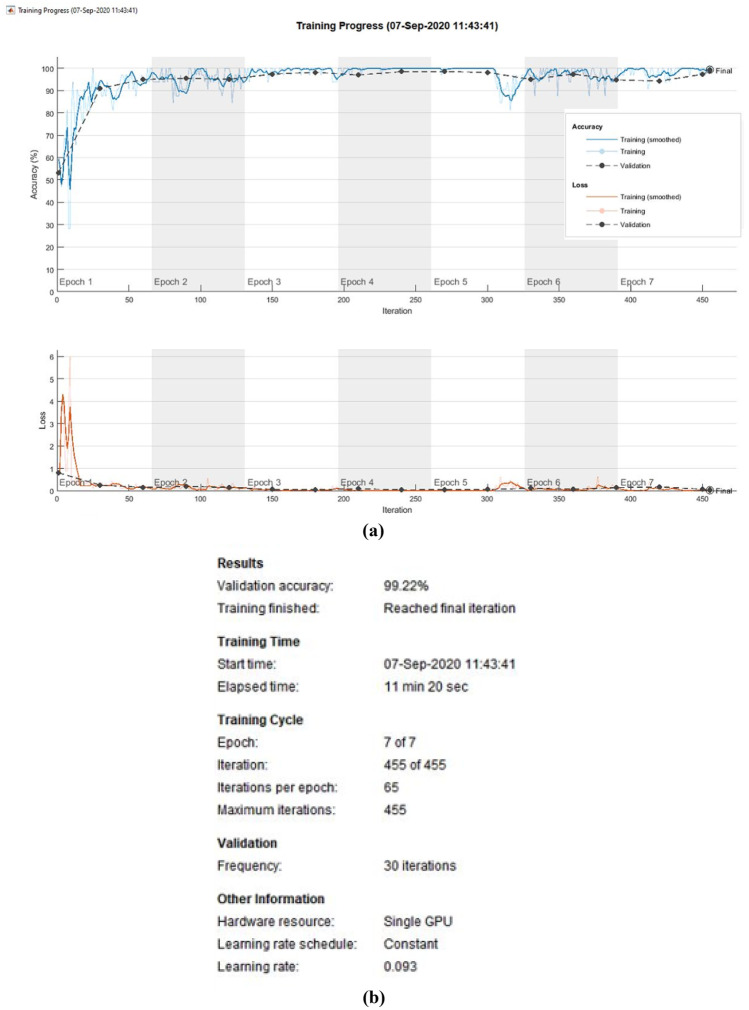
Additionally, 518 new CT images are generated using GAN for both COVID-19 and non-COVID-19 cases. Seventy percent of the data are used to train the InceptionV3 network, and the remaining 30% of the data are used for testing. The training progress of the optimized CNN is shown in Fig. 6a, and results are shown in Fig. 6b. The proposed optimized InceptionV3 network achieves good accuracy and minimum loss in all epochs.
Fig. 6.
Training progress of the InceptionV3 network (a) accuracy and loss (b) results
Testing
First, the images are resized to 224 × 224 × 3 after data augmentation and training the proposed network. After that, the test images are given as input to the trained CNN, where all the parameters of the CLs and FCLs are already optimized. Then, the CNN first extracts the image features and classifies them into the appropriate class using FCL and softmax classifiers. Sample COVID-19 and non-COVID-19 testing images are shown in Figs. 7 and 8, respectively.
Fig. 7.
Sample COVID-19 testing images
Fig. 8.
Sample non-COVID-19 testing images
Performance Indicators and Evaluation Metrics
The main aim of the present work is to diagnose COVID-19 from queried CT images automatically. Therefore, to analyze the proposed algorithm’s performance, sensitivity, specificity, accuracy, F1-score, positive predictive value (PPV), and negative predictive value (NPV) are used as performance metrics; performance is also assessed based on the confusion matrix and receiver-operating characteristic (ROC) curve of the proposed algorithm. Sensitivity evaluates the ability of the algorithm to correctly identify true positive cases of COVID-19, while specificity evaluates the ability to correctly identify true negative cases. Accuracy evaluates the ability of the classifier to differentiate between COVID-19 and non-COVID-19 cases. PPV evaluates how many true positive cases of COVID-19 were classified as positive out of all true positive and false positive cases. NPV evaluates how many true negative cases of COVID-19 were classified as negative out of all false positive and true negative cases. F1-score provides a single score associated with the precision and recall of the algorithm. The confusion matrix shows a summary of the predictions in tabular form. The ROC curves show the performance of the classifier in graphical form. The accuracy, sensitivity, specificity, F1-score, positive predictive value (PPV), and negative predictive value (NPV) performance metrics equations are represented in Eqs. (6), (7), (8), (9), (10), and (11), respectively where TP indicates the true positive, TN indicates the true negative, FP indicates the false positive, and FN indicates the false negative.
| 6 |
| 7 |
| 8 |
| 9 |
| 10 |
| 11 |
Experimental Results
The proposed network efficiency is validated for the automatic diagnosis of COVID-19 from CT scan images; a comparative analysis is performed for three different scenarios described as follows.
Optimized GAN
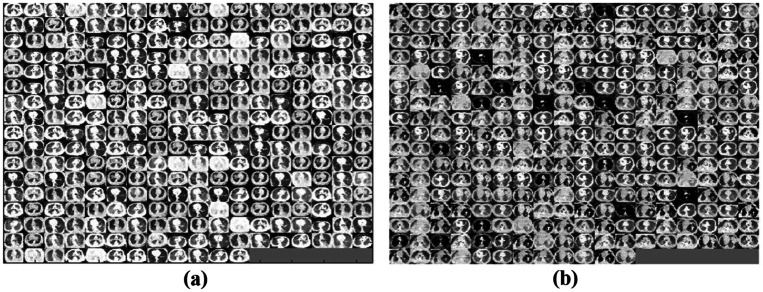
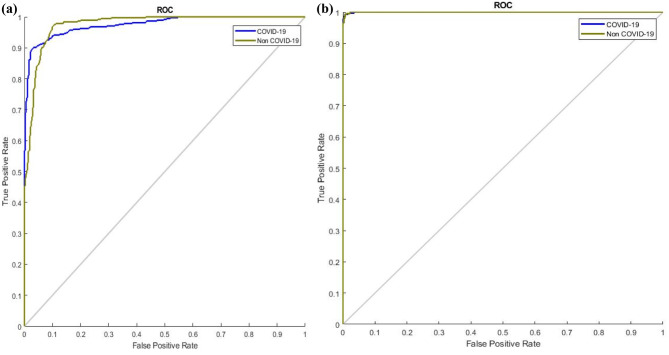
The proposed network helps diagnose COVID-19 from CT images automatically using DL networks with high sensitivity and specificity. It can therefore help radiologists perform initial screenings for a large population. Additionally, it is a noninvasive method of diagnosis that produces results on the order of seconds. However, the main disadvantage of CT scans is the limited number of images available, which is often not sufficient to train the DL networks. Therefore, a GAN is used to generate new CT images for both COVID-19 and non-COVID-19 cases. Initially, 2482 CT images were available encompassing both COVID-19 and non-COVID-19 images; after using GAN, 518 additional images are generated. Now, a total of 3000 CT images are available to train the DL networks. Additionally, the hyperparameters of the generator network of the GAN are optimized using the WOA to improve the performance of the discriminator. Figure 9 shows the COVID-19 (Fig. 9a) and non-COVID-19 (Fig. 9b) images generated using the optimized GAN. Table 5 shows a comparison of the DL network’s performance with optimized and non-optimized data augmentation, which clearly shows the advantage of the proposed network. Figures 10 and 11 show a performance comparison in terms of ROC curves and the confusion matrixes of the non-optimized and optimized GAN. From Figs. 10 and 11, the optimized GAN produced better results than the non-optimized GAN. The total number of testing images is not equal in Fig. 11 because Fig. 11b shows the confusion matrix of the optimized GAN, which includes a greater number of generated images. On the other hand, Fig. 11a depicts the confusion matrix of the non-optimized GAN, which includes fewer generated images than the optimized GAN.
Fig. 9.
CT images generated using the optimized-GAN (a) COVID-19 and (b) non-COVID-19
Table 5.
Comparison of performance metrics of optimized and non-optimized GAN
| Method | Accuracy (%) | Sensitivity (%) | Specificity (%) | F1 score (%) | PPV (%) | NPV (%) |
|---|---|---|---|---|---|---|
| COVID-19 non-optimized GAN | 91.60 | 84.80 | 98.40 | 90.99 | 84.8 | 98.4 |
| COVID-19 optimized GAN | 98.78 | 99.78 | 97.78 | 98.79 | 97.82 | 99.77 |
Fig. 10.
Comparison of ROC curves (a) non-optimized GAN and (b) optimized GAN
Fig. 11.
Comparison of confusion matrixes (a) non-optimized GAN and (b) optimized GAN
Performance Analysis with Other DL Networks
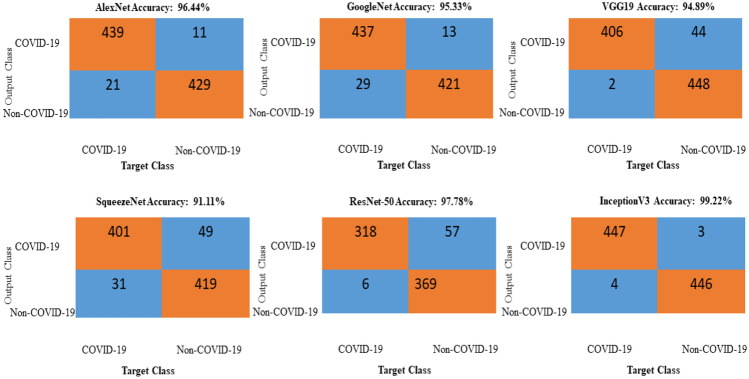
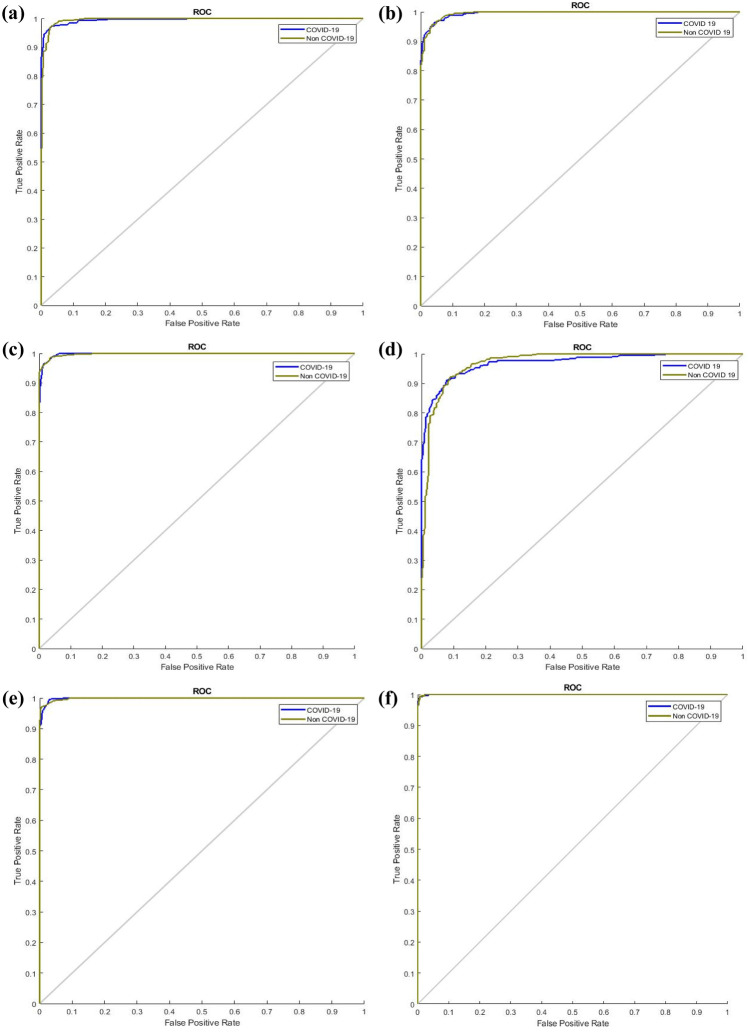
The newly generated CT images are included in the classification. In this work, six standard DL networks are used for image classification: AlexNet, GoogleNet, SqueezeNet, VGG19, ResNet-50, and InceptionV3. Seventy percent of the data are used for training the DL networks, and the remaining 30% of the data are used for testing. A comparison of all the networks is performed using the performance metrics of accuracy, specificity, sensitivity, F1-score, PPV, and NPV and is shown in Table 6. Comparisons in terms of the ROC curves and confusion matrixes are illustrated in Figs. 12 and 13. These comparisons indicate that the optimized GAN-based InceptionV3 gives the best accuracy. Therefore, this network can be used to diagnose COVID-19 in real-time applications.
Table 6.
Performance analysis with other DL networks
| Method | Accuracy (%) | Sensitivity (%) | Specificity (%) | F1 score (%) | PPV (%) | NPV (%) |
|---|---|---|---|---|---|---|
| AlexNet | 96.44 | 97.56 | 95.33 | 96.48 | 95.43 | 97.50 |
| GoogleNet | 95.33 | 97.11 | 93.56 | 95.41 | 93.78 | 97.00 |
| VGG19 | 94.89 | 90.22 | 99.56 | 94.64 | 99.51 | 91.06 |
| SqueezeNet | 91.11 | 89.11 | 93.11 | 90.93 | 92.82 | 89.53 |
| ResNet50 | 97.78 | 97.56 | 98.00 | 97.77 | 97.99 | 97.57 |
| InceptionV3 | 99.22 | 99.78 | 97.78 | 98.79 | 97.82 | 99.77 |
Fig. 12.
Comparison of the confusion matrixes
Fig. 13.
Comparison of the ROC curves (a) AlexNet, (b) GoogleNet, (c) VGG19, (d) SqueezeNet, (e) ResNet-50, (f) InceptionV3
Performance Analysis with Other Meta-Heuristics Algorithm
In this study, five standard optimization techniques in addition to the proposed WOA are used to classify the images: genetic algorithm (GA) [33], pattern search (PS) [34], particle swarm optimization (PSO) [35], simulated annealing (SA) [36], and Grey Wolf Optimization (GWO) [37]. For training the DL networks, 70% of the data are used; the remaining 30% of the data are used for testing. A comparison of all these networks in terms of the accuracy, specificity, sensitivity, F1-score, PPV, and NPV is given in Table 7. The results of these comparisons indicate that the CNN optimized by the WOA provides the best results. Therefore, the proposed network can be reliably used to diagnose COVID-19 in real-time applications.
Table 7.
Comparative analysis with other meta-heuristics algorithm
| Method | Accuracy (%) | Sensitivity (%) | Specificity (%) | F1 score (%) | PPV (%) | NPV (%) |
|---|---|---|---|---|---|---|
| GA | 96.22 | 97.56 | 96.89 | 97.23 | 96.91 | 97.54 |
| PS | 93.22 | 90.78 | 94.67 | 92.03 | 94.39 | 90.25 |
| PSO | 97.44 | 96.89 | 98.00 | 97.43 | 97.98 | 96.92 |
| SA | 97.11 | 76.67 | 97.56 | 97.10 | 97.53 | 96.70 |
| GWO | 96.44 | 97.11 | 95.78 | 96.47 | 95.83 | 97.07 |
| Proposed optimization | 99.22 | 99.78 | 97.78 | 98.79 | 97.82 | 99.77 |
Comparative Analysis
For further analysis of the results, the performance metrics of our pretrained deep-learning network, including the accuracy, sensitivity, specificity, precision, and F1-score, are compared with those of other state-of-the-art methods. The acquired performance parameters of our proposed method are better than those of the other approaches, as summarized in Table 8. The main advantage of the proposed approach is that no tuning is required for different databases, which is dissimilar to the model-based methodologies described in [8, 12, 19, 22, 39]. In this way, the proposed approach can successfully deal with any concealed databases with no particular parameter tuning. The authors of [24, 27] and [38] achieved marginally acceptable accuracy, but the sensitivity and specificity values were less than those of the proposed method because of the absence of basic imaging data. Likewise, the accuracy and F1-score of the proposed strategy are contrasted with those of cutting-edge strategies. By and large, the proposed method yields better results than other cutting-edge techniques.
Table 8.
Comparison of the results with state of the art DL networks with CT images
| Reference | Methods | Accuracy (%) | Sensitivity (%) | Specificity (%) | F1 score (%) | PPV (%) | NPV (%) |
|---|---|---|---|---|---|---|---|
| [8] | ResNet-50 | - | 90 | 96 | - | - | - |
| [12] | CGAN | 82.91 | - | - | - | - | - |
| [18] | Ensemble CNN | 86 | - | - | 86.7 | - | - |
| [19] | CNN-Resnet-18 | 86.7 | - | - | - | - | - |
| [22] | CNN-Ensemble | - | - | - | 92.2 | - | |
| [24] | DL | 90.8 | 84 | 93 | - | - | - |
| [27] | CNN | - | 98.2 | 92.2 | - | - | - |
| [38] | CNN | 94.98 | 94.06 | 95.47 | - | - | - |
| [39] | CNN-Resnet-50 | - | 93 | - | - | - | - |
| Proposed | Optimized GAN based InceptionV3 | 99.22 | 99.78 | 97.78 | 98.79 | 97.82 | 99.77 |
Cross-Validation
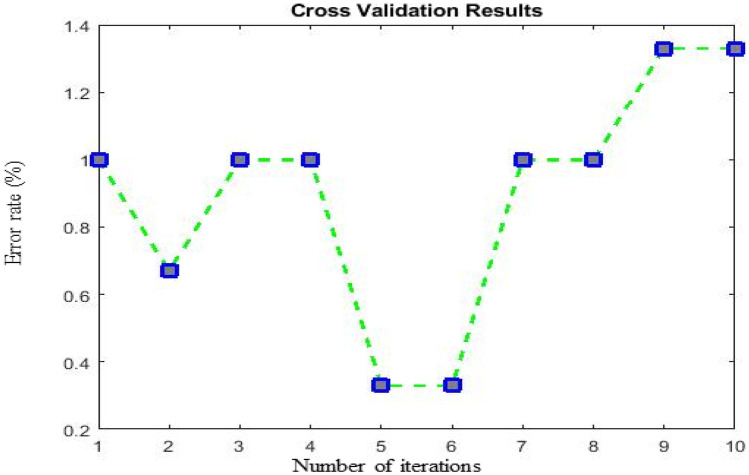
Cross-validation (CV) is an essential tool for predicting network performance by splitting the data k times into training and testing sets. In the present work, to validate the performance of the proposed work over 10 iterations, the value of k is set to 10. Therefore, the CT data for both classes are split into ten subsets. For every iteration, one subset from the k subsets is used for testing, and the remaining k-1 subsets are used for training the network. Then, the error rate is calculated k times for the proposed optimized GAN ResNet-50 network. The cross-validation results are shown in Fig. 14.
Fig. 14.
Cross-validation results
Discussion
This paper’s primary goal was to produce additional CT images to screen COVID-19 to overcome the limitations of a small dataset for training a DL network; a total of 3000 CT images are ultimately used in this study. The parameters used to train the GAN are given in Table 4, and the hyperparameters of the GAN are optimized by using the WOA. Table 5 shows a comparison of the performance results using both optimized and non-optimized GAN. The performance metrics of the proposed method, including accuracy, sensitivity, specificity, F1-score, PPV, and NPV, are compared with those of other pretrained networks, such as AlexNet, GoogleNet, VGG19, SqueezeNet, ResNet-50, and InceptionV3. Accuracy is the essential metric for assessing the overall classification performance. Sensitivity is used to assess the ability to correctly identify COVID-19 cases.
Consequently, it recognizes patients who actually have COVID-19. Specificity assesses the ability to correctly identify non-COVID-19 cases. In this manner, this metric distinguishes patients who do not have COVID-19. Precision is a measure of the proportion of correctly identified COVID-19 cases out of all initially suspected cases. F1-score, PPV, and NPV are essential measures that can provide additional details of the classifications, mainly when the data consist of imbalanced classes. The F1-score computes the weighted harmonic mean of precision and recall. Tables 7 and 8 show an analysis of the performance metrics between the proposed method and other competitive methods. It can be plainly seen that the proposed approach achieves better performance than the other methods.
Conclusions
In the current COVID-19 pandemic, automatic diagnosis using CT images has become useful for patient care and preventing further spread of the virus. The limited dataset available for CT images is the primary motivation for using GAN to generate new chest CT images for COVID-19. However, the training of the GAN suffers from some difficulties, such as vanishing gradients, mode collapse, and instability. To resolve these issues, the hyperparameters of GAN were optimized using the WOA proposed in this paper. A total of 518 COVID-19 and non-COVID-19 CT images were generated. The experimental results show that compared with other state-of-the-art DL networks, the best accuracy is achieved using the InceptionV3 DL network in diagnosing COVID-19 from chest CT images.
Acknowledgments
The authors acknowledge the authors of COVID-CT, SARS-COV-2 CT-Scan datasets for making publicly available online. The authors also acknowledge the medical imaging laboratory of Computer Science and Engineering Department, National Institute of Technology Silchar, Assam, for providing the necessary facilities to carry out this work.
Code Availability
The developed source code of this work is publicly available at https://github.com/biomedicallabecenitsilchar/optgan
Compliance with Ethical Standards
Conflict of Interest
The authors declare that they have no conflict of interest.
Ethical Standard
This article does not contain any studies with human participants performed by any of the authors. This article does not contain any studies with animals performed by any of the authors. This article does not contain any studies with human participants or animals performed by any of the authors.
Informed Consent
There is no individual participant included in the study.
Contributor Information
R. Murugan, Email: murugan.rmn@ece.nits.ac.in, Email: murugan.rmn@gmail.com
Seyedali Mirjalili, https://seyedalimirjalili.com.
References
- 1.Liang T. Handbook of COVID-19 prevention and treatment. The First Affiliated Hospital: Zhejiang University School of Medicine. Compiled According to Clinical Experience; 2020. [Google Scholar]
- 2.World Health Organization. Considerations for quarantine of individuals in the context of containment for coronavirus disease (COVID-19): interim guidance, 2020.
- 3.Razai MS, Doerholt K, Ladhani S, Oakeshott P. Coronavirus disease 2019 (covid-19): a guide for UK GPs. BMJ. 2020;6:368. doi: 10.1136/bmj.m800. [DOI] [PubMed] [Google Scholar]
- 4.Bai Y, Yao L, Wei T, Tian F, Jin DY, Chen L, Wang M, et al. Presumed asymptomatic carrier transmission of COVID-19. JAMA. 2020;14:1406–1407. doi: 10.1001/jama.2020.2565. [DOI] [PMC free article] [PubMed] [Google Scholar]
- 5.Liu H, Liu F, Li J, Zhang T, Wang D, Lan W, et al. Clinical and CT imaging features of the COVID-19 pneumonia: Focus on pregnant women and children. J Infect. 2020. [DOI] [PMC free article] [PubMed]
- 6.Hassantabar S, Ahmadi M, Sharifi A. Diagnosis and detection of infected tissue of COVID-19 patients based on lung X-ray image using convolutional neural network approaches. Chaos, Solitons Fractals. 2020;29:110170. doi: 10.1016/j.chaos.2020.110170. [DOI] [PMC free article] [PubMed] [Google Scholar]
- 7.Ardakani AA, Kanafi AR, Acharya UR, Khadem N, Mohammadi A. Application of deep learning technique to manage COVID-19 in routine clinical practice using CT images: results of 10 convolutional neural networks. Comput Biol Med. 2020;30:103795. doi: 10.1016/j.compbiomed.2020.103795. [DOI] [PMC free article] [PubMed] [Google Scholar]
- 8.Li L, Qin L, Xu Z, Yin Y, Wang X, Kong B, Bai J, Lu Y, Fang Z, Song Q, Cao K, et al. Artificial intelligence distinguishes COVID-19 from community acquired pneumonia on chest CT. Radiology. 2020;19:200905. doi: 10.1148/radiol.2020200905. [DOI] [PMC free article] [PubMed] [Google Scholar]
- 9.Zhavoronkov A, Zagribelnyy B, Zhebrak A, Aladinskiy V, Terentiev V, Vanhaelen Q, Bezrukov DS, Polykovskiy D, Shayakhmetov R, Filimonov A, Bishop M, et al. Potential non-covalent SARS-CoV-2 3C-like protease inhibitors designed using generative deep learning approaches and reviewed by human medicinal chemist in virtual reality. chemrxiv preprint 2020.
- 10.Ahuja S, Panigrahi BK, Dey N, Rajinikanth V, Gandhi TK. Deep transfer learning-based automated detection of COVID-19 from lung CT scan slices. Techrxiv preprint 2020. [DOI] [PMC free article] [PubMed]
- 11.Loey M, Smarandache F, M Khalifa NE. Within the Lack of Chest COVID-19 X-ray Dataset: A Novel Detection Model Based on GAN and Deep Transfer Learning. Symmetry. 2020; 12(4):651.
- 12.Loey M, Manogaran G, Khalifa NE. A deep transfer learning model with classical data augmentation and CGAN to detect covid-19 from chest CT radiography digital images. Preprint 2020. [DOI] [PMC free article] [PubMed]
- 13.Dai WC, Zhang HW, Yu J, Xu HJ, Chen H, Luo SP, Zhang H, Liang LH, Wu XL, Lei Y, Lin F, et al. CT imaging and differential diagnosis of COVID-19. Can Assoc Radiol J. 2020;71(2):195–200. doi: 10.1177/0846537120913033. [DOI] [PMC free article] [PubMed] [Google Scholar]
- 14.Hani C, Trieu NH, Saab I, Dangeard S, Bennani S, Chassagnon G, Revel MP, et al. COVID-19 pneumonia: a review of typical CT findings and differential diagnosis. Diagn Interv Imaging. 2020. [DOI] [PMC free article] [PubMed]
- 15.Salehi S, Abedi A, Balakrishnan S, Gholamrezanezhad A. Coronavirus disease 2019 (COVID-19) imaging reporting and data system (COVID-RADS) and common lexicon: a proposal based on the imaging data of 37 studies. Eur Radiol. 2020. [DOI] [PMC free article] [PubMed]
- 16.Wei J, Xu H, Xiong J, Shen Q, Fan B, Ye C, Dong W, Hu F, et al. 2019 novel coronavirus (COVID-19) pneumonia: serial computed tomography findings. Korean J Radiol. 2020;21(4):501–504. doi: 10.3348/kjr.2020.0112. [DOI] [PMC free article] [PubMed] [Google Scholar]
- 17.Wang Y, Dong C, Hu Y, Li C, Ren Q, Zhang X, Shi H, Zhou M, et al. Temporal changes of CT findings in 90 patients with COVID-19 pneumonia: a longitudinal study. Radiology. 2020;19:200843. doi: 10.1148/radiol.2020200843. [DOI] [PMC free article] [PubMed] [Google Scholar]
- 18.Mishra AK, Das SK, Roy P, Bandyopadhyay S. Identifying COVID19 from Chest CT Images: A Deep Convolutional Neural Networks Based Approach. J Healthc Eng. 2020; 8843664. 10.1155/2020/8843664. [DOI] [PMC free article] [PubMed]
- 19.Xu X, Jiang X, Ma C, Du P, Li X, Lv S, Yu L, Ni Q, Chen Y, Su J, Lang G, et al. A deep learning system to screen novel coronavirus disease 2019 pneumonia. Engineering. 2020. 10.1016/j.eng.2020.04.010. [DOI] [PMC free article] [PubMed]
- 20.Shan F, Gao Y, Wang J, Shi W, Shi N, Han M, Xue Z, Shi Y, et al. Lung infection quantification of covid-19 in CT images with deep learning. arXiv preprint 2020.
- 21.Huang L, Han R, Ai T, Yu P, Kang H, Tao Q, Xia L, et al. Serial quantitative chest CT assessment of covid-19: Deep-learning approach. Radiology: Cardiothoracic Imaging. 2020; 2(2):e200075. [DOI] [PMC free article] [PubMed]
- 22.Harmon SA, Sanford TH, Xu S, Turkbey EB, Roth H, Xu Z, Yang D, Myronenko A, Anderson V, Amalou A, Blain M, et al. Artificial intelligence for the detection of COVID-19 pneumonia on chest CT using multinational datasets. Nature Communications. 2020; 14;11(1):1–7. [DOI] [PMC free article] [PubMed]
- 23.Mei X, Lee HC, Diao KY, Huang M, Lin B, Liu C, Xie Z, Ma Y, Robson PM, Chung M, Bernheim A, et al. Artificial intelligence–enabled rapid diagnosis of patients with COVID-19. Nat Med. 2020;19:1–5. doi: 10.1038/s41591-020-0931-3. [DOI] [PMC free article] [PubMed] [Google Scholar]
- 24.Maghdid HS, Asaad AT, Ghafoor KZ, Sadiq AS, Khan MK. Diagnosing COVID-19 pneumonia from X-ray and CT images using deep learning and transfer learning algorithms. arXiv preprint
- 25.Deep transfer learning-based automated detection of COVID-19 from lung CT scan slices. Appl Intell. 2020. 10.1007/s10489-020-01826-w. [DOI] [PMC free article] [PubMed]
- 26.Wang S, Zha Y, Li W, Wu Q, Li X, Niu M, Wang M, Qiu X, Li H, Yu H, Gong W, et al. A fully automatic deep learning system for COVID-19 diagnostic and prognostic analysis. Eur Respir J. 2020. [DOI] [PMC free article] [PubMed]
- 27.Butt C, Gill J, Chun D, Babu BA. Deep learning system to screen coronavirus disease 2019 pneumonia. Applied Intelligence. 2020. [DOI] [PMC free article] [PubMed]
- 28.Mirjalili S, Lewis A. The whale optimization algorithm. Adv Eng Softw. 2016;95:51–67. doi: 10.1016/j.advengsoft.2016.01.008. [DOI] [Google Scholar]
- 29.Soares E, Angelov P, Biaso S, Higa FM, Kanda AD. "SARS-CoV-2 CT-scan dataset: A large dataset of real patients CT scans for SARS-CoV-2 identification." medRxiv 2020. 10.1101/2020.04.24.20078584.
- 30.Ali MN, Sarowar MG, Rahman ML, Chaki J, Dey N, Tavares JM, et al. Adam deep learning with SOM for human sentiment classification. IJACI. 2019; 1;10(3):92–116.
- 31.Paszke A, Gross S, Massa F, Lerer A, Bradbury J, Chanan G, Killeen T, Lin Z, Gimelshein N, Antiga L, Desmaison A, et al. Pytorch: An imperative style, high-performance deep learning library. In Advances in neural information processing systems. 2019; 8026–8037.
- 32.Duchi J, Hazan E, Singer Y. Adaptive subgradient methods for online learning and stochastic optimization. J Mach Learn Res. 2011; 1;12(7).
- 33.Holland JH. Genetic algorithms. Sci Am. 1992;267(1):66–72. doi: 10.1038/scientificamerican0792-66. [DOI] [Google Scholar]
- 34.Hooke R. Jeeves TA Direct search solution of numerical and statistical problems. J ACM. 1961;8(2):212–229. doi: 10.1145/321062.321069. [DOI] [Google Scholar]
- 35.Kennedy J, Eberhart R. Particle swarm optimization. In: Proceedings of the IEEE international conference on neural networks 1995; 1942–1948.
- 36.Van Laarhoven PJ, Aarts EH. Simulated annealing. In simulated annealing: Theory and applications, Mathematics and its applications. Reidel, 1987; 7–15.
- 37.Mirjalili S, Mirjalili SM, Lewis A. Grey wolf optimizer. Adv Eng Softw. 2014;69:46–61. doi: 10.1016/j.advengsoft.2013.12.007. [DOI] [Google Scholar]
- 38.Jin YH, Cai L, Cheng ZS, Cheng H, Deng T, Fan YP, Fang C, Huang D, Huang LQ, Huang Q, Han Y, et al. A rapid advice guideline for the diagnosis and treatment of 2019 novel coronavirus (2019-nCoV) infected pneumonia (standard version) Military Medical Research. 2020;7(1):1–4. doi: 10.1186/s40779-019-0229-2. [DOI] [PMC free article] [PubMed] [Google Scholar]
- 39.Song Y, Zheng S, Li L, Zhang X, Zhang X, Huang Z, Chen J, Zhao H, Jie Y, Wang R, Chong Y, et al. Deep learning enables accurate diagnosis of novel coronavirus (COVID-19) with CT images. medRxiv. 2020. [DOI] [PMC free article] [PubMed]
Associated Data
This section collects any data citations, data availability statements, or supplementary materials included in this article.
Data Availability Statement
The developed source code of this work is publicly available at https://github.com/biomedicallabecenitsilchar/optgan


