

Summary
The discovery of potent cell-permeable E3 ubiquitin ligase ligands can significantly facilitate the development of proteolysis targeting chimeras (PROTACs). Here, we present a protocol to determine the binding affinity of ligands toward CRBN E3 ubiquitin ligase, using a cellular target engagement mechanism and in-cell ELISA assay. This protocol is easy to establish, with relatively low cost and rapid time frame. It can also be modified to measure the level of other proteins or determine the ligand affinity toward other E3s.
For complete details on the use and execution of this protocol, please refer to Yang et al. (2020).
Subject areas: Cell-based assays, Molecular/chemical probes, Protein biochemistry
Graphical Abstract
Highlights
-
•
In-cell assay to assess the binding affinity of CRBN E3 ligands
-
•
Easy to establish, low cost, and rapid time frame
-
•
Can be extended to other E3-ligase systems
The discovery of potent cell-permeable E3 ubiquitin ligase ligands can significantly facilitate the development of proteolysis targeting chimeras (PROTACs). Here, we present a protocol to determine the binding affinity of ligands toward CRBN E3 ubiquitin ligase, using a cellular target engagement mechanism and in-cell ELISA assay. This protocol is easy to establish, with relatively low cost and rapid time frame. It can also be modified to measure the level of other proteins or determine the ligand affinity toward other E3s.
Before you begin
Prepare cells, compounds, and buffers
Timing: 1–2 h
-
1.Cell culture.
-
a.Culture MM1S cells in RPMI-1640 medium supplemented with 10% fetal bovine serum (FBS), 1% sodium pyruvate, and 1% penicillin/streptomycin, 10 mM HEPES.
-
b.Tissue-culture (TC) treated T175 flasks or 150-cm dishes are used.
-
c.Cells are cultured in a cell-culture incubator at 37°C with 5% CO2.Note: MM1S cells grow much slower if they are split too diluted (e.g., less than 30% confluency). In general cell passaging, we recommend 1:2 or 1:3 split to keep their confluency more than 30%. The MM1S cells are recommended to be used within 10 passages.
-
d.Make sure cells are ≥90% confluency and ready to use.
-
a.
-
2.Compounds stock solution
-
a.For all commercial and synthesized compounds, perform purity analysis by LC-MS and NMR to make sure purity is ≥95%
-
b.Prepare compound(s) stock solution in preferred solvent (e.g., DMSO) at 10 mM or higher.Note: If one or more compound(s) have solubility problem, we recommend preparing compounds in other solvent or preparing lower concentration stock.
-
c.Store stock solution at −20°C for long-term (≥1 month) use and store an aliquot at 4°C for short-term (1–4 weeks) use.
-
a.
-
3.
Prepare buffers and solutions according to the table in Materials and equipment section
Key resources table
| REAGENT or RESOURCE | SOURCE | IDENTIFIER |
|---|---|---|
| Antibodies | ||
| HDAC6 (D2E5) rabbit mAb | Cell Signaling Technology | Cat# 7558; RRID: AB_10891804 |
| Ikaros (D6N9Y) (IKZF1) rabbit mAb | Cell Signaling Technology | Cat# 14859s; RRID: AB_2744523 |
| Aiolos (D1C1E) (IKZF3) rabbit mAb | Cell Signaling Technology | Cat# 15103s; RRID: AB_2744524 |
| Anti-rabbit IgG, HRP-linked antibody | Cell Signaling Technology | Cat# #7074; RRID: AB_2099233 |
| Chemicals, peptides, and recombinant proteins | ||
| RPMI-1640 medium | Corning | Cat# 10-040-cv |
| Fetal bovine serum (FBS), heat inactivated | VWR | Cat# 97068-091 |
| Sodium pyruvate solution (100 mM) | Gibco | Cat# 11360070 |
| Penicillin/streptomycin solution (100×) | Gibco | Cat# 15140122 |
| HEPES solution (1 M) | Gibco | Cat# 15630080 |
| 10× Phosphate-buffered saline (PBS) | Dot Scientific | Cat# DSP32060 |
| 10× Tris-buffered saline (TBS) | Dot Scientific | Cat# DST60075 |
| Bovine serum albumin (BSA) | CHEM-IMPLEX | Cat# 00039 |
| Formaldehyde solution (37 wt% in H2O) | Sigma-Aldrich | Cat# 252549; CAS: 50-00-0 |
| Tween-20 | Sigma-Aldrich | Cat# P7949; CAS: 9005-64-5 |
| Hydrogen peroxide solution (H2O2, 30 wt% in H2O) | Sigma-Aldrich | Cat# 216763; CAS: 7722-84-1 |
| Triton X-100 | Sigma-Aldrich | Cat# T9284; CAS: 9002-93-1 |
| Albumin fraction V (from bovine blood) (BSA) | Chem-Impex | Cat# 00039; CAS: 9048-46-8 |
| Sodium azide (NaN3) | Sigma-Aldrich | Cat# S2002; CAS: 26628-22-8 |
| Sulfuric acid (H2SO4) | Sigma-Aldrich | Cat# 258105; CAS:7664-93-9 |
| Thalidomide | Selleckchem | Cat# S1193; CAS: 50-35-1 |
| Lenalidomide | Selleckchem | Cat# S1029; CAS: 191732-72-6 |
| Pomalidomide | Selleckchem | Cat# S1567; CAS: 19171-19-8 |
| TMB Substrate Set | BioLegend | Cat# 421101 |
| Janus green B | Sigma-Aldrich | Cat# 201677; CAS: 2869-83-2 |
| WH181 | Wu et al., 2019 | Available upon request when there is enough stock |
| Experimental models: cell lines | ||
| MM1S | ATCC | ATCC CRL-2974 |
| Jurkat, clone E6-1 | ATCC | ATCC TIB-152 |
| MCF-7 | ATCC | ATCC HTB-22 |
| Software and algorithms | ||
| GraphPad Prism 8 | GraphPad Software | https://www.graphpad.com/scientific-software/prism/ |
| Other | ||
| 96-well clear flat bottom TC-treated culture microplate | Falcon | Cat# 353072 |
| T175 cell culture flask | Falcon | Cat# 353112 |
| 150-cm cell culture dish | Thermo Scientific | Cat# 157150 |
| MTS 2/4 digital microtiter shaker | IKA | Cat# 0003208001 |
| FLUOstar Omega microplate reader | BMG LABTECH | N/A |
| 10-mL serological pipette | VWR | Cat# 75816-100 |
Materials and equipment
CRITICAL: Essential equipment or instrument needed in this protocol includes but not limited to: (1) multichannel pipette or liquid dispenser for handling solution in multiple-well plate; (2) orbital plate shaker (e.g., IKA MTS 2/4 digital microtiter shaker, ID # 0003208001) for application at temperature ranging from 0 to 23°C; (3) vacuum for removal of solutions; (4) plate reader (e.g., BMG LABTECH FLUOstar Omega microplate reader) capable to read optical density. The cell culture plate is the key platform to perform cell seeding, drug treatment, and in-cell ELISA assay. Tissue-culture (TC) treated 96-well plate is recommended. We have used Falcon 96-well Clear Flat Bottom TC-treated Culture Microplate (with lid, individually wrapped, sterile, cat # 353072) and it works well for this type of assay.
Buffers and solutions
| Name | Recipe | Storagea |
|---|---|---|
| Phosphate-buffered saline (PBS), 10× and 1× | 10× solution is commercially available, refer to Key resources table, diluted to 1× in H2O with or without additives | Store at r.t., good for over 1 year |
| Tris-buffered saline (TBS), 10× and 1× | 10× solution is commercially available, refer to Key resources table, diluted to 1× in H2O with or without additives | Store at r.t., good for over 1 year |
| Washing buffer (TBS-T) | 0.1% Tween-20 in TBS | Store at r.t., good for 2 months |
| Fixation solution (2×) | 8% formaldehyde in TBS or PBS | Store at 4°C, good for 3 months |
| Fixation solution (1×) | 4% formaldehyde in TBS or PBS | Store at 4°C, good for 3 months |
| Permeabilization solution | 0.1% Triton X-100 in TBS | Store at 4°C, good for 3 months |
| Quenching solution | 1% H2O2 in TBS | Freshly made |
| Sodium azide solution | 10% sodium azide | Freshly made |
| Antibody buffer 2 | 1% BSA in TBS-T | Store at 4°C, good for 1 month |
| Primary antibody solution | HDAC6 (D2E5) Rabbit mAb 1:1,000 dilution in antibody buffer 1 | Freshly made |
| Secondary antibody solution | Anti-rabbit IgG (HRP-linked) antibody 1:2,000 dilution in antibody buffer 1 | Freshly made |
| TMB substrate mixtures | 1:1 mixture of TMB substrate A and B in the set | Freshly made |
| Stop solution | 2 N H2SO4 | Store at r.t. , good for 1 year |
| Staining solution | 0.3% Janus green B in TBS | Store at r.t., good for 1 year |
| Equilibrating solution | 140 mM NaCl | Store at r.t., good for 1 year |
r.t. stands for room temperature ranging from 20°C to 23°C.
Antibody buffer 1
| Reagent | Final concentration | Amount |
|---|---|---|
| BSA | 5% | 5 g |
| Sodium azide solution (10%) | 0.02% | 0.2 mL |
| Washing buffer (TBS-T) | Base buffer | 100 mL |
Store at 4°C. Good for 3 months.
Solubilization solution
| Reagent | Final concentration | Amount |
|---|---|---|
| NaCl | 140 mM | 163.6 mg |
| 12 N HCl | 0.5 M | 0.8 mL |
| H2O | Base buffer | 19.2 mL |
Freshly made before experiment.
Alternatives: 2 N HCl can be used as an alternative stop solution without affecting the final result.
Step-by-step method details
Seed cells
This section aims to harvest cells and plate them for compound treatment.
-
1.
Use serological pipette or alternatives to resuspend MM1S cells thoroughly.
-
2.
Transfer the cell suspension to a 15 mL conical tube and centrifuge at 300 × g for 5 min at room temperature ranging from 20°C to 23°C.
-
3.
Remove culture medium and resuspend cells in cell culture medium thoroughly.
-
4.
Take cell solution for cell counting by either hemocytometer or automated cell counting instrument.
-
5.
Dilute cell solution to 5 × 10⁵ cells/mL.
-
6.
Use multiple-channel pipette or alternatives to evenly distribute 100 μL diluted cell solution to 96-well plate, result in 5 × 10⁴ cells per well.
-
7.
Seed cells in incubator 12–18 h.
Treat the cells with compounds
This section aims to harvest cells and plate them for compound treatment.
-
8.
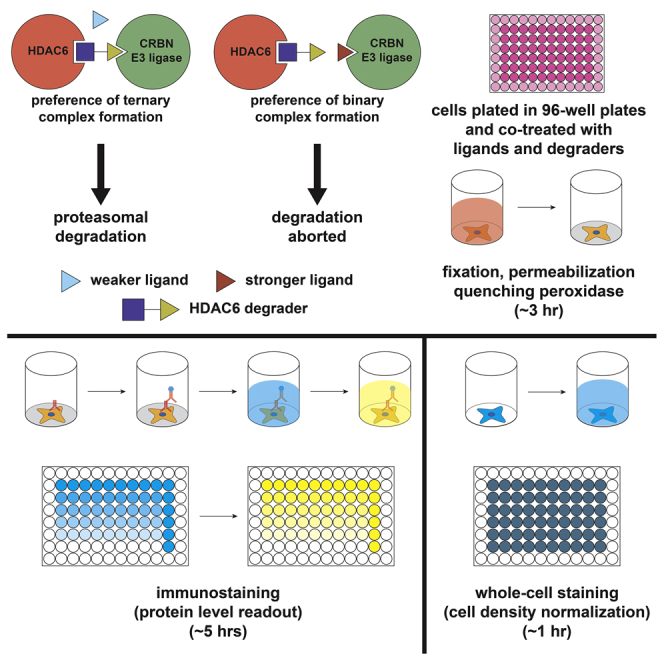
Dose cells with 25 μL 18 μM ligands (6× dose) or vehicle in culture medium (Figure 1D).
Note: The concentration of ligand will eventually be at 3 μM after the addition of dose medium containing degrader. The final concentration has been optimized based on pomalidomide, which restored ~50% of histone deacetylase 6 (HDAC6) degradation by degrader WH181. (Wu et al., 2019; Yang et al., 2020)
Note: Here, we mainly report fixed final concentration at 3 μM for evaluating the cellular affinity of compounds library in comparison of pomalidomide, the positive standard. Comparison between limited number of compounds with more concentration is also applicable by using this type of assay. See Figures 2B and 4C in our previous publication (Wu et al., 2019; Yang et al., 2020) for examples.
Note: Prepare ligand, degrader, and vehicle solution by directly diluting the stock solution in cell culture medium. If further dilutions are needed, prepare dilution by adding concentrated dose solution to vehicle solution. For example, add 1 μL 10 mM pomalidomide stock (in DMSO) into 555.6 μL cell culture medium as highest dose solution. Add 2 μL in DMSO into 1,111.1 μL cell culture medium as vehicle solution. Add 100 μL of highest dose solution to 200 μL vehicle solution to make 1:3 dilution. Repeat this dilution if needed.
-
9.
Incubate the cells for 1 h at 37°C with 5% CO2.
-
10.
Dose with 25 μL 600 nM degrader WH181 (6× dose) or vehicle in culture medium.
Note: The final concentration of degrader will be 100 nM. WH181 (original compound number 12d) is a potent HDAC6 degrader with DC50 at 1.6 nM and anti-myeloma activity. (Wu et al., 2019)
-
11.
Redistribute the cells evenly by gently vortexing the culture plate.
Note: The suspension cells will be redistributed unevenly after adding dose medium, which may result in abnormal signal intensity due to aggregation of cells.
-
12.
Incubate the cells for 6 h at 37°C with 5% CO2
Figure 1.

Colorimetric signal after selected steps
(A) After reaction with TMB substrate.
(B) After addition of stop solution.
(C) After re-dissolving Janus green B.
(D) Treatment conditions of each row.
Prepare in-plate sample for ELISA
This section aims to prepare fixed protein samples in cell culture plate. Cell permeabilization, endogenous peroxidase deactivation, and blocking of non-specific binding site is processed to obtain the best result.
-
13.
Spin down the cell culture plate at over 1,000 × g for 3 min.
Note: Inefficient spin down of cells to the bottom of the well would increase failure of fixation of suspension cells.
-
14.
Add 150 μL of fixation solution (2×) to each well without removing cell culture medium.
Note: Add fixation solution slowly and gently to wall of plate well to prevent resuspending the cells. Add the fixation solution in fume hood to prevent potential inhaling. Medium containing phenol red will turn into yellow or brown color once fixation solution is added.
-
15.
Incubate the plate at room temperature (20°C–23°C) for 15 min (10 min with shaking and then 5 min without shaking).
Alternatives: This incubation time can be extended to overnight (16–18 h) at 4°C. However, over-fixation (over 24 h) may increase the risk of failure to obtain final ELISA signal and Janus green stain signal.
-
16.
Remove the fixation mixture by vacuum.
Note: Fixation mixture should be disposed into containers according to chemical safety protocol or guideline.
-
17.
Add 300 μL washing buffer.
-
18.
Quickly remove the washing buffer by vacuum.
-
19.
Add 300 μL washing buffer.
-
20.
Incubate plate at room temperature (20°C–23°C) for at least 3 min.
-
21.
Remove washing buffer and repeat washing step one more time.
Note: Add all buffer and solution slowly and gently to wall of plate wells to prevent resuspending the cells.
-
22.
Add 100 μL permeabilization solution.
-
23.
Incubate plate at room temperature (20°C–23°C) for 10 min.
-
24.
Remove permeabilization solution by vacuum.
Note: this step aims to permeabilize the cell membrane and give access to the reagent and antibodies of following steps to target endogenous proteins.
-
25.
Rinse once and wash once with washing buffer.
-
26.
Add 100 μL quenching solution.
-
27.
Incubate plate at room temperature (20°C–23°C) for 20 min.
Note: this step aims to quench endogenous peroxidases and deactivate their potential enzymatic reactivity with TMB substate in later steps.
-
28.
Remove quenching solution by vacuum.
-
29.
Rinse once and wash once with washing buffer.
-
30.
Add 100 μL antibody buffer 1 without antibodies.
-
31.
Incubate plate, without shaking, overnight (16–18 h) at 4°C.
Alternatives: The incubation can be done for 1 h at room temperature (20°C–23°C).
Pause point: After add antibody buffer 1, the plate can be stored at 4°C for 24–48 h without affecting final result.
Immunostaining and ELISA readout
This section aims to immunostain the target protein with primary and secondary antibodies, leading to measurement of target protein level.
-
32.
Remove antibody buffer 1.
-
33.
Add 50 μL antibody buffer 1 to at least two “vehicle only” wells.
Note: Those wells will be used as “no-antibody” control or background control.
-
34.
Add 50 μL primary antibody solution to other wells.
-
35.
Incubate for 2 h at room temperature (20°C–23°C).
-
36.
Remove primary antibody solution by vacuum.
-
37.
Rinse once and wash three times with washing buffer.
-
38.
Add 100 μL secondary antibody solution to each well.
-
39.
Incubate plate for 1 h at room temperature (20°C–23°C).
Note: Keep strictly to the indicated incubation time. Over-incubation of secondary antibody will slightly decrease the overall signal-to-noise ratio.
-
40.
Remove secondary antibody solution from each well by vacuum.
Note: Secondary antibody is a horseradish peroxidase (HRP) conjugate and TMB substrate is extremely sensitive to HRP. Insufficient removal of secondary antibody will significantly increase the signal-to-noise ratio.
-
41.
Rinse once and wash four times with washing buffer.
-
42.
Add 100 μL TMB substrate mixture to each well.
Note: Freshly make TMB substrate mixture and store the mixture in a cool dark area if needed.
-
43.
Incubate plate in dark for 20 min at room temperature ranging from 20 to 23°C.
Note: The incubation time can be extended up to 1 h if only limited signal is observed. The resulting reaction mixture has a light blue color. See Figure 1A.
-
44.
Add 50 μL stop solution to each well.
-
45.
Incubate plate for 5 min at room temperature (20°C–23°C).
Note: The reaction mixture will firstly turn green in color upon the addition of stop solution. Then, the mixture will turn a yellow color shortly afterwards. See Figure 1B. Slightly increasing the strength of shaking will facilitate this conversion.
-
46.
Read optical density (OD) at 450 nm and 540 nm (background) of each well by plate reader.
Note: Read the signal within 30 min after the addition of stop solution.
Whole-cells stain
This section aims to stain the whole cell to determine the cell density, which can be used to normalize the ELISA signal obtained from the previous section.
-
47.
Remove TMB reaction mixture by vacuum.
-
48.
Rinse once and wash three times with washing buffer.
Note: The TMB reaction mixture is acidic and will affect the staining of Janus green. The mixture should be washed away immediately after reading the signal.
-
49.
Add 50 μL staining solution to each well.
Note: Handle the staining solution carefully to avoid its exposure to any working area or skin.
-
50.
Incubate for 5 min at room temperature (20°C–23°C).
Note: Janus green B is a reagent that stains mitochondria in living or fixed cells. (Raspotnig et al., 1999)
Note: Keep strictly to the indicated incubation time. Over-incubation of staining solution will increase the possibility of staining the surface of well wall and bottom, leading to high non-specific staining signal which may not reflect the cell density correctly.
-
51.
Remove staining solution by vacuum.
-
52.
Rinse once and wash four times with washing buffer.
Note: First two washes should use reduced volume (~100 μL) to wash away the staining reagent on the surface of well wall. Efficient removal of excess staining solution is critical to reduce the background of Janus green signal.
-
53.
Add 100 μL equilibrating solution.
-
54.
Remove equilibrating solution by vacuum.
-
55.
Add 100 μL solubilization solution.
-
56.
Incubate plate for 10 min at room temperature (20°C–23°C).
Note: Re-dissolving staining reagent results in blue color. See Figure 1C.
-
57.
Read OD at 595 nm and 750 nm (background) of each well by plate reader
Examples of optimized conditions for other proteins or cells
This section aims to show the conditions which have been optimized to measure the level of other proteins or in different cells. Due to change of cell line, reagent (compound, TMB, etc.) or target protein (and corresponding antibody), we recommend optimizing those conditions. See Figure S1A in our previous paper (Wu et al., 2019) for examples of optimization and validation of in-cell ELISA assay.
-
58.Optimized condition for target engagement assay in Jurkat cell line
-
a.Reduce the cell number to 2 × 10⁴ cells per well in a 96-well plate
-
b.Carefully redistribute the cells after the addition of compounds solution
-
a.
Note: Jurkat cell line is a T lymphocyte in suspension manner and widely used in immunology. It is regarded as a difficult cell line to perform transfections due to low content of proteoglycans.(Riedl et al., 2018) Successfully determining E3 ligand activity in this type of cell line highlights the utility of this cell-based target engagement assay. The Jurkat cells are recommended to be used within 10 passages.
-
59.Optimized condition for measuring IKZF1 and IKZF3 in MM1S cell line
-
a.For IKZF1, increase the cell number to 7 × 10⁴ cells per well in a 96-well plate
-
b.For IKZF3, decrease the antibody ratio to 1:2,000 when preparing the primary antibody solution
-
c.For both, add 25 μL 5× dose medium containing E3 ligands or degraders instead of sequential addition of 25 μL 6× dose medium containing E3 ligands and degraders
-
a.
Note: IKZF1 and IKZF3 are neo-substrates of CRBN E3 ligands such as thalidomide, pomalidomide and lenalidomide. It is important to characterize whether E3 ligand(s) or CRBN-based degrader(s) preserve that activity as molecular glue to induce degradation of IKZFs.
-
60.Optimized condition for measuring HDAC6 in MCF-7 cell line
-
a.Reduce the cell number to 5 × 10³ cells per well in a 96-well plate
-
b.Extend the treatment time of degrader(s) to 12 h
-
c.Exclude the spin down step before fixation
-
d.For fixation, add 1× fixation solution (4% formaldehyde) after remove the medium containing compounds
-
a.
Note: MCF-7 is a widely used adherent breast cancer cell line. This example demonstrates the utility of the in-cell ELISA assay to measure the HDAC6 level in cells other than suspension cells. The MCF-7 cells are recommended to be used within 10 passages.
Expected outcomes
There are several expected outcomes: (1) low or relatively low ELISA signal in no-antibody controls (background control) and degrader-treated control, see Figure 1B row A and row C; (2) obvious ELISA signal in DMSO-treated group (vehicle control), see Figure 1B row B; (3) reduced ELISA signal in pomalidomide-treated group (positive control), see Figure 1B row D; (4) good performance through steps will result in even Janus green signal among different groups while it is critical to normalize ELISA signal to cell density, see Figure 1C.
The following Quantification and statistical analysis section will provide a detailed method to generate normalized results showing relative HDAC6 protein level and indicating the binding affinity of thalidomide analogs. For example, Figure 2 represents a model experiment showing thalidomide, which is a weaker binder toward CRBN E3 ligase, prevented less HDAC6 degraded by WH181 than pomalidomide. N-methylated pomalidomide cannot bind to CRBN and acted similar as “WH181 only” treated group.
Figure 2.

Graphical representation of results obtained from following the quantification section
The example shown in Figure 1 is used.Data represent the mean of relative HDAC6 expression of four replicates ± SEM. Statistical analyses were done by GraphPad Prism. Statistical significance was analyzed by performing unpaired two-tailed Student’s t test of pomalidomide-treated group with other groups. ∗∗∗p < 0.001, ∗∗∗∗p < 0.0001.
Quantification and statistical analysis
To quantify the relative protein level (RPL), the first step is obtaining ELISA OD and Janus green OD by subtracting OD540 from OD450 and OD750 from OD595 respectively. The expected ELISA OD of vehicle (DMSO) treated group is over 0.3, OD of degrader-treated group is less than 0.1, and OD of no-antibody control is less than 0.03. The expected Janus green OD is around 0.2. The examples are shown in Table 1. Those examples are correlated with image and treatment conditions shown in Figure 1.
Table 1.
Example of ELISA and Janus green data measured on a plate reader
| ELISA (OD450–OD540) | 1 | 2 | 3 | 4 | Janus green (OD595 – OD750) | 1 | 2 | 3 | 4 |
|---|---|---|---|---|---|---|---|---|---|
| A | 0.017 | 0.018 | 0.018 | 0.017 | A | 0.175 | 0.214 | 0.193 | 0.202 |
| B | 0.324 | 0.363 | 0.334 | 0.316 | B | 0.228 | 0.261 | 0.225 | 0.232 |
| C | 0.091 | 0.088 | 0.093 | 0.093 | C | 0.268 | 0.253 | 0.275 | 0.248 |
| D | 0.25 | 0.221 | 0.25 | 0.222 | D | 0.261 | 0.247 | 0.271 | 0.246 |
| E | 0.116 | 0.111 | 0.121 | 0.111 | E | 0.254 | 0.223 | 0.238 | 0.207 |
| F | 0.07 | 0.081 | 0.049 | 0.062 | F | 0.193 | 0.249 | 0.172 | 0.186 |
Then, the next step is correction of ELISA OD to cell density, which was measured by Janus green stain (Andersen and Vermette, 2016). The corrected signal (CS) was calculated by the following formula:
Examples of corrected ELISA data is shown in Table 2.
Table 2.
Example of corrected ELISA data
| ELISA CS | 1 | 2 | 3 | 4 |
|---|---|---|---|---|
| A | −0.003 | 0.002 | 0.003 | −0.002 |
| B | 1.344 | 1.324 | 1.407 | 1.287 |
| C | 0.274 | 0.279 | 0.275 | 0.304 |
| D | 0.891 | 0.824 | 0.858 | 0.831 |
| E | 0.388 | 0.419 | 0.435 | 0.452 |
| F | 0.272 | 0.255 | 0.183 | 0.239 |
The RPL is then calculated by dividing CS of compound treated group by average CS of vehicle (DMSO) treated group and marked as “relative HDAC6 level relative to vehicle” on the Y axis of graph.
Examples of normalized ELISA data is shown in Table 3.
Table 3.
Example of relative protein level ELISA data
| ELISA RPL | 1 | 2 | 3 | 4 |
|---|---|---|---|---|
| A | −0.002 | 0.002 | 0.002 | −0.002 |
| B | 1.003 | 0.988 | 1.049 | 0.960 |
| C | 0.205 | 0.208 | 0.205 | 0.227 |
| D | 0.665 | 0.615 | 0.640 | 0.620 |
| E | 0.289 | 0.313 | 0.324 | 0.337 |
| F | 0.203 | 0.190 | 0.137 | 0.178 |
Normalized ELISA data can be input into graph & design software for analysis or graphing. See Figure 2 for examples.
Limitations
This protocol describes a platform specific to measure the binding affinity of CRBN E3 ligand(s). However, it has not been tested or optimized for other systems such as VHL E3 ligase and ligand. If needed, optimization will need to be performed.
This protocol is based on the readout of HDAC6 protein level, which is relatively abundant among different cell lines, e.g., MM1S and Jurkat, and cellular target engagement mechanism. We also tried to apply it to the A431 cell line. Although the HDAC6 can still be measured, there was no expected result observed from target engagement. It indicated that different cellular environments may affect the target engagement mechanism. Thus, when this protocol needs to be applied to other cell lines, optimization will need to be performed.
This is a cell-based activity test, thus the effects of cell permeability of the tested compounds have not been excluded on the final result. The corresponding cell permeability measurement of tested compound is recommended to be performed.
Troubleshooting
Problem 1
Significant number of cells are detached from well bottom (steps 13–15, steps 17–21).
Potential solution
It may be a result of failure of fixation or over washing. After completing the fixation, carefully handle the plate after spinning down the cells. Accidentally bumping the plate into other objects may resuspend the cells and increase the possibility of resuspending them again during addition of fixation solution. When adding the fixation solution, add the solution by contacting the well wall instead of directly adding to the medium and try to add it as slowly as possible. When performing the washing steps, add the buffer by contacting the well wall instead of directly adding to the cells.
Problem 2
ELISA signal is generally low (steps 43–46).
Potential solution
Check the quality or usage of critical reagent or materials, such as primary antibody solution and TMB substrate set, by orthogonal method such as western blot. Increase the incubation time (e.g., 1–2 h) or temperature (e.g., 37°C) after addition of TMB substrate mixture.
Problem 3
High background signal (steps 43–46).
Potential solution
It is generally due to inefficient washing of secondary antibody solution or contamination of secondary antibody to assay supplies such as tips and reagent reservoir. Increase the washing times after secondary antibody incubation. Change tips and reagent reservoir between each step.
Resource availability
Lead contact
Further information and requests for resources and reagents should be directed to and will be fulfilled by the Lead Contact, Weiping Tang (weiping.tang@wisc.edu).
Material availability
The small-molecule HDAC6 degrader WH181 was generated in this study and is available to the community upon request if we have the stock.
Data and code availability
No unique code was generated in this study.
Acknowledgments
The authors thank the University of Wisconsin Carbone Cancer Center’s (UWCCC) Consultation Panel for support of this project. This work is also supported in part by NIH P30 CA014520-UW Comprehensive Cancer Center Support (CCSG).
Author contributions
W.T. and K.Y. conceived and designed the assay. Y.Z., B.L.R., and X.N. contributed to the optimization of assay conditions.
Declaration of interests
The authors declare no competing interests.
References
- Andersen P.L., Vermette P. Intracellular insulin quantification by cell-ELISA. Exp. Cell Res. 2016;347:14–23. doi: 10.1016/j.yexcr.2016.06.014. [DOI] [PubMed] [Google Scholar]
- Raspotnig G., Fauler G., Jantscher A., Windischhofer W., Schachl K., Leis H.J. Colorimetric determination of cell numbers by Janus green staining. Anal. Biochem. 1999;275:74–83. doi: 10.1006/abio.1999.4309. [DOI] [PubMed] [Google Scholar]
- Riedl S., Kaiser P., Raup A., Synatschke C., Jérôme V., Freitag R. Non-viral transfection of human T lymphocytes. Processes. 2018;6:188. [Google Scholar]
- Wu H., Yang K., Zhang Z., Leisten E.D., Li Z., Xie H., Liu J., Smith K.A., Novakova Z., Barinka C. Development of multifunctional histone deacetylase 6 degraders with potent antimyeloma activity. J. Med. Chem. 2019;62:7042–7057. doi: 10.1021/acs.jmedchem.9b00516. [DOI] [PubMed] [Google Scholar]
- Yang K., Zhao Y., Nie X., Wu H., Wang B., Almodovar-Rivera C.M., Xie H., Tang W. A cell-based target engagement assay for the identification of cereblon E3 ubiquitin ligase ligands and their application in HDAC6 degraders. Cell Chem. Biol. 2020;27:1–11. doi: 10.1016/j.chembiol.2020.04.008. [DOI] [PMC free article] [PubMed] [Google Scholar]
Associated Data
This section collects any data citations, data availability statements, or supplementary materials included in this article.
Data Availability Statement
No unique code was generated in this study.