Abstract
Objective. To evaluate the degree of cognitive test anxiety (CTA) present in student pharmacists at multiple pharmacy programs in the United States and to determine if there are associations between self-reported CTA and relevant academic outcomes.
Methods. All 2018-2019 advanced pharmacy practice experience (APPE) students from three US Doctor of Pharmacy (PharmD) programs (N=260) were invited to participate in the study. Participants completed a validated 37-question survey that included the Cognitive Test Anxiety Scale-2 (CTAS-2) along with demographics-related questions. Responses were analyzed using analysis of variance (ANOVA), Kruskal Wallace, and multiple linear regression where appropriate.
Results. One hundred twenty-four students (48%) from the three programs participated in the study, and the individual data of 119 (46%) were included in the final analysis. Twenty-two students (18.5%) were classified as having high CTA, 41 (34.5%) as having moderate CTA, and 56 (47.1%) as having low CTA. High CTA predicted a 8.9 point lower NAPLEX total scaled score after accounting for other variables and was also correlated with lower cumulative didactic GPA, performance on the Pharmacy Curriculum Outcomes Assessment (PCOA), and increased likelihood of requiring course remediation.
Conclusion. High cognitive test anxiety affects 18% of pharmacy students and may significantly impact their performance on a variety of traditional student success measures, including the NAPLEX. Pharmacy educators should consider further use and adoption of test anxiety measurements to identify and assist potentially struggling students.
Keywords: cognitive test anxiety, NAPLEX, anxiety, student affairs, student success
INTRODUCTION
Anxiety is a complex emotional construct defined by a person’s response to stimuli perceived as threatening and encompasses a wide variety of cognitive, psychological, and physiological processes.1 Educational assessment situations, especially if perceived as “high stakes,” meaning directly or indirectly associated with academic consequences, can be viewed as threatening for the student being evaluated. This is known as test anxiety, and has been studied as a distinct psychological concept since the 1960s.2 Test anxiety is a “contextual” anxiety because individuals may not experience any symptoms outside of a specific evaluative environment.3 Test anxiety symptoms can vary from mild to severe. Also, an individual’s ability to cope with symptoms, allowing minimal disruption or consequences in personal or professional lives, also varies. Severe test anxiety may cause significant downstream effects, such as avoiding evaluative situations out of fear of embarrassment.4 Research has linked test anxiety to decreased academic performance, lower self-efficacy, and impaired problem-solving throughout all levels of education.5,6
Test anxiety encompasses two broad domains: emotionality (physiological components such as perspiration and headaches) and worry (psychological components such as heightened threat, susceptibility to distraction, and motivational disturbances).2 Worry, in this context, is also termed cognitive test anxiety (CTA) and has multiple theoretical models to explain its potential impact on individual performance in evaluative situations, including the cognitive interference model and the information-processing model.7 The cognitive interference model recognizes that CTA is linked to task-irrelevant cognitions (distractions) that prevent timely retrieval of information during assessments leading to impaired working memory. The information-processing model links CTA to deficits beyond simply retrieval and processing impairments during an examination and includes problematic processing and inefficiency in other areas, including study skills, basic organization activities, and comprehension. This suggests that students with severe test anxiety face challenges not only within the examination scenario but in areas critically related to preparation for examinations as well.
A variety of self-report instruments have been developed to characterize and measure CTA, including the Westside Test Anxiety Scale (WTAS),8 Spielberger’s Test Attitude Inventory (TAI),9 and Cassady and Johnson’s Cognitive Test Anxiety Scale (CTAS).10 Each instrument has advantages and disadvantages, including the length and complexity of the instrument, availability of use, and validity data in target populations. Spielberger’s TAI is a 20-item instrument designed to assess CTA before, during and after a specific exam and is situation/exam specific where respondents evaluate items using four-point Likert-type scales.9 Scores range from 20-80, with higher scores indicating higher levels of CTA.
The CTAS-2 is a 24-item self-report instrument that was modified from the original CTAS and adapted from the TAI to broaden the respondent’s perspective to include evaluations beyond simply the most recent one completed. The CTAS-2 was chosen to measure CTA in this study because of its validity and reliability data and because it had research-supported cut points for ranking the severity of the test taker’s CTA as mild, moderate, or severe.
Cognitive test anxiety has been associated with performance deficits in a variety of educational environments; however, no studies have been published to date in pharmacy evaluating the impact of CTA on student performance or academic outcomes of interest, including the North American Pharmacist Licensure Examination (NAPLEX). This is the first study to evaluate a potential link between CTA and performance on the NAPLEX and academic outcome measures, including didactic grade point average (GPA), and scores on the Pharmacy Curriculum Outcomes Assessment (PCOA) and Pharmacy College Admission Test (PCAT).
METHODS
This study was conducted at three US Doctor of Pharmacy (PharmD) programs (the University of Louisiana Monroe College of Pharmacy, University of Oklahoma College of Pharmacy, and Sullivan University College of Pharmacy and Health Sciences) and was approved by the institutional review boards of all institutions. Two of the programs were four-years in length and one was a three-year program. Inclusion criteria were student classification as a final-year advanced pharmacy practice experience (APPE) student at their respective school. Student data were excluded if either the CTAS-2 or NAPLEX score was unavailable.
All 2018-2019 APPE students from each of the three programs (N=260) were invited to participate in the study via an email sent in April 2018. The email contained study information and a link to the survey instrument. Informed consent was obtained through completion of the online survey. Study data were collected and managed using REDCap (Research Electronic Data Capture, Vanderbilt University, www.projectredcap.org) electronic data capture tools hosted at the University of Oklahoma.11,12 The secure, web-based software platform was designed to support data capture, tracking, manipulation, and export for research studies. REDCap was chosen for this study because of the sensitive data collected and REDCap’s ability to blind investigators from separate institutions.11,12 Survey responses were coded to link survey data to NAPLEX scores and other demographic data. Scores on the NAPLEX were only obtained for students who had signed a release waiver per each school’s established procedure. Additional data collected included participant sex, age, and race. Data collected via the office of academic affairs for each institution included pre-pharmacy cumulative GPA, pre-pharmacy science GPA, prerequisite GPA, pre-pharmacy math GPA, highest degree earned, didactic GPA (last GPA prior to starting APPE), remediation of a course (yes/no), delayed graduation (yes/no), composite and subsection scores on the pre-APPE PCOA, and composite and subsection scores on the PCAT, if available. To ensure more robust statistical analysis using regression modeling, if demographic data were unavailable, the mean of the total cohort was used.
The final survey instrument consisted of 37 questions, including the 24-question CTAS-2 and 13 questions related to demographics, help-seeking behavior, and the student’s anticipated anxiety regarding completion of the NAPLEX (anxiety rated on a scale of 1-10). The CTAS-2 has respondents rate items on a four-point Likert scale ranging from 1=not typical of me to 4=very typical of me. All CTAS-2 statements are negatively worded, with scores ranging from 24 to 96 and higher scores correlating to a higher level of CTA. Validated severity standards have also been established through latent class and cluster analyses for levels of CTA: low level=score of 24-43, moderate level=score of 44-66, and high level=score ≥67.7
A participant response rate (usable responses) and overall response rate was determined for each program included in the final analysis. A response was considered usable if a student completed the survey in its entirety and the student’s NAPLEX score was available. Demographic data for included participants were reviewed for each program to ensure that students who participated in the study were representative of that program’s student population. A sensitivity analysis of sample to institution averages found no significant differences. Data for all programs were combined for a final analysis.
Demographic, pre-pharmacy, and pharmacy academic characteristics were summarized using descriptive statistics for the overall population and then by CTAS-2 severity classification. Continuous variables were reported using means and standard deviations. The CTAS-2 severity classification group differences were analyzed using a one-way analysis of variance (ANOVA) with the Tukey method for pairwise comparisons. Categorical variables were summarized using frequency (percent) and analyzed using Pearson chi-square tests. Help-seeking behavior questions using a Likert-type scale were summarized with medians (interquartile ranges) and group comparisons were made using Kruskal-Wallis tests. The NAPLEX is scored using a total scaled score with possible scores ranging from 0 to 150 and consists of two primary content areas, area 1 and area 2, which each had scaled score ranges of 6 to 18.13 Zero-order correlations were conducted for each NAPLEX scaled score and each independent variable. Pearson correlation coefficients and point-biserial correlations were reported with 95% confidence intervals. Arbitrarily, the top 10 strongest bivariate correlations were ranked for each NAPLEX score.
Multiple linear regression analyses were performed to determine the associations between NAPLEX scaled scores and CTAS-2 severity classification groupings while controlling for available demographic, pre-pharmacy, and pharmacy academic variables. Linear regression was chosen over logistic regression to evaluate the impact of CTA on student NAPLEX scaled score as opposed to simply pass/fail status due to sample size limitations with only eight students failing the NAPLEX. Three regression models were fit with the following criterion variables: Model 1: NAPLEX Total Scaled Score; Model 2: Area 1 Scaled Score; and Model 3: Area 2 Scaled Score.
Preliminary diagnostics were performed to determine whether the colleges participating in the study were significantly different at the group level. Unconstrained (null) models were fit using hierarchical linear modeling with college used as a random effect for intercept. For each model, the intraclass correlation for college was assessed. Stepwise selection was used to determine a best fit model. Regression diagnostics included residual plots and checking multicollinearity of predictors via tolerance (>0.1) and variance inflation factor (<10) coefficients. Parameter estimates and adjusted R2 (aR2) were reported for each model. Type II semi-partial correlations (representing the unique correlation between predictor and NAPLEX score after controlling for other model variables) and type II squared, semi-partial correlations (representing the proportion of variance that is uniquely explained by the predictor after accounting for other model variables) were reported. All analyses were performed using SAS software, version 9.4 (SAS Institute Inc, Cary, NC). The a priori significance level was set at .05.
RESULTS
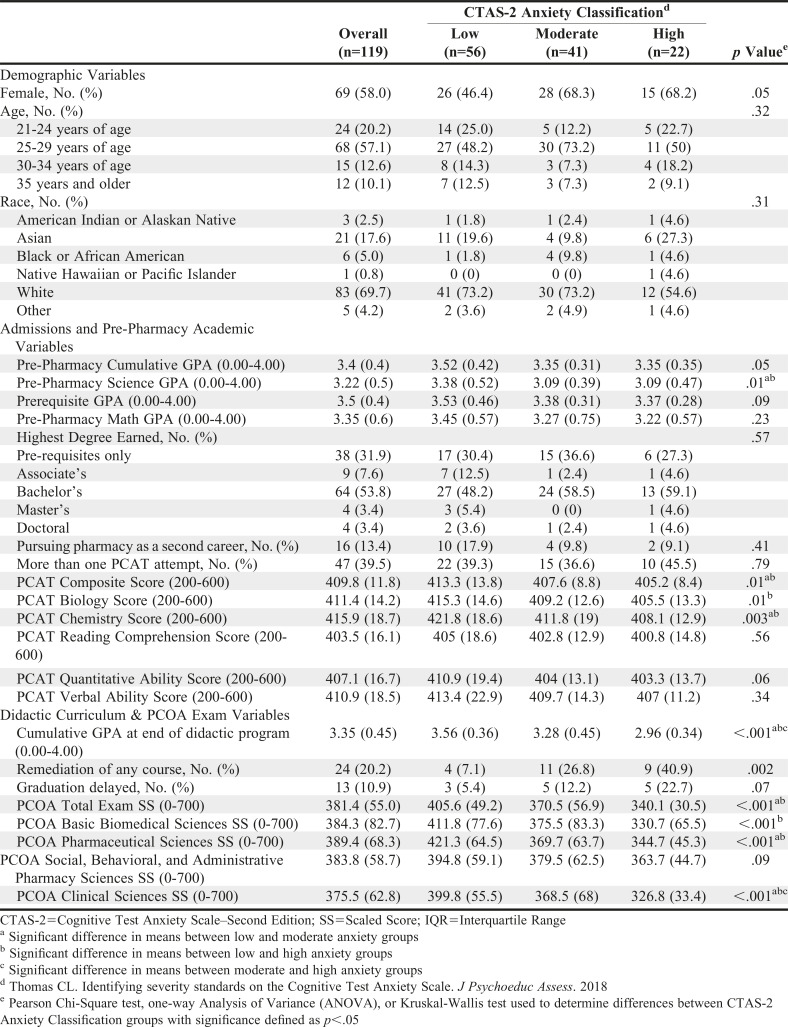
One-hundred twenty-four students (48%) from three PharmD programs met inclusion criteria for the final analysis of the study. Response rates varied by college, with OU having the highest (59%), followed by ULM (41%) and Sullivan (39%). Five of the 124 respondents did not have NAPLEX scores reported by NABP and were excluded. Therefore, 119 (46%) student survey responses and academic data were included in the final analysis. Demographic, pre-pharmacy, and pharmacy academic characteristics are reported in Table 1.
Table 1.
Characteristics of Pharmacy Students Included in a Multicenter Study Assessing Effect of Cognitive Test Anxiety on Academic Performance and Standardized Test Performance According to Cognitive Test Anxiety Scale–Second Edition (CTAS-2) Classification7
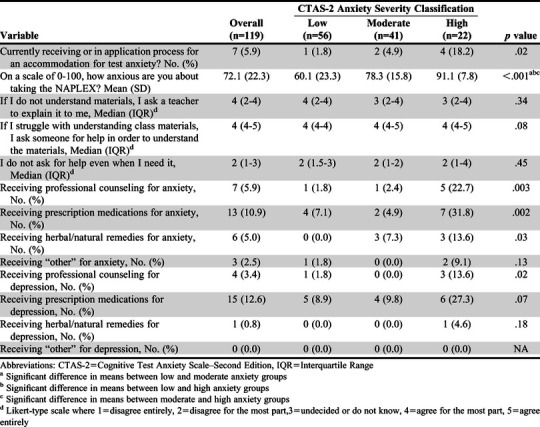
Classification of the 119 study participants by CTA severity revealed that 22 (18.5%) had high CTA, 41 (34.5%) had moderate CTA, and 56 (47.1%) had low CTA. More female than male students were classified as having moderate (68.3%) or high CTA (68.2%) (p=.05). Overall, less than 6% of participants reported receiving accommodations for test anxiety, with no differences found between the CTA groups on any of the three help-seeking behavior questions. Self-reported anxiety about taking the NAPLEX differed among CTA groups on all pairwise comparisons with high CTA students having the highest anxiety with a mean of 91.1 on a 100-point scale. Further detailed results from the survey of self-reported anxiety and help-seeking behaviors, including professional counseling and use of prescription or herbal remedies for anxiety, are reported in Table 2.
Table 2.
Anxiety and Help Seeking Behaviors of Pharmacy Students Who Participated in a Multicenter Study Assessing Effect of Cognitive Test Anxiety on Academic Performance and Standardized Test Performance
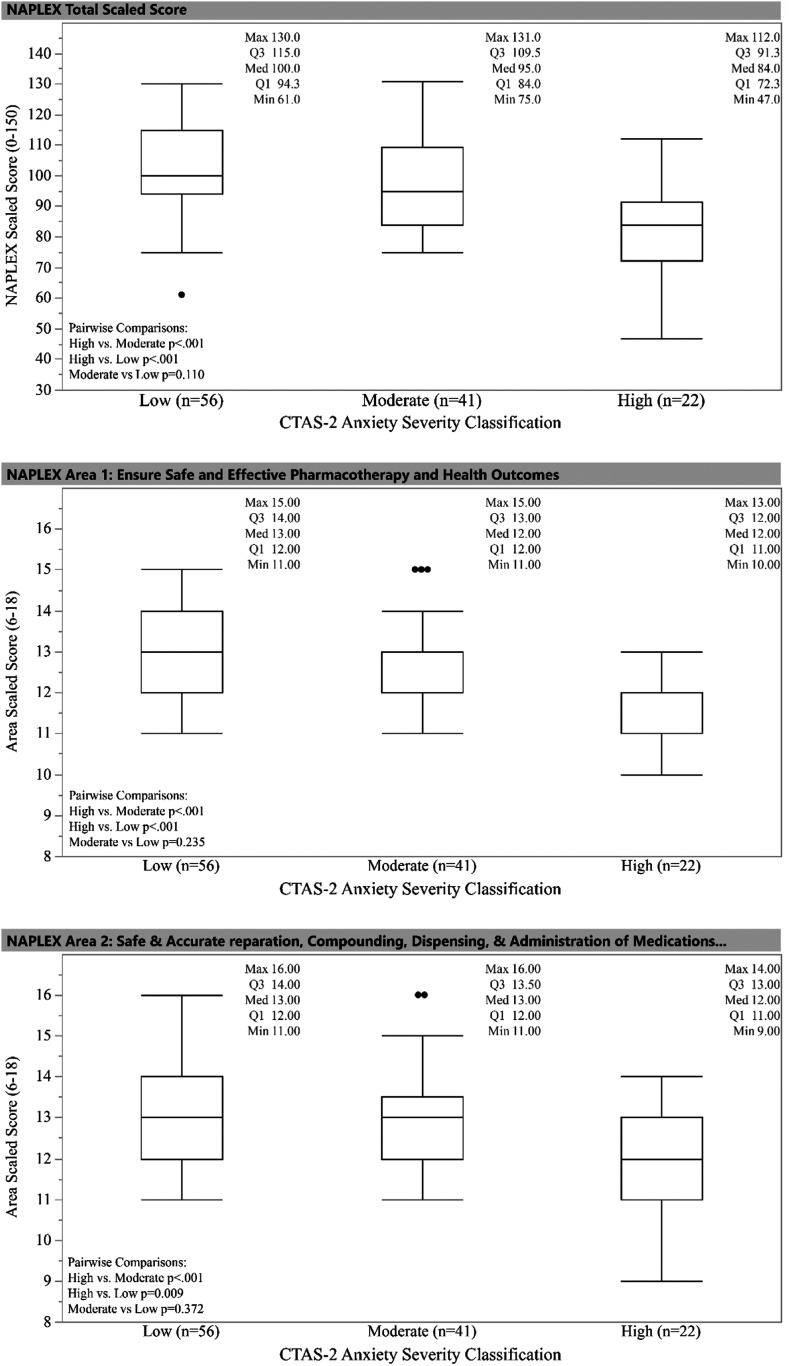
Overall, 93.3% of study participants passed the NAPLEX on their first attempt. Only one student in the low CTA group failed the NAPLEX on their first attempt and no student with moderate CTA failed. Seven (31.8%) of the 22 students with high CTA failed the NAPLEX. The distribution of NAPLEX Total Scaled Score, Area 1 Scaled Score, and Area 2 Scaled Score by CTAS-2 classification (low, moderate, high) are shown in Figure 1. Following significant one-way ANOVAs, the high CTA group was found to be significantly different from both the low CTA and moderate CTA groups in terms of both NAPLEX total scaled score and Area 1 and Area 2 scores using Tukey’s pairwise comparisons. Mean scaled scores between low CTA and moderate CTA groups did not differ.
Figure 1.
Boxplot of NAPLEX Scaled Scores vs CTAS-2 Anxiety Severity Classification
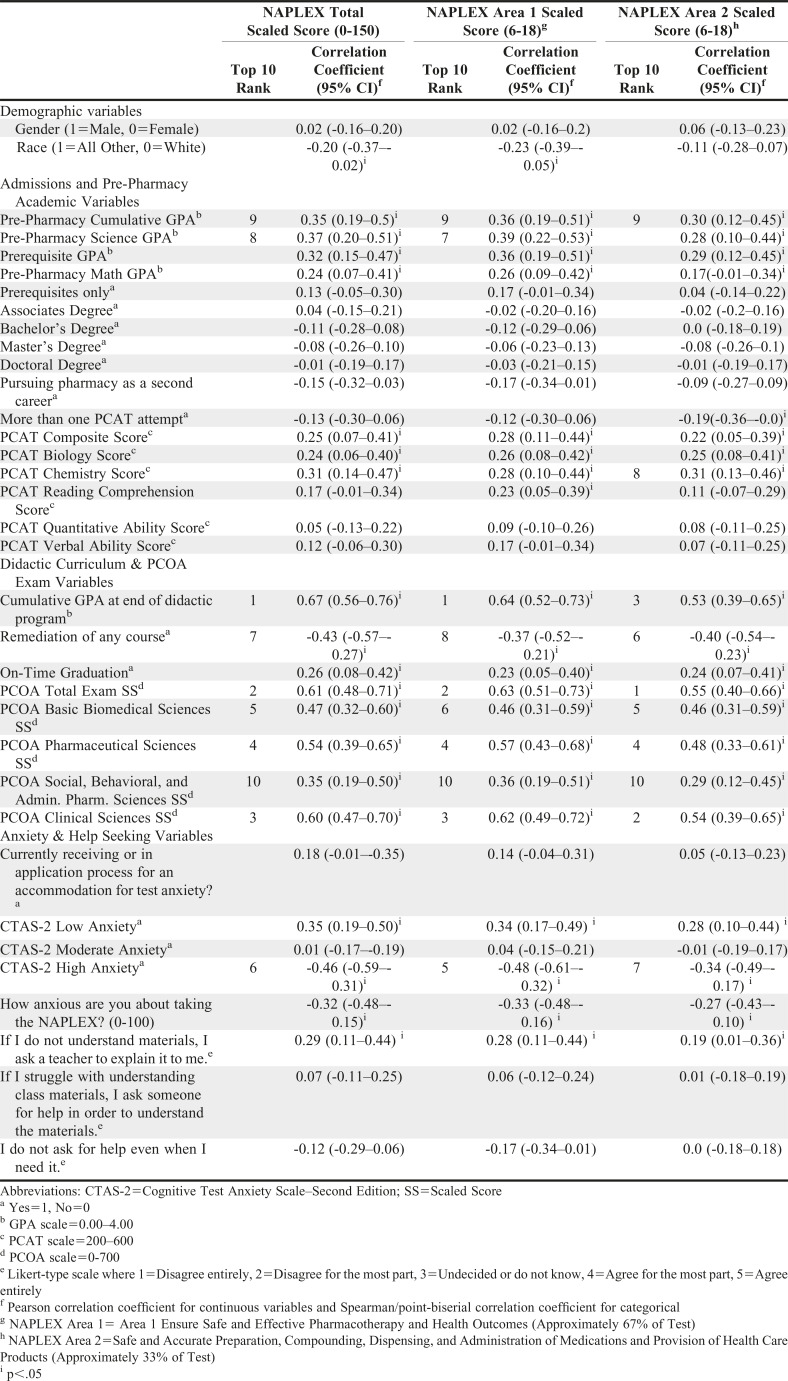
Zero-order correlations between each NAPLEX scaled score and independent variables are presented in Table 3. Out of the 35 variables presented, 20 were found significant for NAPLEX Total Scaled Score, 21 for NAPLEX Area 1 SS, and 20 for NAPLEX Area 2 Scaled Score. The 10 strongest correlations for each NAPLEX score are listed by rank in Table 3. For NAPLEX Area 1, Area 2, and Total Scaled Scores, seven out of the 10 strongest were related to didactic GPA or the PCOA.
Table 3.
Bivariate Associations Between NAPLEX Scores, Demographic, Pre-Pharmacy, Didactic Pharmacy and Anxiety-related Variables of Pharmacy Students Who Participated in a Multicenter Study Assessing Effect of Cognitive Test Anxiety on Academic Performance and Standardized Test Performance
Cumulative didactic GPA had the largest correlation with NAPLEX Total Scaled Scores (r=.67) and Area 1 Scaled Score (r=.64). The strongest correlation for NAPLEX Area 2 Scaled Score was PCOA Total Examination Scaled Score (r=.55). CTAS-2 High Anxiety (1=Yes vs 0=No) was found to be significantly related with all three NAPLEX scaled scores: TSS (r=-.46), Area 1 (r=-.48), and Area 2 (r=-.34). It was one of two variables that had significantly negative relationships, the other being remediation of any didactic course.
Preliminary diagnostics using HLM showed that the program represented 9.9% of the variance in Total Scaled Score (p=.21), 5.9% of the variance in Area 1 Scaled Score (p=.25), and 9.3% of the variance in Area 2 Scaled Score (p=.22). These models lacked statistical significance, which indicated using an HLM to account for college at the group level was not necessary. Therefore, stepwise multiple linear regression analyses were performed to model NAPLEX scaled scores. Table 4 reports the results from these analyses. No predictor in these models had a tolerance coefficient less than .44 or a VIF greater than 2.3, which indicated that all variables included explained a unique proportion of variance.
Table 4.
Stepwise Multiple Linear Regression modeling results for NAPLEX Scores of Pharmacy Students Who Participated in a Multicenter Study Assessing Effect of Cognitive Test Anxiety on Academic Performance and Standardized Test Performance
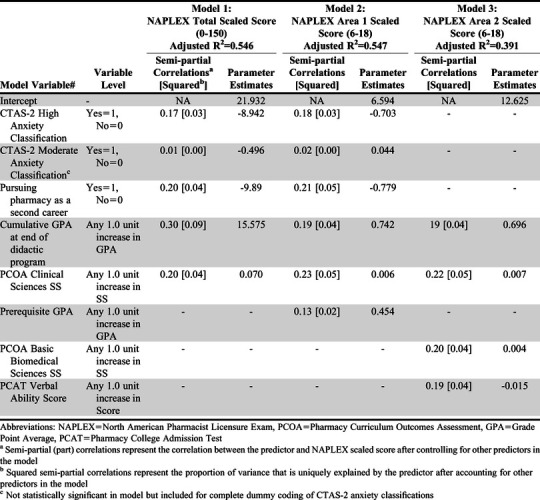
Using three separate models for stepwise linear regression found that those with high CTA had a predicted decrease of 8.9 points on the NAPLEX total scaled score after accounting for other variables in the model. Additional variables that explained variance in NAPLEX scores included didactic GPA, prerequisite GPA, PCOA Clinical Sciences Scaled Score, and pursuing pharmacy as a second career. Full reporting and analysis of these results are presented in Table 4.
DISCUSSION
Cognitive test anxiety (CTA) has been shown to negatively affect multiple areas of student performance in a variety of ways outside of pharmacy education. Our analysis is the first to apply these findings within pharmacy education and evaluate the role of CTA in student performance on a high-stakes licensure examination. These findings indicated that CTA had a moderate effect on student NAPLEX score and didactic GPA, which aligns with findings from previous research. Additionally, the data identified that a small percentage (18%) of students from the sample suffered from high levels of CTA and are most likely to have a greater negative impact on the summative examinations used in this study.
While CTA has not been considered previously when evaluating student performance on the NAPLEX, it has been previously assessed in pharmacy education in a different context. Sansgiry and Sail assessed the association between student pharmacist’ perception of their ability to manage their course work and their CTA level (n=198).14 In that study, CTA was assessed using an adapted version of an instrument published by Sarason that included 10 items evaluated on a Likert-type scale ranging from 1=not at all typical of me to 5=very much typical of me.15 Students were assessed two weeks prior to the final examination for the term during a week in which no tests were administered. The overall mean scores for the entire scale were reported, with higher scores indicating higher levels of CTA. The mean CTA score was 2.6 (SD=0.8), which corresponded with low to moderate CTA, and the scale showed good internal consistency (Cronbach alpha=0.9). Interestingly, a Spearman correlation showed that students’ perception of the intensity of their course work (when asked to evaluate it on a scale of 0-100) was significantly correlated with CTA (r=.24, p<.001). Additionally, student age was significantly associated with CTA, with younger students reporting lower levels of CTA (r=.91, p<.001). Although our study used a different scale than that used by Sansgiry and Sail, we are still able to draw helpful parallels. The overall mean CTA score in Sansgiry and Sail’s study as well as in our study fell in the low to moderate range. Additionally, our study had similar findings to that of Sansgiry and Sail related to coursework intensity, with subjective self-reporting of NAPLEX anxiety being proportionally higher for students in the moderate and high CTA groups as opposed to those in the low CTA group.
The effect of sex and type of examination has also been explored in the health professions education literature. Reteguiz assessed CTA in medical students (n=150) during clerkships after multiple-choice question (MCQ) and standardized patient (SP) examinations.16 At the end of the clerkship, two high-stakes examinations requiring a score of 70% to pass the clerkship were given approximately one week apart, one a standardized patient examination and the other a MCQ examination. Cognitive test anxiety was assessed using Spielberger’s TAI, which was described previously.9 Because no predetermined cut scores existed for the TAI in medical students, the researcher used the mean and SD of the data set to establish low (less than 1 SD below the mean), moderate (within 1 SD above or below the mean), and high (greater than 1 SD above mean) levels of CTA for all students in the study population, with different cut scores for male students vs female students. This analysis found that mean TAI scores were significantly higher in female students for both examinations (p=.02 for MCQ, p<.001 for SP). Overall TAI scores were also significantly higher in this sample for SP vs MCQ examinations (p=.03), though the author noted that the two-point absolute score difference was likely of little real-world significance. Interestingly, an analysis of variance found no significant difference in either male or female students in overall examination performance across all three CTA classifications (p>.05). Thus, in Retequiz’s analysis, while CTA levels were significantly higher in female students, a significant impact of CTA on examination performance was not seen in male or female students.16 Similarly, data from this study indicated that female students were more likely than male students to report higher levels of CTA yet exhibit no difference in performance, which was consistent with other CTA research to date.
Other literature has investigated the impact of CTA mitigation strategies as well as CTA itself on more objective outcome measures, like licensure examination performance. Green and colleagues explored the effect of an intervention that included test-taking strategies on performance by second-year medical students (n=93) on the US Medical Licensing Examination Step 1.17 In this study, CTA was assessed using the WTAS, which is a 10-item instrument containing statements that respondents evaluate on a five-point Likert-type scale ranging from 1=never true to 5=extremely true.8 Unlike other scales that sum the items for the overall score, the WTAS score is a mean of the 10 items on the instrument. The WTAS has been used to validate cut scores in various student populations; however, investigators have generally found that a mean score on the WTAS of 3.0 or greater suggests that the student would benefit from anxiety reduction training.8 The students in this study completed the WTAS at three time points: baseline, four weeks (following test-taking course completion), and 10 weeks (after the USMLE Step 1). The mean baseline WTAS score was 2.48 (SD=0.63), which fell in the normal/average range (2.0-2.5). In this sample, researchers found a significant inverse correlation between CTA and USMLE Step 1 scores after adjustment for scores on the Medical College Admission Test (β=-.24, p=.01). In the intervention group, CTA decreased from baseline to following the course, though not significantly (p=.09), but further decreased by the time students took the USMLE Step 1, this time significantly (p=.02). The CTA scores of those students in the control group increased over those same time intervals. Although our study was related to determining the effect of CTA on academic outcomes of interest and did not examine mitigation strategies, this research is promising and suggests that CTA does vary over time and could be amenable to external intervention.
Duty and colleagues assessed the association between CTA and academic performance in a cohort of nursing students (n=183).18 This study used the CTAS-1, the first iteration of the Cassady and Johnson CTA scale, which contains 25 statements respondents rate using a four-point Likert-type scale.10 Overall CTAS mean score was 56.6 (range 26-95; SD=17.4). Duty and colleagues established three score groups (low, average, and high) based on the distribution of scores from the group. They found that CTA scores showed significant but weak negative correlations with scores on the math subsection (r=-.31, p=.01) and verbal subsection (r=-.22, p<.05) of the Scholastic Aptitude Test (SAT), as well as on overall GPA (r=-.3, p=.01). Individual examination scores (via standardized T scores) were compared among participants in the low, average, and high CTA groups. Participants in the average and high CTA groups scored significantly lower on all but one of the four examinations evaluated, with average T scores 3-5 points lower in the high CTA group compared to scores in the low group. Our study found similarly poor academic results among those with higher CTA but did not directly assess CTA impact on individual student examination scores, instead targeting overall didactic GPA as a surrogate marker of academic performance.
This study has several limitations. First, students completed the survey instrument containing the CTAS-2 at the beginning of the APPE cycle (final year of both the three- and four-year PharmD programs). Student anxiety related to the NAPLEX may have changed during the year as time passed and the date for taking the examination drew closer. Additionally, accounting for baseline differences in CTA between schools of pharmacy was not done. Despite the limitations of this study, our results showed that those students with the highest levels of CTA will have lower total scores on the NAPLEX as well as other lower academic markers that are often predictive of success on the NAPLEX such as GPA and PCOA scores. A decrease of 8.9 points may not appear a large number, but for a borderline student this degree of decrease may be the difference between a passing score and a failing score on the NAPLEX, which is arguably the highest stakes examination pharmacy students have to take as it determines their ability to enter practice upon successful graduation. Knowing a student’s CTA grouping could allow schools to create and target interventions that would help at-risk students cope with their test anxiety, allowing them to not only function better during examinations but also improve the efficacy and impact of their examination preparation as well.
CONCLUSION
Many factors contribute to student academic difficulty and NAPLEX performance. Our research indicated that cognitive test anxiety (CTA) could be one such factor that schools should consider. According to these findings, CTA may pose a significant problem for some student pharmacists, having a wide range of potential impacts on student success. Students who experienced the highest levels of CTA had a predicted decrease of 8.9 points on the NAPLEX total scaled score, lower didactic GPA, lower PCOA scores, and increased likelihood of having to remediate a course. Based on these findings, the Academy might begin to develop and research strategies to mitigate the impact of CTA as well as develop mechanisms and processes to identify and help the most at-risk students reach their full potential.
REFERENCES
- 1.Taylor CB, Arnow BA. The Nature and Treatment of Anxiety Disorders. New York: London: Free Press; Collier Macmillan; 1988. [Google Scholar]
- 2.Liebert RM, Morris LW. Cognitive and emotional components of test anxiety: a distinction and some initial data. Psychol Rep. 1967;20(3):975-978. doi: 10.2466/pr0.1967.20.3.975 [DOI] [PubMed] [Google Scholar]
- 3.Hembree R. Correlates, causes, effects, and treatment of test anxiety. Rev Educ Res. 1988;58(1):47-77. doi: 10.3102/00346543058001047 [DOI] [Google Scholar]
- 4.Gamer J, Schmukle SC, Luka-Krausgrill U, Egloff B. Examining the dynamics of the implicit and the explicit self-concept in social anxiety: changes in the Implicit Association Test–Anxiety and the Social Phobia Anxiety Inventory following treatment. J Pers Assess. 2008;90(5):476-480. doi: 10.1080/00223890802248786 [DOI] [PubMed] [Google Scholar]
- 5.Putwain DW. Situated and contextual features of test anxiety in UK adolescent students. Sch Psychol Int. 2009;30(1):56-74. doi: 10.1177/0143034308101850 [DOI] [Google Scholar]
- 6.Zeidner M. Anxiety in education. In: International Handbook of Emotions in Education. Educational psychology handbook series. New York, NY, US: Routledge/Taylor & Francis Group; 2014:265-288. [Google Scholar]
- 7.Thomas CL, Cassady JC, Finch WH. Identifying severity standards on the Cognitive Test Anxiety Scale: cut score determination using latent class and cluster analysis. J Psychoeduc Assess. 2018;36(5):492-508. doi: 10.1177/0734282916686004 [DOI] [Google Scholar]
- 8.Driscoll R. Westside test anxiety scale validation. Educational Resources Information Center; 2007. https://files.eric.ed.gov/fulltext/ED495968.pdf. Accessed December 16, 2020. [Google Scholar]
- 9.Spieldberger CD. Manual for the Test Anxiety Inventory. Palo Alto, CA: Consulting Psychologists Press; 1980. [Google Scholar]
- 10.Cassady JC, Johnson RE. Cognitive test anxiety and academic performance. Contemp Educ Psychol. 2002;27(2):270-295. doi: 10.1006/ceps.2001.1094 [DOI] [Google Scholar]
- 11.Harris PA, Taylor R, Thielke R, Payne J, Gonzalez N, Conde JG. Research electronic data capture (REDCap): a metadata-driven methodology and workflow process for providing translational research informatics support. J Biomed Inform. 2009;42(2):377-381. doi: 10.1016/j.jbi.2008.08.010 [DOI] [PMC free article] [PubMed] [Google Scholar]
- 12.Harris PA, Taylor R, Minor BL, et al. The REDCap consortium: building an international community of software platform partners. J Biomed Inform. 2019;95:103208. doi: 10.1016/j.jbi.2019.103208 [DOI] [PMC free article] [PubMed] [Google Scholar]
- 13.National Association of Boards of Pharmacy. NAPLEX Content-Area Scores: Reference Information. nabp.pharmacy. https://nabp.pharmacy/wp-content/uploads/2018/04/NAPLEX-Content-Area-Scores-May-2017.pdf. Published May 2017. Accessed December 16, 2020. [Google Scholar]
- 14.Sansgiry SS, Sail K. Effect of Students’ Perceptions of Course Load on Test Anxiety. Am J Pharm Educ. 2006;70(2):26. doi: 10.5688/aj700226 [DOI] [PMC free article] [PubMed] [Google Scholar]
- 15.Sarason IG, Sarason BR. Test Anxiety. In: Leitenberg H, ed. Handbook of Social and Evaluation Anxiety. Boston, MA: Springer US; 1990:475-495. doi: 10.1007/978-1-4899-2504-6_16 [DOI] [Google Scholar]
- 16.Reteguiz J-A. Relationship between anxiety and standardized patient test performance in the medicine clerkship. J Gen Intern Med. 2006;21(5):415-418. doi: 10.1111/j.1525-1497.2006.00419.x [DOI] [PMC free article] [PubMed] [Google Scholar]
- 17.Green M, Angoff N, Encandela J. Test anxiety and United States Medical Licensing Examination scores. Clin Teach. 2016;13(2):142-146. doi: 10.1111/tct.12386 [DOI] [PubMed] [Google Scholar]
- 18.Duty SM, Christian L, Loftus J, Zappi V. Is cognitive test-taking anxiety associated with academic performance among nursing students? Nurse Educ. 2016;41(2):70-74. doi: 10.1097/NNE.0000000000000208 [DOI] [PubMed] [Google Scholar]


