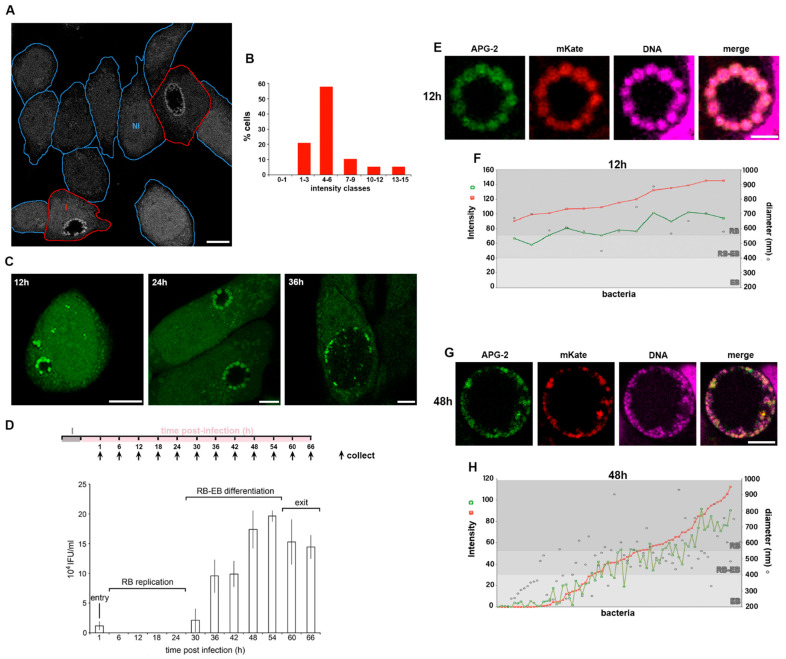
Figure 2.
C. trachomatis RBs accumulate K+. HeLa cells were infected with C. trachomatis LGV2. (A) Infected cells were incubated with APG-2 24 hpi and a mixed population of infected and non-infected cells imaged. Cell edges are indicated in blue for non-infected cells (NI) and in red for infected cells (I). Scale bar: 10 µm. (B) Measured average cytoplasmic APG-2 intensity of non-infected cells were classified according the x-axis. (C) Infected cells at 12, 24 and 36 hours post infection (hpi) were incubated with APG-2 and imaged. Scale bar: 10 µm. (D) Upper panel: schematic of the experiment design. I: infection. Lower panel: Infectivity assay of cells collected at the indicated time on the x-axis corresponding to the collection time on the upper panel. The y-axis shows the inclusion forming unit per mL (IFU/mL). The different phases of infection corresponding to the infectivity assay are indicated. Error bars: standard deviation. (E–H) cells were infected with C. trachomatis LGV2 as in (A) to (D), but bacteria were transformed with pASK-GFP-L2 allowing the expression of mKate (red) only when the bacteria are in the RB form. Cells were incubated with APG-2 at the indicated time point ((E,F) 12 hpi; (G,H) 48 hpi) and imaged. Image analyses were performed as described (Experimental Procedures and Figure S1B) allowing the measurement of the bacterial diameter, the intensity of APG-2 (green) and mKate (red) for each individual bacteria ((F) and (H), grey level reflecting different type form of the bacteria).

