

Abstract
There is a rapid increase in the prevalence of diabetes in India. We wanted to review the status of prediabetes and diabetes in the combined population of Chandigarh and Panchkula region based on both Indian Diabetes Risk Score (IDRS) and Glycated Haemoglobin (HbA1c). A total of 1215 subjects were recruited during the screening process, out of which 444 i subjects have been analysed for the current study on the basis of high risk for IDRS (≥60) and their known diabetes status. This study included 431 subjects having high risk for IDRS (≥60) and 13 known subjects with diabetes (IDRS < 60) which were further analysed for biochemical and anthropometric parameters. The prevalence of diabetes was found to be 12.67% and prediabetes 11.69% in the combined population of Chandigarh and Panchkula. There was an increased level of fasting blood glucose (183.12 ± 68.61), postprandial blood glucose (262.57 ± 96.92), triglyceride (193.84 ± 119.88), very low‐density lipoprotein (VLDL) (34.87 ± 15.42) and High Density Lipoprotein(HDL) (4.61 ± 1.39) in the said diabetes population. Mean HDL was found to be decreased in subjects having diabetes. Glucose‐induced lipid intolerance study revealed significant alteration in triglyceride, HDL and VLDL. The study has revealed that high prevalence of diabetes in the sampled population when compared with the national average of 8.8%.
Keywords: blood glucose, diabetes, glycated haemoglobin, Indian diabetes risk score
The study has revealed that high prevalence of diabetes in the sampled population when compared with the national average of 8.8%.
1. INTRODUCTION
Percentage of glycated haemoglobin (HbA1c) is used as an important biochemical parameter to assess past three month's blood glucose status. 1 Factors affecting HbA1c level include blood sugar concentration, Red Blood Cell (RBC) duration to varying concentrations and quantity of RBC. In 2009, American Diabetes Association (ADA) and, in 2011 World Health Organization (WHO) recommended that HbA1c as a tool for the screening, diagnosis and monitoring of diabetes. 2 According to ADA guidelines, the recommended values for the diagnosis of diabetes includes HbA1c ≥ 6.5% (48 mmol/mol), fasting sugar ≥ 126 mg/dL (7.0 mmol/L) and 2‐hr postprandial level ≥ 200 mg/dL (11.1 mmol/L). 2 At cut‐off value of 6.5% HbA1c demonstrated the sensitivity of 44% and specificity of 99% in adult population (69.4 ± 11.1 years). 3 For prediabetes and healthy individuals, the recommended HbA1c value is 5.7%‐6.4% and <5.7%, respectively. 4 A 6‐year diabetes prediction study showed that at 5.7% HbA1c cut‐point, the sensitivity was 66% whilst the specificity was 88%. 5 Similarly, a study from National Health and Nutrition Examination Survey (NHANES) demonstrated the sensitivity of HbA1c to be 39%‐45% and specificity to be 81%‐91% for 5.7% HbA1c. Another study predicted the association of 5.7% HbA1c with high risk for diabetes. Therefore, a value of 5.7%‐6.4% is considered reasonable for identification of individuals within prediabetes. 6 HbA1c acts as a dependable method to detect chronic hyperglycaemia and the risk of developing other diabetes complications in long term. Studies suggest that the increased level of HbA1c acts as an independent risk factor for complications like stroke and coronary heart disease in individuals with or without diabetes. 7 In India, diabetes mellitus (DM) is amongst the leading health problem which profoundly affects the health budget due to the comorbidities associated with it. 8 A total of 415 million individuals have been reported to be affected with diabetes which is further expected to rise up to 642 million by the end of 2040. 9 About 75% of the low/middle income countries will be affected. This drastic increase in the number of affected individuals with diabetes poses a threat to the productivity and economy of a developing country. It was estimated that the annual expenditure on diabetes costs about USD 760 billion which is 10% of the total annual global health expenditure. India has estimated 72, 946, 000 diabetes cases (with 8.8% prevalence in adults) is the second largest after China. 10 In India, the average cost per person on diabetes was USD 67.98 in 2012. 11 According to a study published in Lancet, the number of individuals with diabetes was drastically increased in India from 1980 to 2016. In 1990, there were 26.0 million people suffering with diabetes in India, which increased to 65.0 million in 2016. 12 The prevalence of diabetes in India varies across various states, ranging between 5% to 17% with highest prevalence in southern states and in urban areas. 9 A survey report (conducted between 2015‐19) published by Ministry of Health and Family Welfare reports the prevalence of diabetes to be 11.8% for these 4 years. This report has revealed the prevalence of known diabetes cases to be 8%, whereas the prevalence of new cases was 3.8%. 13 The estimates of prevalence and identification of the individuals with high risk for diabetes are important for the planning. The identification of these high‐risk individuals are equally important, and this can only be achieved if they are identified at transition state or before that. Prediabetes can be considered as the transition state between a healthy and a diabetes individual. Prediabetes, also called intermediate hyperglycaemia, is a condition in which the serum blood glucose levels are higher than the normal levels, but not enough to cause diabetes. According to ADA, the cut‐off level for prediabetes is 5.7%‐6.4%. Prediabetes is linked with the abnormalities in the form of insulin resistance and β‐cell dysfunction which starts before glucose changes are measurable. It is estimated that there will be >470 million people with prediabetes in 2030. The conversion rate of prediabetes to diabetes is around 5%‐10%. 14
Furthermore, by identification of prediabetes in the population, the threat of conversion from prediabetes into diabetes can be reduced. 15 The Indian Diabetes Risk Score (IDRS) is a method developed by Mohan et al in 2005 to analyse the risk of prediabetes/diabetes at mass level. 16 IDRS considers four parameters: age, family history (father or mother), physical activity and abdominal obesity (waist circumference). Risk assessment by IDRS involves 3 categories: score < 30 (low risk), 30‐50 (moderate risk) and ≥60 (high risk). We performed a cross‐sectional study in 2 regions of North West India population (Chandigarh and Panchkula) based on IDRS in order to explore the prediabetes and diabetes individuals in the community further validated on the basis of HbA1c levels. Individuals with high risk (IDRS score ≥ 60) were selected for the analysis. The specificity of IDRS score ≥ 60 was 60.1%, whereas the sensitivity was 72.5%. 17
2. METHODOLOGY
2.1. Study design
This study was a part of Niyantrita Madhumeha Bharata (NMB) programme, in which 29 Indian States and 7 Union Territories (UTs) were screened. It was a multi‐level cluster randomized controlled trial. However, the data presented in this study are of two regions of North West India i.e. Chandigarh (Union Territory), and Panchkula (District). For sample size calculation, we referred to Diabetes Community Lifestyle Improvement Program (D‐CLIP) study published in diabetes care. 18 The details are published in our recent publications. 19 , 20 As a part of this national programme, house‐to‐house screening was carried out by trained volunteers of Indian Yoga Association (IYA). A two‐page questionnaire was used which comprises of the personal information about name, age, family history of diabetes, waist circumference, height and weight, besides collecting the workout information. Based on this, IDRS score was calculated. 17 Initially, a total of 1215 subjects were recruited for the study, out of which 444 subjects were assessed for the biochemical parameters based on high risk for IDRS (IDRS ≥ 60) and their known diabetes status. The Figure No ‐ 1 shows the schematic of recruitment of an individuals for the study. Kish formula for house‐to‐house screening was not used (Figure 1).
Figure 1.
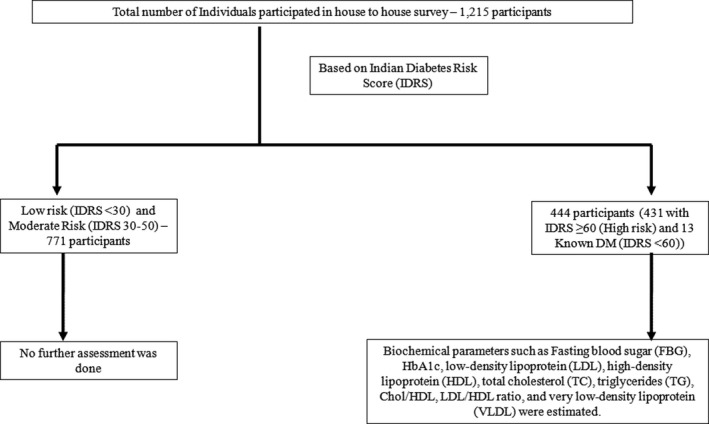
Schematic representation of recruitment of individuals
2.1.1. Inclusion and exclusion criteria used for screening was as following
Inclusion criteria
Both male and female participants with diabetes (self‐reported, which was cross verified)
Subjects were from within the periphery of 10km distance from rural and urban regions.
Those individuals who showed an IDRS score ≥ 60 (for further recruitment)
Patients/Subjects who gave their consents for the study.
Exclusion criteria
Age below 18 years
Patients with cardiac disease and tuberculosis.
Those who had complex surgeries in past.
Those who had major illness which may disable an individual having diabetes.
Individuals with neurological disorders.
2.2. Assessments
2.2.1. Biochemical
Participants were called for the special blood collection camp on empty stomach with minimum eight hours of fasting. The blood sampling and subsequent biochemical analysis was carried out by an National Accreditation Board for Testing and Calibration Laboratories (NABL) accredited laboratory. Fasting blood glucose (FBG), HbA1c, low‐density lipoprotein (LDL), high‐density lipoprotein (HDL), total cholesterol (TC), triglycerides (TG), cholesterol/HDL, LDL/HDL ratio and very low‐density lipoprotein (VLDL) were analysed for such fasting samples. An autoanalyser (model 2700/480) (Validation: Beckman Coulter) for the estimation of TC, TG, LDL, HDL and VLDL was used. For HbA1c, we used HPLC‐based technique using the Variant II Turbo machine (Bio‐Rad, Hercules). Postprandial blood glucose (PPG) sample was taken after 2 hours of breakfast and estimated using Mindray Autoanalyzer (BS‐390 model). The methods used for the assessment were certified by the National Glycol Haemoglobin Standardization Program (NGHSP) as detailed in our recent publication. 19
2.2.2. Anthropometry
.
Height ( Stadiometer) and waist Circimference ( Standard measuring tape) was measured in centimeters. weight. Weights ( digital weighing machine) was measured in kgs.
2.3. Ethical statement
Ethical clearance for the study was obtained from the Institutional Ethical Committee of Indian Yoga Association, via letter number: RES/IEC‐IYA/001 dated 16th December 2016. Blood samples of the participants were taken after the written informed consent was signed by them. This study was primarily done by Swami Vivekananda Yoga Anusandhana Samsthana (S‐VYASA) under IYA.
2.4. Statistical analysis
The statistical analysis was done by using the IBM SPSS Statistics Version 21. The data are presented as mean, standard deviation (SD) and standard error (SE). Descriptive statistics was performed by one‐way ANOVA. The data were found to be statistically significant at P < .05.
3. RESULTS
Based on the house‐to‐house screening, 1215 individuals were recruited and screened as per IDRS score as low‐risk, moderate‐risk and high‐risk individuals. Out of 1215, a total of 444 subjects were found to be at high risk (≥60 or known diabetes status) which were further assessed according to HbA1c levels. The final prevalence of diabetes, prediabetes subjects were found to be 12.67% and 11.69%, respectively, as depicted in the Table 1.
Table 1.
Prevalence of diabetes, and prediabetes in the combined population of Chandigarh and Panchkula
| S No. | Population subsets | Number of participants | Prevalence (%) | |
|---|---|---|---|---|
| 1. | *Diabetes Population (High‐risk IDRS/Known DM and HbA1c >6.5) | 154 | 12.67 | |
| 2. | Prediabetes Population (High‐risk IDRS and HbA1c: 5.7 ‐ 6.4) | 142 | 11.69 | |
| 3. | Healthy Population | High‐risk IDRS and HbA1c ≤ 5.6 ‐ (n = 148) participants | 919 | 75.64 |
| Low‐ and moderate‐risk IDRS ‐ (n = 771) participants | ||||
| Total | 1215 | 100 | ||
There were total 13 individuals with IDRS score less than 60, but HbA1c ≥ 6.5.
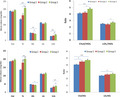
Table No 2 summarizes the comparison between the three groups: diabetes, prediabetes and healthy population amongst the high‐risk IDRS individuals (≥60). Out of 444 subject samples analysed, 307 were females and 137 were males. The estimated FBG level was highest in diabetes group (183.12 ± 68.61) than the healthy (93.01 ± 7.80) and prediabetes group (102.27 ± 13.26). Similarly, the mean PPG levels in diabetes group were 262.57 ± 96.92, which was higher than healthy (96.53 ± 17.14) and prediabetes group (121.75 ± 36.32). We found TG levels were more (193.84 ± 119.88) in diabetes group than the other two group used in the present study. VLDL was also found to be increased in individuals with diabetes (34.87 ± 15.42). No much difference in mean TC was observed in three groups. Mean TC for diabetes group was 191.58 ± 43.06, for prediabetes it was 190.99 ± 35.46, and for group with HbA1c ≤ 5.6 it was 182.93 ± 36.88. Amongst the high‐risk IDRS individuals, the mean IDRS was found to be 71.15 ± 10.20 for healthy group, 76.41 ± 9.99 for prediabetes and 75.19 ± 14.69 for diabetes. Good cholesterol (HDL) was found to be reduced in diabetes group (43.52 ± 9.91), in comparison with the prediabetes (47.46 ± 12.78) and healthy group (48.69 ± 13.04). Apparently, the anthropometric parameters, namely BMI (29.30 ± 4.46) and weight (72.58 ± 11.47), were highest amongst the prediabetes subjects. We measured the glucose‐induced lipid intolerance by estimating different lipid parameters with respect to FBG and PPG, considering the reference range of FBG as 70‐110 mg/dL and a range of 80‐140 mg/dL for PPG. 21 We found that for PPG and FBG, parameters like triglyceride and VLDL showed significant increased (P < .05) in lipid intolerance, whereas HDL showed significant decrease (Figure 2) (Table S1).
Table 2.
Comparative analysis of various physiological and biochemical parameters in Healthy, Prediabetes and Diabetes individuals with respect to HbA1c
| Subgroups (HbA1c) | Total number (n) | Healthy (≤ 5.6) (Mean ± SD) (SE) | Prediabetes (5.7‐6.4) (Mean ± SD) (SE) | Diabetes (≥6.5) (Mean ± SD) (SE) | *Significance (P‐Value) |
|---|---|---|---|---|---|
| (Female/Male) | 444 (307/137) | 148 (111/37) | 142 (106/36) | 154 (90/64) | ‐ |
| Age (years) | 45.77 ± 10.20 (1.07) | 51.95 ± 10.78 (1.15) | 53.79 ± 9.81 (1.02) | ‐ | |
| Weight (Kg) | 444 | 69.33 ± 14.10 (1.16) | 72.58 ± 11.47 (0.96) | 70.29 ± 12.76 (1.03) | ‐ |
| BMI (Kg/m2) | 444 | 27.88 ± 5.94 (0.49) | 29.30 ± 4.46 (0.37) | 27.58 ± 4.80 (0.39) | .009 |
| IDRS | 444 | 71.15 ± 10.20 (0.84) | 76.41 ± 9.99 (0.84) | 75.19 ± 14.69 (1.18) | <.001 |
| Fasting Blood Glucose (FBG) (mg/dL) | 444 | 93.01 ± 7.80 (0.64) | 102.27 ± 13.26 (1.11) | 183.12 ± 68.61 (5.53) | <.001 |
| Postprandial Glucose (PPG) (mg/dL) | 419 | 96.53 ± 17.14 (1.49) | 121.75 ± 36.32 (3.06) | 262.57 ± 96.92 (8.05) | <.001 |
| Cholesterol (mg/dL) | 444 | 182.93 ± 36.88 (3.03) | 190.99 ± 35.46 (2.98) | 191.58 ± 43.06 (3.47) | .100 |
| Triglyceride (mg/dL) | 444 | 134.92 ± 71.39 (5.87) | 140.13 ± 67.52 (5.67) | 193.84 ± 119.88 (9.66) | <.001 |
| HDL (mg/dL) | 444 | 48.69 ± 13.04 (1.07) | 47.46 ± 12.78 (1.07) | 43.52 ± 9.91 (0.79) | .001 |
| LDL (mg/dL) | 441 | 109.01 ± 29.06 (2.40) | 115.50 ± 29.78 (2.49) | 109.64 ± 34.96 (2.83) | .156 |
| Cholesterol/HDL | 444 | 3.96 ± 1.13 (0.09) | 4.22 ± 1.14 (0.09) | 4.61 ± 1.39 (0.11) | <.001 |
| LDL/HDL | 443 | 2.38 ± 0.73 (0.06) | 2.57 ± 0.86 (0.07) | 2.60 ± 0.93 (0.07) | .045 |
| VLDL | 435 | 26.79 ± 13.36 (1.10) | 27.51 ± 12.07 (1.02) | 34.87 ± 15.42 (1.27) | <.001 |
P values which are considered statistically significant and indicated in bold.
Between group analysis (ANOVA); P < .05.
Figure 2.
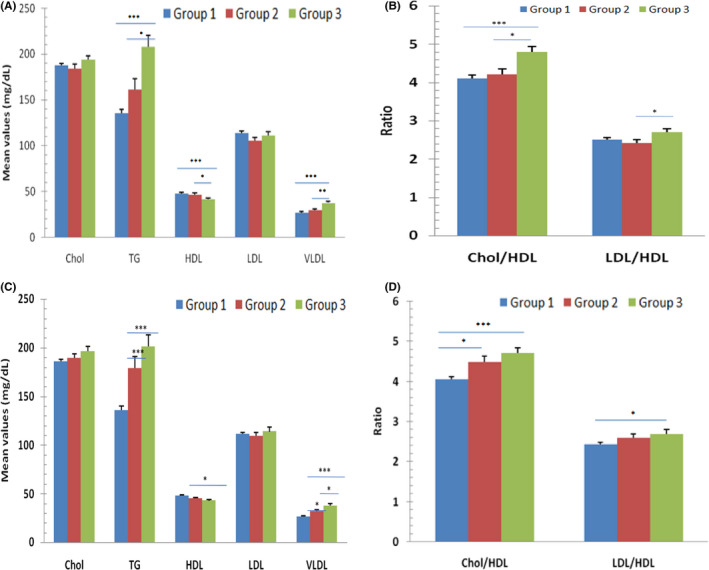
Glucose‐induced lipid profile intolerance: (A & B) determined by postprandial glucose (PPG), considering its specific range (80‐140 mg/dL: Group 1; 141‐220 mg/dL: Group 2; ≥221 mg/dL: Group 3). (C & D) determined by fasting blood glucose (FBG), with specific range (70‐110 mg/dL: Group 1; 111‐160 mg/dL: Group 2; ≥161 mg/dL: Group 3)
4. DISCUSSION
In the present study, we have analysed the prevalence of prediabetes, and diabetes subjects based on IDRS score and HbA1c levels. Our study is based on IDRS assessment to diagnose diabetes and prediabetes in the target population. There are very few IDRS‐based studies in the target population (Chandigarh and Panchkula). In previously published study very low sample size (n = 155) was used. 22 Therefore, we wanted to study the prevalence of diabetes and prediabetes in larger sample size (n = 444). According to present study, the prevalence of prediabetes and diabetes was 11.69% and 12.67%, respectively. Clinical parameters such as FBG and PPG are considered as standard parameters for glycaemic index. 23 Therefore, considering these two parameters, we analysed the glucose‐induced lipid intolerance. We found significant alteration in case of triglyceride (increased) and HDL (decreased) in the sampled population. HDL biological activity is highly variable. It plays a crucial role in efflux of cholesterol from the peripheral cells and further reverses the cholesterol transfer from peripheral cells to the liver. HDL also neutralizes the oxidized lipids thereby acting as an antioxidant. In case of diabetes, HDL loses its antiatherogenic activity. In accordance with the previous studies, 7 , 24 we found that the mean HDL was reduced in diabetes population. 25 , 26
Group comparison based on HbA1c between healthy, prediabetes and diabetes group amongst high‐risk IDRS population shows a direct correlation of HbA1c with PPG, FBG, triglyceride, LDL and VLDL and inverse correlation with HDL. Other such studies based on Chandigarh residents suggest that the prevalence of diabetes is more in this population (13.6%) as compared to other regions of India. 27 , 28
We also found the mean age of prediabetes and diabetes was more than the healthy individuals amongst the high‐risk IDRS individuals. This is evident from previous studies explaining the early onset of diabetes (40‐60 years) in developing countries. 28 Similarly, the mean weight of individuals with diabetes was higher than the healthy group of the high IDRS group. This suggests that with the increase in age and weight, people are more prone to diabetes. 28 The higher risk of this population could be because of increasing age, obesity and family history. One of the underlying reasons could be physical inactivity (which is shown by high IDRS score), increased BMI in our studied population. Physical inactivity decreases insulin sensitivity which may cause diabetes. 28 From the study, it is evident that sampled population analysed was overweight (BMI > 25) and aged. The selected population is at higher risk for developing diabetes, and this is reflected by two major previous studies. 27 , 28 Besides, this population is generally known for protective smoking lifestyle which makes the results unique to this population. 29 Since IDRS and HbA1c both have been shown to diagnose patients with diabetes, there is need to correlate the two parameters in a larger cohort. IDRS is not used as per general guidelines even though it is simple and effective tool. It is also less expensive to detect diabetes/prediabetes in large populations. However, further confirmation is required with respect to the fasting and PPG estimation in order to detect diabetes or prediabetes as per ADA guidelines. Also, IDRS is considered as useful for prediction of risk of diabetes in real time as it does not measure the long‐term effect as in case of three month's blood glucose status assessed by HbA1c.
5. CONCLUSION
The study is unique for this population as it assesses the risk based on simple and cost‐effective tool, that is IDRS considering the HbA1c level. However, Chandigarh and Panchkula represent a small part of North West Indian population and hence there is a need to conduct such studies at large scale. Also, the lifestyle, per capita income and literacy rate in this region are high as compared to other regions of India, and most of the population belongs to urban locality that rarely smokes. Therefore, at this stage the transition from prediabetes to diabetes can be controlled. Such study can, therefore, act as an index of glycaemic control. Our findings can help the government to implement IDRS‐based HbA1c risk assessment, where the early control is possible thereby halting the transition of prediabetes to diabetes.
CONFLICT OF INTEREST
Authors declare no conflict of interest.
AUTHOR'S CONTRIBUTION
SK contributed to data collection, original writing and statistical analysis; AA contributed to concept of manuscript; RN contributed to proposal writing, study design, planning and monitoring; NK contributed to data collection and segregation of the data; MSS contributed to manuscript writing and statistical analysis; VP contributed to writing and editing; DKP contributed to data collection, NM contributed to data collection and monitoring; AKS contributed to planning, monitoring, data management and quality assurance; HRN contributed to vision, concept, proposal, planning, monitoring, advice, problem solving and editing.
Supporting information
Table S1
ACKNOWLEDGEMENTS
Authors would like to acknowledge the Ministry of Health and Family Welfare and Ministry of AYUSH (through CCRYN), government of India for funding the project (grant number: 16‐63/2016‐17/CCRYN/RES/Y&D/MCT/ dated 15.12.2016) and Indian Yoga Association (IYA) for overall project implementation. We would also like to thank Divya Dwivedi, Diksha Puri and Debopriya Basu for validating the data.
Kumar S, Anand A, Nagarathna R, et al. Prevalence of prediabetes, and diabetes in Chandigarh and Panchkula region based on glycated haemoglobin and Indian diabetes risk score. Endocrinol Diab Metab.2021;4:e00162 10.1002/edm2.162
Contributor Information
Akshay Anand, Email: akshay1anand@rediffmail.com.
Raghuram Nagarathna, Email: akshay1anand@rediffmail.com, Email: rnagaratna@gmail.com.
DATA AVAILABILITY STATEMENT
All the associated data is available within the article in the form of table/figure/supplementary file.
REFERENCES
- 1. Bozkaya G, Ozgu E, Karaca B. The association between estimated average glucose levels and fasting plasma glucose levels. Clinics. 2010;65(11):1077‐1080. [DOI] [PMC free article] [PubMed] [Google Scholar]
- 2. Sandler CN, McDonnell ME. The role of hemoglobin A1c in the assessment of diabetes and cardiovascular risk. Cleve Clin J Med. 2016;83(suppl 1):S4‐S10. [DOI] [PubMed] [Google Scholar]
- 3. Kramer CK, Araneta MRG, Barrett‐Connor E. A1C and diabetes diagnosis: the Rancho Bernardo Study. Diabetes Care. 2010;33(1):101‐103. [DOI] [PMC free article] [PubMed] [Google Scholar]
- 4. Pal DK, Bhalla A, Bammidi S, et al. Can yoga‐based diabetes management studies facilitate integrative medicine in india current status and future directions. Integr Med Int. 2017;4(3–4):125‐141. [Google Scholar]
- 5. Droumaguet C, Balkau B, Simon D, et al. Use of HbA1c in predicting progression to diabetes in French men and women: data from an epidemiological study on the insulin resistance syndrome (DESIR). Diabetes Care. 2006;29(7):1619‐1625. [DOI] [PubMed] [Google Scholar]
- 6. American Diabetes A . Diagnosis and classification of diabetes mellitus. Diabetes Care. 2010;33(Suppl 1), S62‐S69. [DOI] [PMC free article] [PubMed] [Google Scholar]
- 7. Sherwani SI, Khan HA, Ekhzaimy A, et al. Significance of HbA1c test in diagnosis and prognosis of diabetic patients. Biomark Insights. 2016;11:S38440. [DOI] [PMC free article] [PubMed] [Google Scholar]
- 8. Joshi SR. Diabetes care in India. Ann Glob Health. 2015;81(6):830‐838. [DOI] [PubMed] [Google Scholar]
- 9. Tripathy JP, Thakur JS, Jeet G, et al. Prevalence and risk factors of diabetes in a large community‐based study in North India: results from a STEPS survey in Punjab, India. Diabetol Metab Syndr. 2017;9(1):8. [DOI] [PMC free article] [PubMed] [Google Scholar]
- 10. Federation, I.D. IDF SEA members . 2020. [cited 2020 5 January]; Available from: https://idf.org/our‐network/regions‐members/south‐east‐asia/members/94‐india.html
- 11. Pradeepa R, Mohan V. Prevalence of type 2 diabetes and its complications in India and economic costs to the nation. Eur J Clin Nutr. 2017;71(7):816. [DOI] [PubMed] [Google Scholar]
- 12. Tandon N, Anjana RM, Mohan V, et al. The increasing burden of diabetes and variations among the states of India: the Global Burden of Disease Study 1990–2016. Lancet Glob Health. 2018;6(12):e1352‐e1362. [DOI] [PMC free article] [PubMed] [Google Scholar]
- 13. Sharma NC. Government survey found 11.8% prevalence of diabetes in India. Livemint. 2019. https://www.livemint.com/science/health/government‐survey‐found‐11‐8‐prevalence‐of‐diabetes‐in‐india‐11570702665713.html [Google Scholar]
- 14. Tabak AG, Herder C, Rathmann W, et al. Prediabetes: a high‐risk state for developing diabetes. Lancet. 2012;379(9833):2279. [DOI] [PMC free article] [PubMed] [Google Scholar]
- 15. Heianza Y, Hara S, Arase Y, et al. HbA1c 5· 7–6· 4% and impaired fasting plasma glucose for diagnosis of prediabetes and risk of progression to diabetes in Japan (TOPICS 3): a longitudinal cohort study. Lancet. 2011;378(9786):147‐155. [DOI] [PubMed] [Google Scholar]
- 16. Acharya AS, Singh A, Dhiman B. Assessment of diabetes risk in an adult population using Indian diabetes risk score in an urban resettlement colony of Delhi. J Assoc Physicians India. 2017;65:46‐51. [PubMed] [Google Scholar]
- 17. Mohan V, Deepa R, Deepa M, et al. A simplified Indian Diabetes Risk Score for screening for undiagnosed diabetic subjects. J Assoc Physicians India. 2005;53:759‐763. [PubMed] [Google Scholar]
- 18. Weber MB, Ranjani H, Staimez LR, et al. The stepwise approach to diabetes prevention: results from the D‐CLIP randomized controlled trial. Diabetes Care. 2016;39(10):1760‐1767. [DOI] [PMC free article] [PubMed] [Google Scholar]
- 19. Nagendra HR, Nagarathna R, Rajesh SK, et al. Niyantrita Madhumeha Bharata 2017, methodology for a nationwide diabetes prevalence estimate: Part 1. Int J Yoga. 2019;12(3):179‐192. [DOI] [PMC free article] [PubMed] [Google Scholar]
- 20. Nagarathna R, Rajesh SK, Amit S, et al. Methodology of Niyantrita Madhumeha Bharata Abhiyaan‐2017, a nationwide multicentric trial on the effect of a validated culturally acceptable lifestyle intervention for primary prevention of diabetes: Part 2. Int J Yoga. 2019;12(3):193‐205. [DOI] [PMC free article] [PubMed] [Google Scholar]
- 21. Thakkar UG, Trivedi HL, Vanikar AV, et al. Insulin‐secreting adipose‐derived mesenchymal stromal cells with bone marrow–derived hematopoietic stem cells from autologous and allogenic sources for type 1 diabetes mellitus. Cytotherapy. 2015;17(7):940‐947. [DOI] [PubMed] [Google Scholar]
- 22. Dudeja P, Singh G, Gadekar T, Mukherji S. Performance of Indian diabetes risk score (IDRS) as screening tool for diabetes in an urban slum. Med J Armed Forces India. 2017;73(2):123‐128. [DOI] [PMC free article] [PubMed] [Google Scholar]
- 23. Rohlfing CL, Wiedmeyer HM, Little RR, et al. Defining the relationship between plasma glucose and HbA1c: analysis of glucose profiles and HbA1c in the diabetes control and complications trial. Diabetes Care. 2002;25(2):275‐278. [DOI] [PubMed] [Google Scholar]
- 24. Khan H, Sobki S, Khan S. Association between glycaemic control and serum lipids profile in type 2 diabetic patients: HbA 1c predicts dyslipidaemia. Clin Exp Med. 2007;7(1):24‐29. [DOI] [PubMed] [Google Scholar]
- 25. Farbstein D, Levy AP. HDL dysfunction in diabetes: causes and possible treatments. Expert Rev Cardiovasc Ther. 2012;10(3):353‐361. [DOI] [PMC free article] [PubMed] [Google Scholar]
- 26. Haase CL, Tybjærg‐Hansen A, Nordestgaard BG, et al. HDL cholesterol and risk of type 2 diabetes: a Mendelian randomization study. Diabetes. 2015;64(9):3328‐3333. [DOI] [PubMed] [Google Scholar]
- 27. Anjana RM, Deepa M, Pradeepa R, et al. Prevalence of diabetes and prediabetes in 15 states of India: results from the ICMR–INDIAB population‐based cross‐sectional study. Lancet Diabetes Endocrinol. 2017;5(8):585‐596. [DOI] [PubMed] [Google Scholar]
- 28. Ravikumar P, Bhansali A, Ravikiran M, et al. Prevalence and risk factors of diabetes in a community‐based study in North India: the Chandigarh Urban Diabetes Study (CUDS). Diabetes Metab. 2011;37(3):216‐221. [DOI] [PubMed] [Google Scholar]
- 29. Centre, H.a.T.M .Tobacco Control in India. 2004: New Delhi.
Associated Data
This section collects any data citations, data availability statements, or supplementary materials included in this article.
Supplementary Materials
Table S1
Data Availability Statement
All the associated data is available within the article in the form of table/figure/supplementary file.