Abstract
In the hospital, because of the rise in cases daily, there are a small number of COVID-19 test kits available. For this purpose, a rapid alternative diagnostic choice to prevent COVID-19 spread among individuals must be implemented as an automatic detection method. In this article, the multi-objective optimization and deep learning-based technique for identifying infected patients with coronavirus using X-rays is proposed. J48 decision tree approach classifies the deep feature of corona affected X-ray images for the efficient detection of infected patients. In this study, 11 different convolutional neural network-based (CNN) models (AlexNet, VGG16, VGG19, GoogleNet, ResNet18, ResNet50, ResNet101, InceptionV3, InceptionResNetV2, DenseNet201 and XceptionNet) are developed for detection of infected patients with coronavirus pneumonia using X-ray images. The efficiency of the proposed model is tested using k-fold cross-validation method. Moreover, the parameters of CNN deep learning model are tuned using multi-objective spotted hyena optimizer (MOSHO). Extensive analysis shows that the proposed model can classify the X-ray images at a good accuracy, precision, recall, specificity and F1-score rates. Extensive experimental results reveal that the proposed model outperforms competitive models in terms of well-known performance metrics. Hence, the proposed model is useful for real-time COVID-19 disease classification from X-ray chest images.
Communicated by Ramaswamy H. Sarma
Keywords: Coronavirus, COVID-19, MOSHO, CNN, J48, deep learning, optimization
1. Introduction
Novel coronavirus (COVID-19) pandemic began in Wuhan, China in December 2019 and has become a significant public health issue worldwide (Roosa et al., 2020; Yan et al., 2020). The COVID-19 pandemic virus was also called severe acute respiratory syndrome-coronaviruses (SARS-CoV)-2 (Stoecklin et al., 2020), as an extreme acute coronavirus syndrome. CoV are an important family of viruses that cause conditions caused by residues such as Middle East respiratory syndrome (MERS-CoV) and SARS-CoV. The new species coronavirus disease (COVID-19) was discovered in 2019 and has never been observed in humans before. The zoonotic coronaviruses are caused by animal-to-human contamination (World Health Organization, 2020). Studies have shown that the SARS-CoV is contaminated by the musk cats in human beings and the MERS-CoV is contaminated by the dromedary in human beings [Huang et al., 2020]. Table 1 displays the description of the coronavirus, mortality rate and its origin.
Table 1.
Detail of coronavirus.
| CoV | Year | Origin | Mortality rate |
|---|---|---|---|
| SARS | 2002 | Guangdong province, China | 10% |
| MERS | 2013 | Saudi Arabia | 34% |
| COVID-19 | 2019 | Wuhan, China | 3.4% |
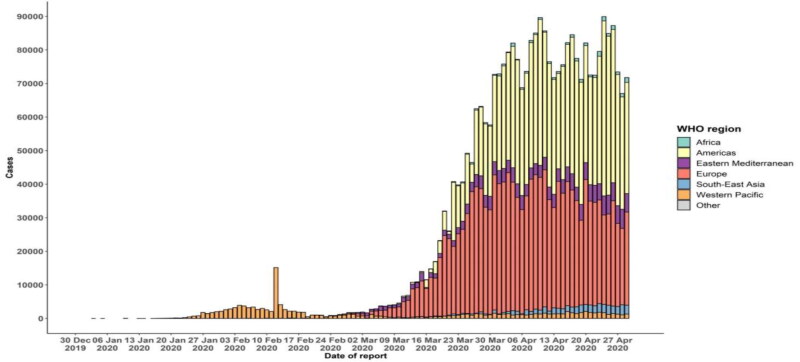
The rapid spread of the disease has been triggered by respiratory transmission from person to person. Respiratory symptoms, fatigue, cough and dyspnea include signs of infection. Extreme acute respiratory syndromes, the septic shock, multi-organ failure and death will lead to infection with the disease more seriously (Mahase, 2020). Men were found to be sicker than women and children between the ages of 0-–9 had no death (Mckeever, 2020). Respiratory levels have been shown to be higher in cases of COVID-19 pneumonia, than in people with health (Wang et al., 2020b). The health system has come to a standstill even in many developing countries because of the growing demand simultaneously for intensive care facilities. Figure 1 shows the worldwide distribution of COVID-19 cases from 30 December 2019 to 30 April 2020 (https://www.who.int/emergencies/diseases/novel-coronavirus-2019/situation-reports; Situation Report #101).
Figure 1.
Epidemic curve of confirmed COVID-19 provided by WHO.
COVID-19 diagnosis as a key indicator for reverse transcription polymerase or hospitalization should be confirmed stated by the Chinese government, by gene sequencing for respiratory or blood samples. The current public health emergency causes the low sensitivity of the reverse transcription-polymerase chain reactionto hinder the identification and care of many COVID-19 patients. Moreover, because of the highly contagious nature of the virus, a larger population is at risk of infection (Ai et al., 2020). The diagnoses now include all the individuals that show the popular chest pneumonia pattern COVID-19 instead of the patients that wait for positive virus tests. This approach helps authorities to separate and treat patients faster. Some patients recover with permanent lung failure even though death does not occur at COVID-19. COVID-19 also opens holes in the lungs like the SARS according to the World Health Organization, giving them a 'honeycomb-like look' (Mckeever, 2020). One of the approaches used to treat pneumonia is the computed chest tomography (CT). Automated image analysis tools for the identification, quantification and surveillance of corona virus were developed based on artificial intelligence (AI) and to distinguish between patients with coronavirus and disease-free (Gozes et al., 2020). In the research by Shan et al. (2020) , a deep learning system was built to automatically segment all lung and infection places using chest CT. Xu et al. (2020) aimed at developing an early model for the identification, using CT images and in-depth education techniques, of COVID-19 pneumonia and influenza-A viral pneumonia in a stable case. In the Wang et al. (2020a) study, they developed a deep learning method based on the COVID-19 radiographic changes of images taken from the CT that can draw out the graphical characteristics of COVID-19 before pathogenic testing, thus saving crucial time for the diagnosis of the disease. Hamimi's study (Hamimi, 2016) of MERS CoV showed that features such as pneumonia can be present in the chest X-ray and CT. Data mining techniques were used in the Xie et al. (2006) research to distinguish between SARS and traditional pneumonia based on X-ray images. In 41 COVID-19 patients, Huang et al. (2020) described the clinical characteristics, which suggest that cough, strong, myalgia or fatigue were typical onset symptoms. Pneumonia was found for all these 41 patients, and the chest CT examination was anomalous. The first evidence for human-to-human COVID-19 transmission was discovered at the University of Hong Kong by the Kok-KH team (Chan et al., 2020). In order, to estimate the actual number of cases identified in COVID-19 in the first half of January 2020, Zhao et al. (2020) suggested a statistical model. They concluded that from 1–15 January 2020 the number of cases were 469 that were not registered. They also reported that the cases increased 21-fold after 17 January 2020. Nishiura et al. (2020) proposed a COVID-19 infection rate prediction model in Wuhan, China using data from 565 Japanese people evacuated from Wuhan, on 29–31 January 2020. Their inference is that the projected rate is 9.5% and the mortality rate is 0.3%–0.6%. The number of Japanese people evacuated from Wuhan, however, is small and inadequate to estimate infection and death. In order, to determine the probability of transmission for COVID-19, Tang et al. (2020) suggested a mathematical model. In seven days (23–29 January 2020), it also estimated the number of confirmed cases. In addition, after two weeks (from 23 January 2020) they predicted the optimum to be reached. Data from the study of Thompson (2020) were used for the estimation of sustained human-to-human transmission of COVID-19 from 47 patients. In the study by Jung et al. (2020), the authors provided a model of the COVID-19 estimate of risk of death. The figures are 5.1%and 8.4 % for two separate scenarios. The reproductive number was also estimated as 2.1 and 3.2 for the two scenarios. The estimates showed that a pandemic could occur with COVID-19. X-ray technology are used to scan the affected body for fractures, dislocation of the bone, lung infections, pneumonia and tumors. CT scanning is a sort of state-of-the-art X-ray system that examines the incredibly soft nature of the active body part and clearer pictures of soft internal tissues and organs (Rachana, 2020). X-rays are quicker, safer, more reliable and less dangerous than CT. If pneumonia COVID-19 is not quickly recognized and treated, mortality can rise.
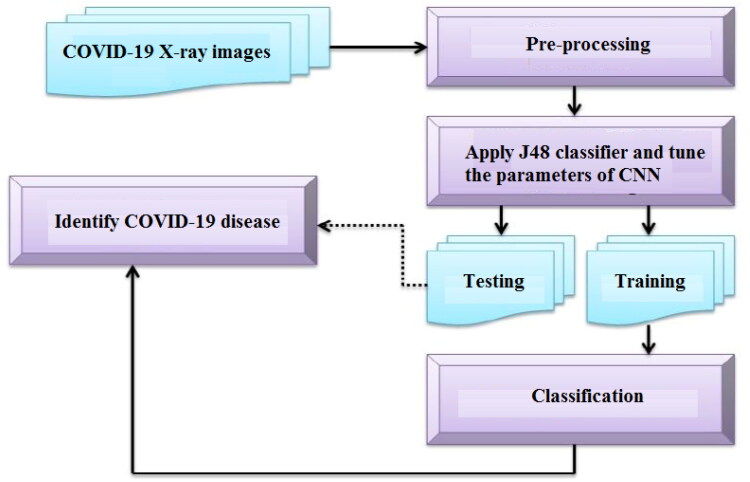
In this research, we proposed an automated COVID-19 prediction using a pre-trained transmission model and chest X-ray image based on a deep convolution network (CNN). For experimentation, the chest X-ray of 50 COVID-19 patients is taken from the open source GitHub repository shared by Joseph et al. (2020). This dataset is used as a deep feature extractor based on deep learning architectures like AlexNet, VGG16, VGG19, GoogleNet, ResNet18, ResNet50, and ResNet101. The deep functionality of these profound models is graded according to the J48 algorithm. The deep learning models are suffering from the parameter tuning. To remove this problem, multi-objective algorithm (Dhiman & Kumar, 2018b) was used for efficient tuning the parameters of CNN model. Finally, effects of success were tested using methods of deep feature extraction (Figure 2).
Figure 2.
COVID-19 classification approach.
The rest of this article is structured as follows: Section 2 presents the optimization process used in this research. In Sections 3 and 4, deep learning and J48 models are discussed. The data set description is given in Section 5 followed by the performance metrics in Section 6. Experimental results and discussions are presented in Section 7. Finally, conclusions and future works are given in Section 8.
2. Optimization
In this article, the multi-objective version of spotted hyena optimizer (SHO) (Dhiman & Kumar, 2017) algorithm is used to investigate the further parameters of deep-learning models. There are four steps for SHO algorithm for optimization such as encircling, hunting, attacking and searching. In multi-objective SHO (MOSHO) algorithm (Dhiman & Kumar, 2018b), archive and grid mechanisms are used. Further to update the search agents, group selection method is employed for better exploration and exploitation. This algorithm is used to tune the parameters of CNN model. MOSHO pseudo code is described in Algorithm 1.
3. Deep learning method
Deep learning is a sub-branch of machine learning that is affected by a structure of the brain. In recent years, profound methods of learning used for the treatment of medical images remain effective in many fields such as image and signal processing using image technology including magnetic resonance imaging, computational tomography (CT) and X-rays using deep learning models. These tests promote the detection and diagnosis of illnesses including diabetes mellitus, brain tumor, skin cancer and breast cancer (Celik et al., 2020; Yildirim et al., 2019).
Algorithm 1.Multi-objective spotted hyena optimizer (MOSHO).
Input: Spotted hyenas population, Pi(i = 1,2,….,n)
Output: Archive of non-dominated optimal solutions
1: Procedure: MOSHO
2: Initialize the vectors h,B,E, and N
3: Calculate the objective values of each search agent
4: Find all the non-dominated solutions and initialize these solutions to archive
5: Ph= best search agent from archive
6: Ch= group or cluster of all far optimal solutions with respect to Ph (archive)
7: while (x < MaxIteration)do
8: for each search agent do
9: Update the position of current search agents
10: end for
11: Update h,B,E and N
12: Calculate the objective values of all search agents
13: Find the non-dominated solutions from updated search agents
14: Update the obtained non-dominated solutions to archive
15: if archive is full then
16: Grid method should be run to omit one of the most crowded archive members
17: Add new solutions to archive
18: end if
19: Check if any search agent goes beyond the search space and then adjust it
20: Calculate the objective values of each search agent
21: Update Ph if there is a better a solution than the previous optimal solution from archive
22: Update the group Ch with respect to Ph (archive)
23: x = x + 1
24: end while
25: return archive
26: end procedure
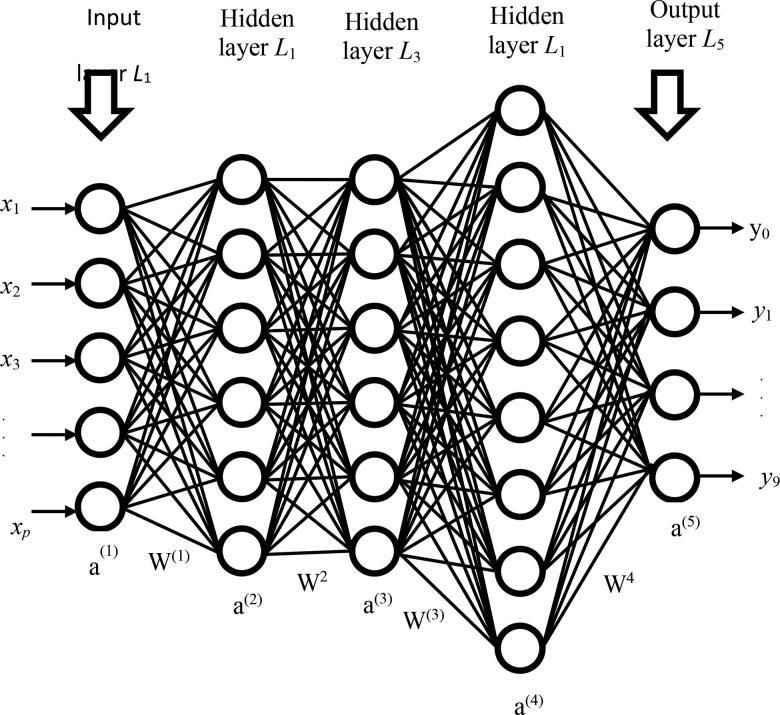
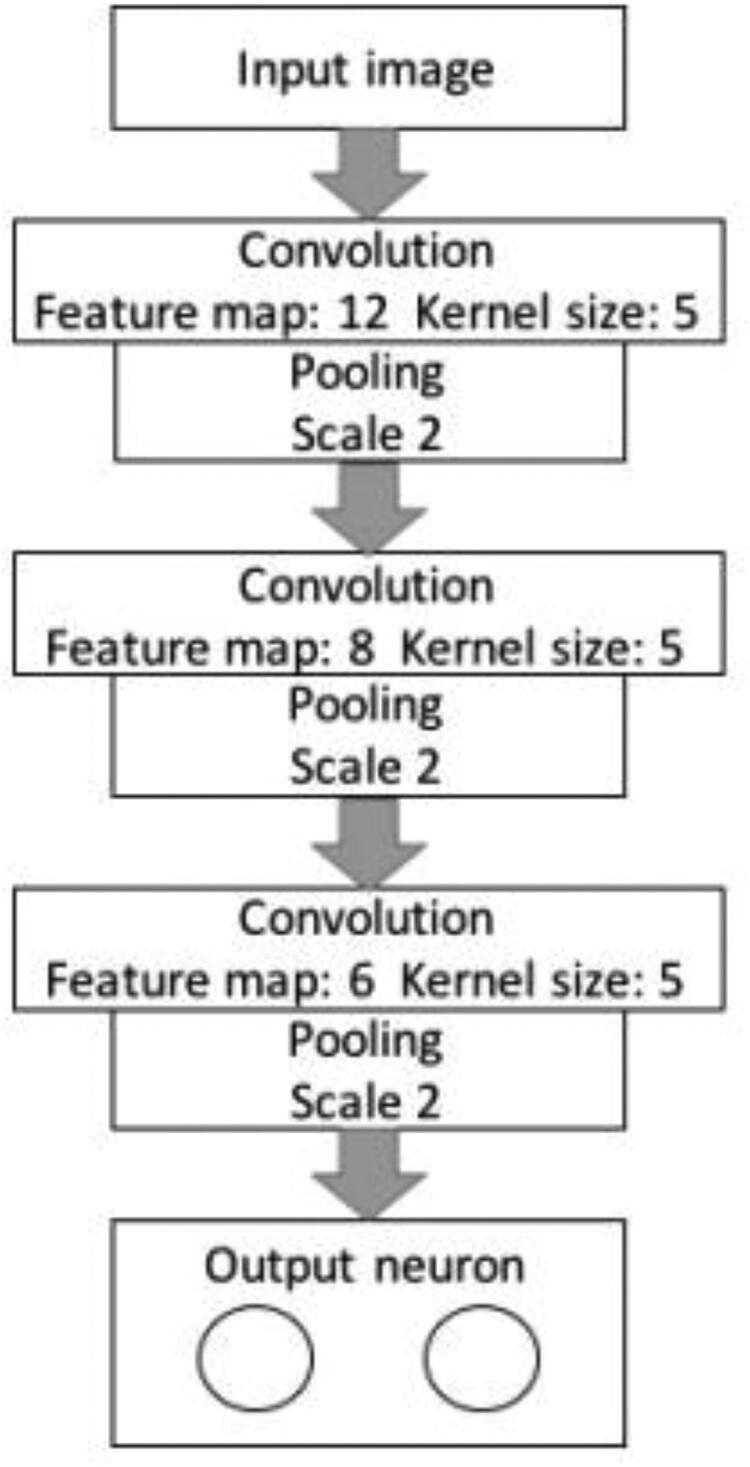
Convolutional neural networks (see Figure 3) are inspired by the human neuron system that are similar to classic neural networks. Every odd number layer is a convolution layer, each even number layer is a pooling layer and sub-sampling layer, excluding input and outcome layer (Huang et al., 2020; Mahase, 2020). The CNN's architecture comprises eight different layers. We have used 12, eight and six characteristics for each convolution and all of them are linked with pool layers by five kernels. The batch size was set to 100 and the sample limit to 100 epochs was one. The architecture of CNN is shown in Figure 4.
Figure 3.
Neural network.
Figure 4.
Architecture of CNN.
4. Decision tree (J48 algorithm)
Decision trees are supervised algorithms for classification or regression applications. J48 is chosen for COVID-19 recognition by popularity and accuracy in results from the decision tree algorithms family. This is an Iterative Dichotomiser 3(ID3) extension.The additional features of J48 include: (a) rules derivation, (b) trees pruning, (c) incomplete accounts and (d) attributes meaning continuously and so on. The study of data continuously and categorically is one of the best grading algorithms. The main goal is to divide the data into a homogeneous class, to predict the variables as much as possible. J48 permits classification on the basis either of rules created or of a decision-tab. It aims at minimizing impurity or data instability. For the management of continuous attributes, the list of attributes is separated by a threshold and the list is separated into those that have value below and value below or equal to threshold. But it labelled as‘?’ for missing values. In entropy and gain calculation these missing values were not included.
The algorithm is a collection of (classified) data from training. On this basis, a decision tree is generated as an output where each leaf node represents a decision, and a test is a non-leaf node. After all the root node to leaf node test paths have been checked, a leaf node will be shown whether or not the variable belongs. After creating the tree, the tree is used to identify the tuple data in any tuple of the database. J48 does not know the missing values when constructing a tree. In other documents, the values of this object can be calculated by the known value of the attribute. Thus, the classification model creates a top-down forest. It uses uniform data division parameters. Each attribute's information gain is calculated according to entropy. For decision making, the most standardized attribute is selected. After this, a root of the next recurrently constructed subtrees is chosen for the best attribute.
5. Data set description
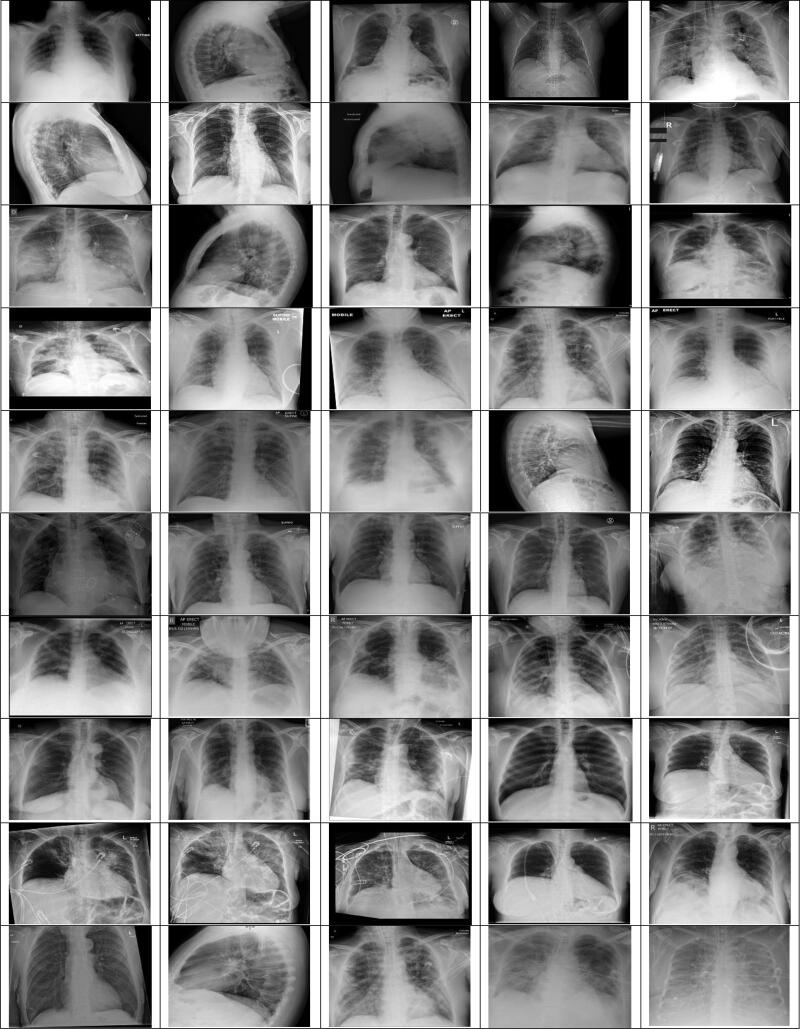
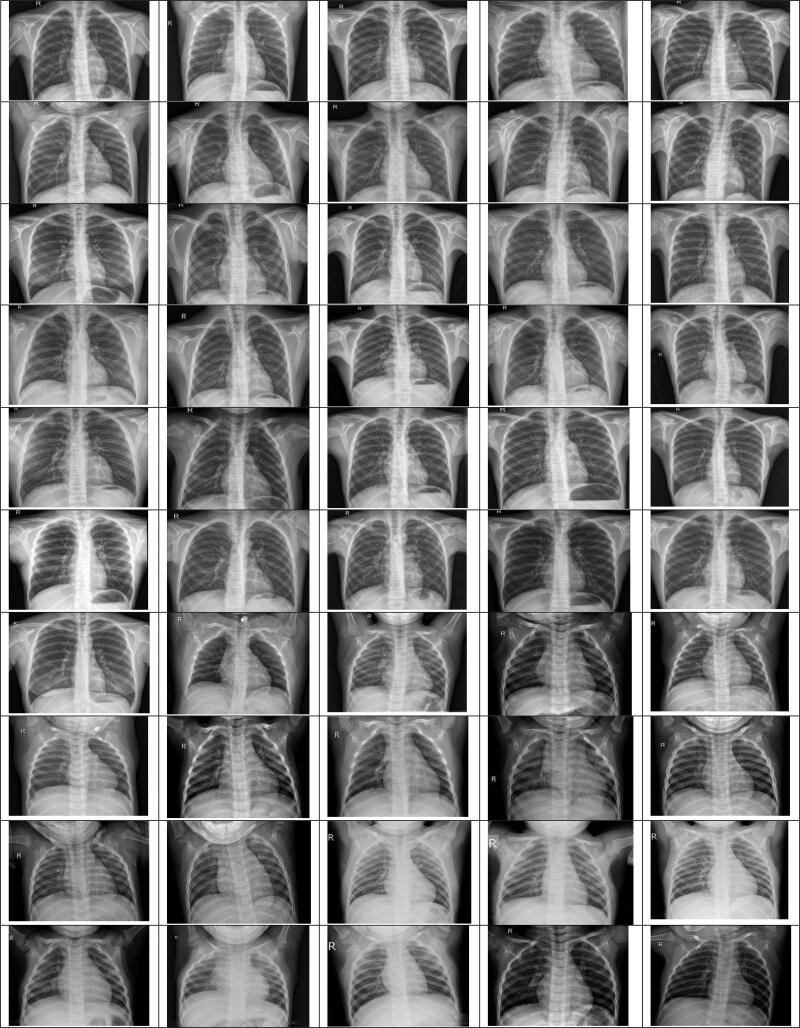
During this study, the GitHub opensource repository provided by Joseph et al. (2020) was taken with the chest X-ray images of 50 COVID-19 patients. This archive consists of chest X-ray/CT images, most of which are of patients with acute respiratory distress syndrome (ARDS), COVID-19, MERS, pneumonia, and SARS. Moreover, from the Kaggle repository named "Pneumonia" (Paul, 2019), 50 normal X-ray images of the chest have been used. Our studies were carried out using a chest X-ray image dataset from 50 normal patients (Paul, 2019) and 50 COVID-19 patients (Joseph et al., 2020). In this dataset, all images have been restated to a scale of 280 × 280 pixels. Figures 5 and 6 display the chest X-ray images of COVID-19 and normal patients.
Figure 5.
X-ray images of coronavirus (COVID-19) disease effected patients.
Figure 6.
X-ray images of normal patients.
In this study we have developed AlexNet, VGG16, VGG19, GoogleNet, ResNet18, ResNet50, ResNet101, InceptionV3, InceptionResNetV2, DenseNet201 and XceptionNet deep CNN for the classification of COVID-19 chest X-ray image into the normal class and COVID-19. The deep characteristics are extracted from the fully linked layer and feed for training purposes to the classifier. To prove the convergence of a model on limited test data set, the proposed CNN is evaluated on k-fold cross-validation (i.e. k = 5 and k = 10 folds). In this paper, J48 decision tree classifier is used for deep features obtained from every CNN network. The classification is then carried out and the performance of all models of classification is measured. A specific layer eliminates the profound characteristics of CNN models and offers functionality. The characteristics are supplied to the J48 classifier for the detection of COVID-19 diseases. Table 2 describes the characteristic layer and vector.
Table 2.
Feature layer and feature vector characteristics of CNN models.
| CNN models | Feature layer | Feature vector |
|---|---|---|
| AlexNet | fc6 | 4096 |
| Vgg16 | fc6 | 4096 |
| Vgg19 | fc6 | 4096 |
| Xception | Predictions | 1000 |
| Resnet18 | Fc1000 | 1000 |
| Resnet50 | Fc1000 | 1000 |
| Resnet101 | Fc1000 | 1000 |
| Inceptionv3 | Predictions | 1000 |
| Inceptionresnetv2 | Predictions | 1000 |
| GoogleNet | Loss3-classifier | 1000 |
| Densenet201 | Fc1000 | 1000 |
6. Performance metrics
The five well-known performance metrics such as accuracy, recall, specificity, precision, and F1-score are employed in this article to check the performance of deep learning models.
7. Experimental results and discussions
In this analysis, we analyzed the efficiency of COVID-19 recognition classification models based on the eleven CNN models. The research studies are conducted with software of MATLAB 2019a version. All applications are run on a Microsoft Windows environment Core i7 8th Generation and 8 GB main memory. The well-known performance metrics are used for each classifier such as accuracy, recall, specificity, precision and F1-score. Table 3 results are based on k-fold cross validation (k = 5) and average of 50 independent simulations. The training, validation and test ratio for each execution is 60:20:20 and the random selection are modified for training, validation and testing.
Table 3.
The obtained results on different models for k = 5 using performance metrics.
| Models | Accuracy (%) | Recall (%) | Specificity (%) | Precision (%) | F1-score (%) |
|---|---|---|---|---|---|
| AlexNet | 94.79 | 93.88 | 89.68 | 95.18 | 90.21 |
| DenseNet201 | 90.56 | 92.92 | 94.20 | 97.85 | 86.08 |
| GoogleNet | 88.89 | 93.38 | 91.11 | 95.12 | 94.85 |
| Inceptionv3 | 96.40 | 89.25 | 93.32 | 89.28 | 94.11 |
| ResNet18 | 87.28 | 89.13 | 94.75 | 95.91 | 94.07 |
| ResNet50 | 94.55 | 88.19 | 91.73 | 98.28 | 90.69 |
| ResNet101 | 97.18 | 98.64 | 95.86 | 98.64 | 97.05 |
| VGG16 | 96.51 | 89.05 | 95.78 | 94.80 | 95.85 |
| VGG19 | 88.86 | 88.63 | 89.01 | 96.58 | 91.04 |
| XceptionNet | 88.74 | 94.11 | 91.25 | 89.18 | 89.19 |
| Inceptionresnetv2 | 96.81 | 91.22 | 95.58 | 93.75 | 92.13 |
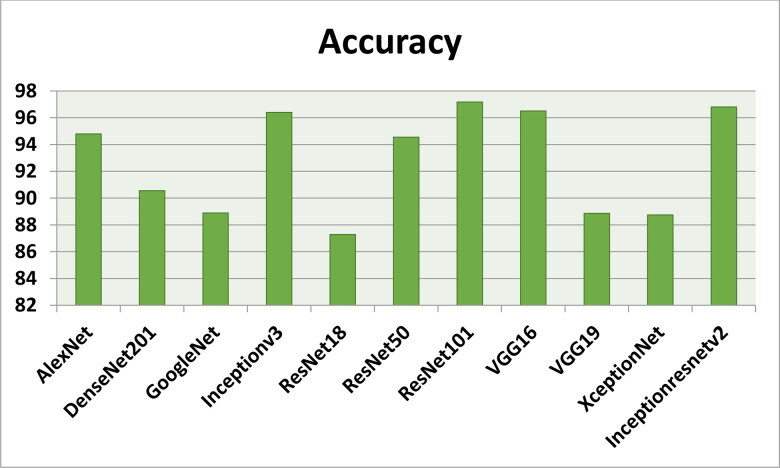
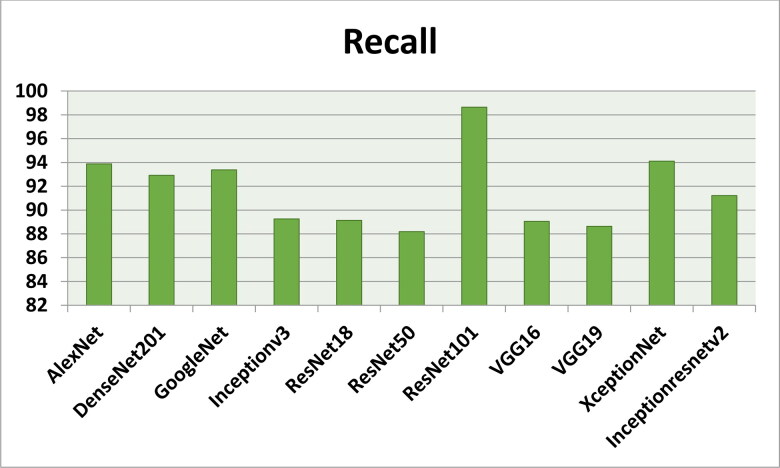
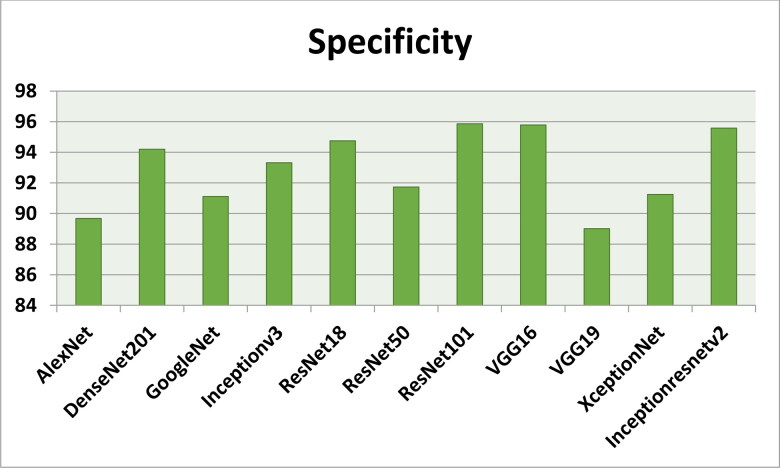
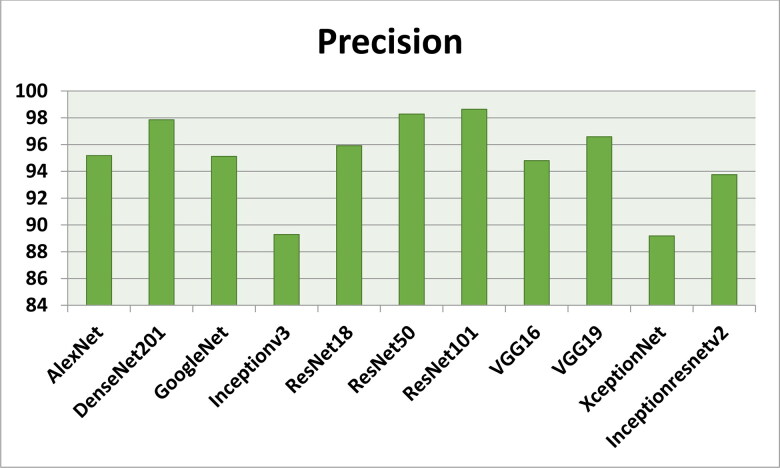
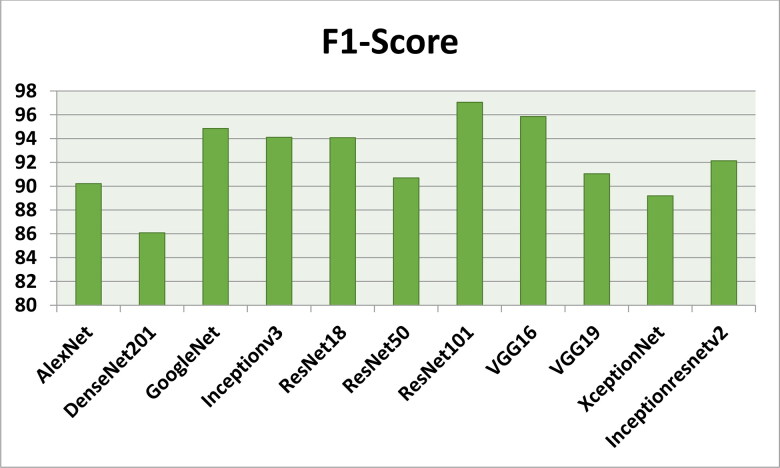
Figures 7–11 show the performance metrics values of different models. It is observed from results that the accuracy of ResNet101 plus J48 is superior to other classification models in terms of accuracy, recall, specificity, precision, and F1-score performance metrics for k = 5 fold cross validation. Hence, Resnet101 and J48 based CNN method result better classification for detection of COVID-19 with accuracy, recall, specificity, precision, and F1-score are 97.18%, 98.64%, 95.86%, 98.64%, and 97.05%, respectively.
Figure 7.
The accuracy results using different classification models for k = 5.
Figure 8.
The recall results using different classification models for k = 5.
Figure 9.
The specificity results using different classification models for k = 5.
Figure 10.
The precision results using different classification models for k = 5.
Figure 11.
The F1-Score results using different classification models for k = 5.
Table 4 results are based on k-fold cross validation (k = 10) and average of 50 independent simulations. The training, validation and test ratio for each execution is 60:20:20 and the random selection are modified for training, validation and testing.
Table 4.
The obtained results on different models for k = 10 using performance metrics.
| Models | Accuracy (%) | Recall (%) | Specificity (%) | Precision (%) | F1-score (%) |
|---|---|---|---|---|---|
| AlexNet | 97.82 | 96.91 | 92.71 | 98.21 | 93.24 |
| DenseNet201 | 93.59 | 95.95 | 97.23 | 100 | 89.11 |
| GoogleNet | 91.92 | 96.41 | 94.14 | 98.15 | 97.88 |
| Inceptionv3 | 99.43 | 92.28 | 96.35 | 92.31 | 97.14 |
| ResNet18 | 90.31 | 92.16 | 97.78 | 98.94 | 97.10 |
| ResNet50 | 97.58 | 91.22 | 94.76 | 98.31 | 93.72 |
| ResNet101 | 100 | 100 | 98.89 | 100 | 100 |
| VGG16 | 99.54 | 92.08 | 98.81 | 97.83 | 98.88 |
| VGG19 | 91.89 | 91.66 | 92.04 | 99.61 | 94.07 |
| XceptionNet | 91.77 | 97.14 | 94.28 | 92.21 | 92.22 |
| Inceptionresnetv2 | 99.84 | 94.25 | 98.61 | 96.78 | 95.16 |
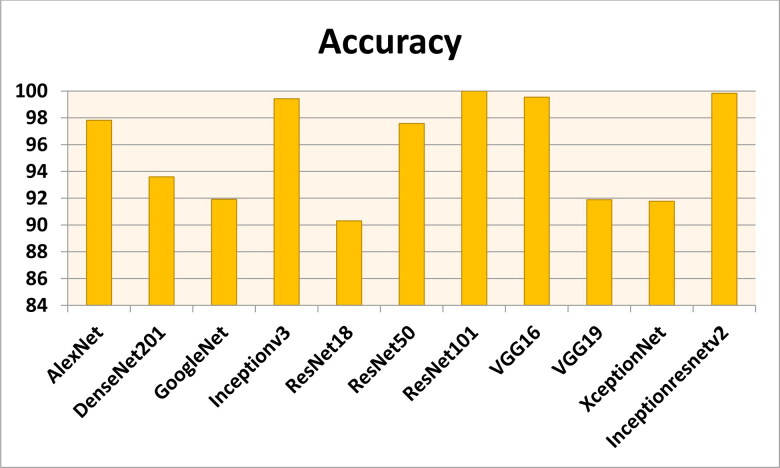
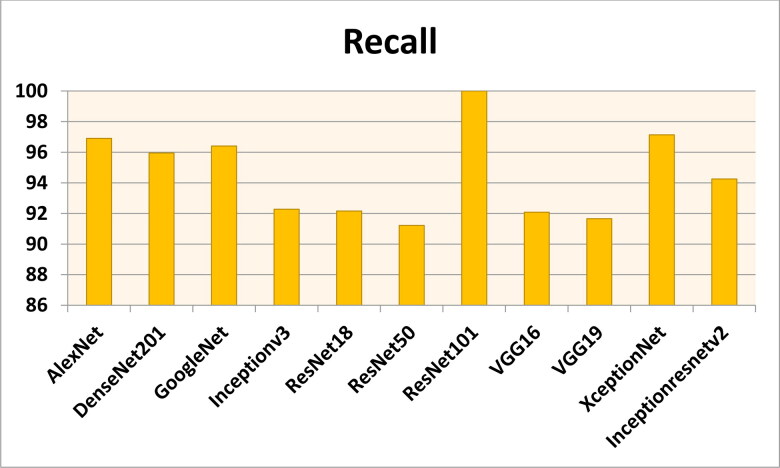
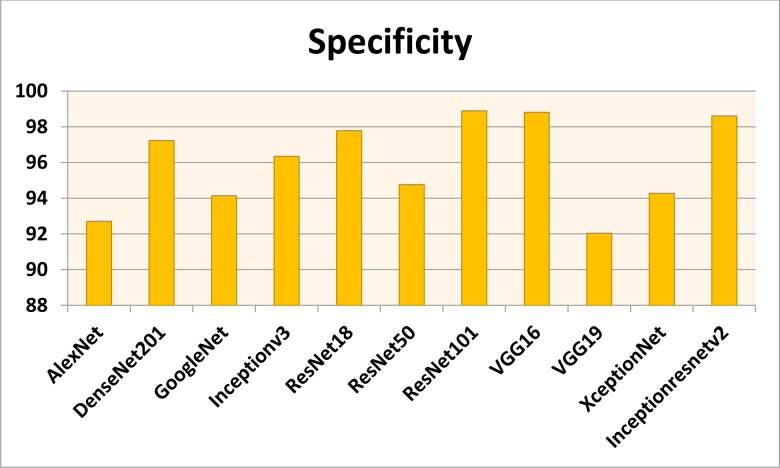
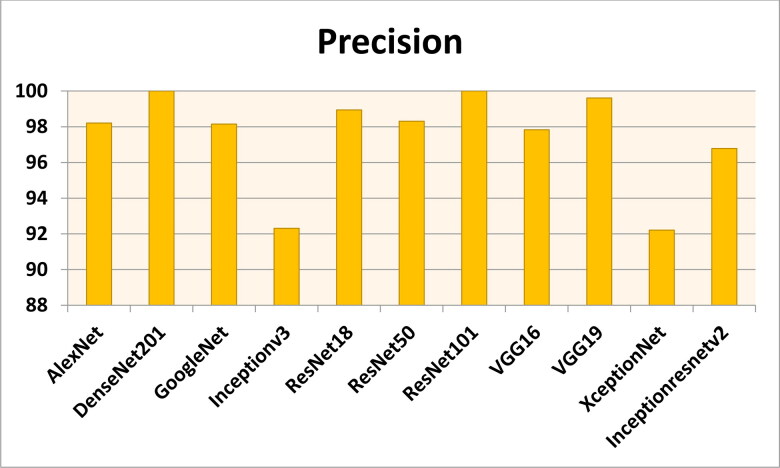
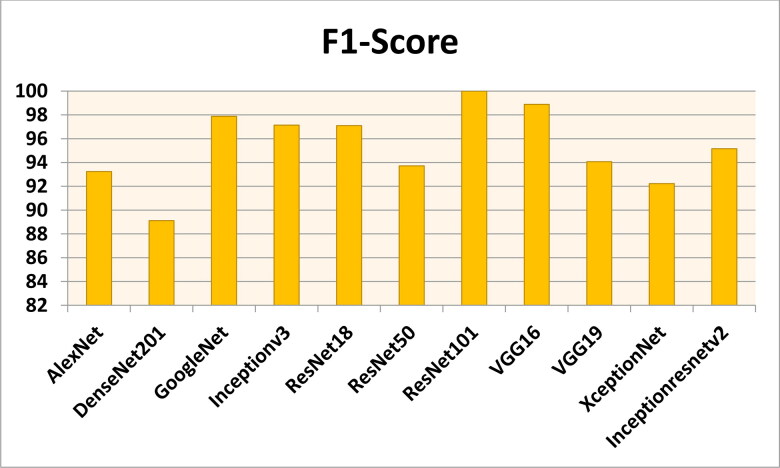
Figures 12–16 show the performance values of metrics on different models. It is observed from results that the accuracy of ResNet101 plus J48 is superior to other competitor classification models in terms of accuracy, recall, specificity, precision, and F1-score performance metrics for k = 10 fold cross validation. Resnet101 and J48 based CNN method result is superior for detection of COVID-19 disease with accuracy, recall, specificity, precision, and F1-score are 100%, 100%, 98.89%, 100%, and 100%, respectively.
Figure 12.
The accuracy results using different classification models for k = 10.
Figure 13.
The recall results using different classification models for k = 10.
Figure 14.
The specificity results using different classification models for k = 10.
Figure 15.
The precision results using different classification models for k = 10.
Figure 16.
The F1-score results using different classification models for k = 10.
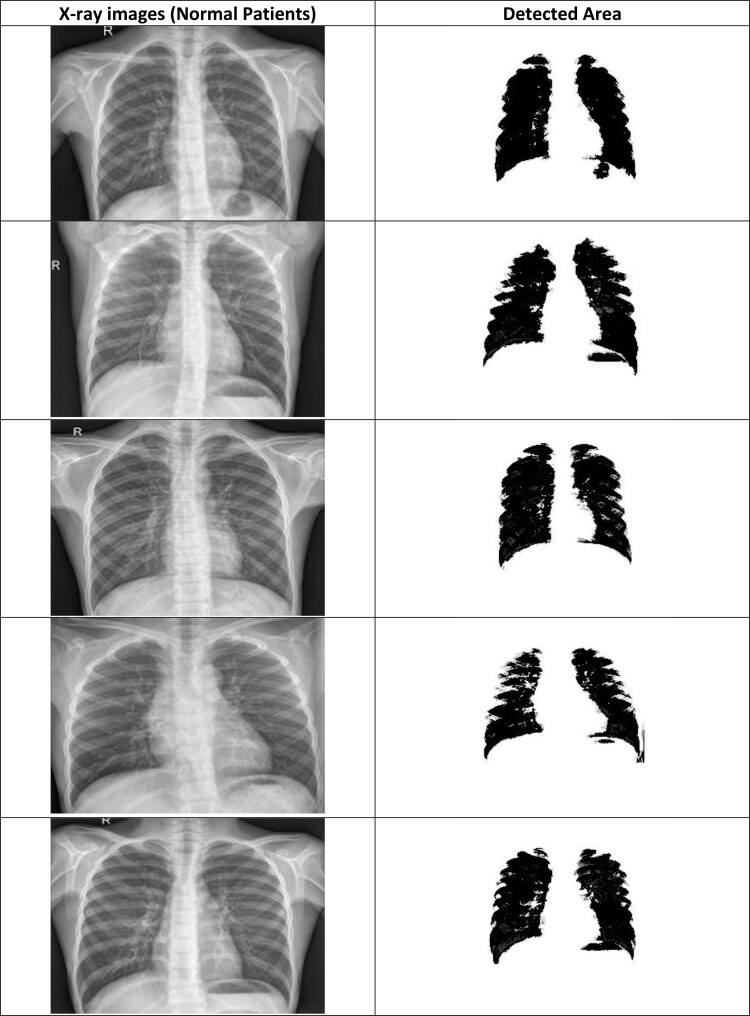
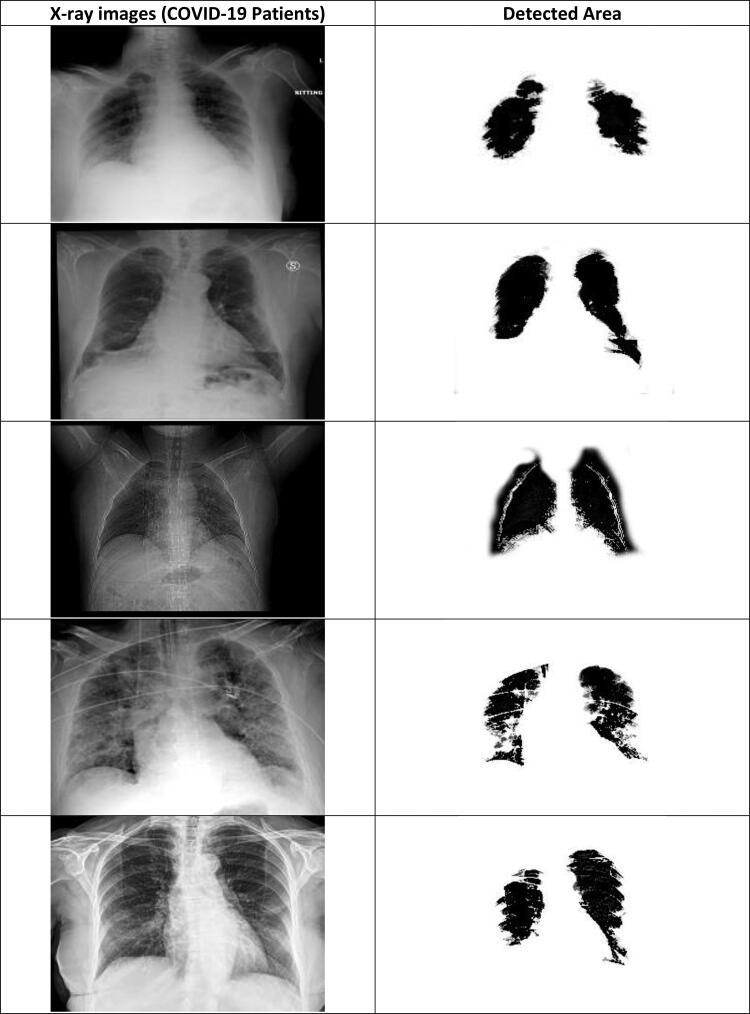
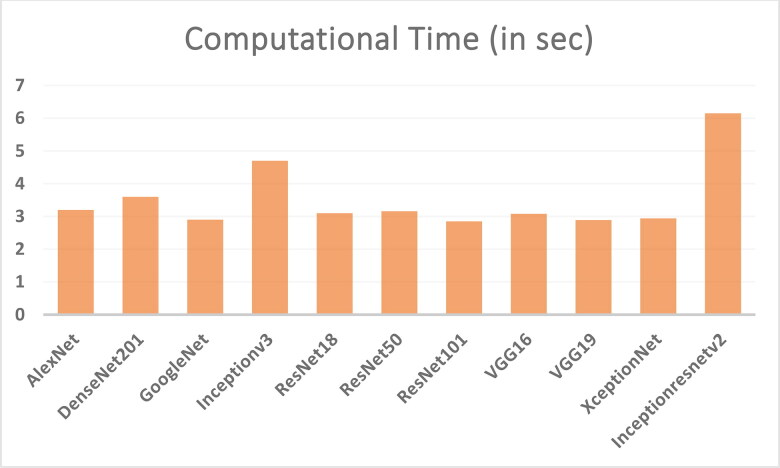
CNN deep learning model is efficiently detecting the COVID-19 disease from the X-ray chest images of normal and coronavirus effected patients. The detection parts from the normal images and COVID-19 images are shown in Figures 17 and 18. It can be seen from these figures that the segmented part of the COVID-19 patients X-ray images of chest is smaller than the normal patient X-ray images. Moreover, the computational times of different classification models are also calculated (see Figure 19). Overall, it can be concluded that the CNN deep learning model and J48 decision approach is able to classify the chest X-ray images of coronavirus patients. Coronavirus identification (COVID-19) is now a vital task for the physicians and researchers. The spread of COVID-19 is declared by WHO since March 2020 as a global outbreak of the pandemic. In order, to reduce COVID-19 spread and initiate early medical treatment for the infected individuals, it is a crucial priority to become aware of the infected individuals so that preventive procedures can be performed.
Figure 17.
Segmented chest area of normal patients using CNN approach.
Figure 18.
Segmented chest area of COVID-19 patients using CNN approach.
Figure 19.
Calculated computational time to predict the COVID-19 disease using different CNN models.
Moreover, researchers are trying to solve the COVID-19 detecting problem by using their own artificial-intelligence based approaches (Dhiman, 2019, 2020; Dhiman et al., 2020a, 2020b, 2020c, 2021; Dhiman & Kumar, 2018a, 2019; Dhiman & Kaur, 2019; Kaur et al., 2020a, 2020b–).
8. Conclusions and future works
The contents of this article are based on data available from the WHO, the EDC an agency of the European Union, and other official websites. The chest X-ray images used for simulation purposes are collected from the GitHub and Kaggle repositories, for coronavirus identification using deep features and J48 approach. The extraction is done by using eleven pre-trained CNN models and individually supplied them for J48 classification. Statistical research is conducted to select the best classification pattern. ResNet101 plus J48 classification model statistical performance is better than the other ten competitor models. Hence, the proposed classification model accuracy is 98.54% for detection of COVID-19 disease. For future work, this work will be further extended by using the ensemble of J48 algorithm. To solve this problem with other machine-learning approaches can also be taken as future contributions.
Disclosure statement
No potential conflict of interest was reported by the authors.
References
- Ai, T., Yang, Z., Hou, H., Zhan, C., Chen, C., Lv, W., Tao, X., Sun, Z., & Xia, L. (2020). Correlation of chest CT and RT-PCR testing in coronavirus disease 2019 (COVID-19) in China: A report of 1014 cases. Radiology, 296(2), E32–E23. 10.1148/radiol.2020200642 [DOI] [PMC free article] [PubMed] [Google Scholar]
- Celik, Y., Talo, M., Yildirim, O., Karabatak, M., & Acharya, U. R. (2020). Automated invasive ductal carcinoma detection based using deep transfer learning with whole-slide images. Pattern Recognition Letters, 133, 232–239. 10.1016/j.patrec.2020.03.011 [DOI] [Google Scholar]
- Chan, J. F., Yuan, S., & Kok, K. H. (2020). A familial cluster of pneumonia associated with the 2019 novel coronavirus indicating person-to-person transmission: A study of a family cluster. Lancet, 395(10223), P514–P523.10.1016/S0140-6736(20)30154-9. [DOI] [PMC free article] [PubMed] [Google Scholar]
- Dhiman, G. (2019). ESA: A hybrid bio-inspired metaheuristic optimization approach for engineering problems. Engineering with Computers, 1–31. [Google Scholar]
- Dhiman, G. (2020). MOSHEPO: A hybrid multi-objective approach to solve economic load dispatch and micro grid problems. Applied Intelligence, 50(1), 119–137. 10.1007/s10489-019-01522-4 [DOI] [Google Scholar]
- Dhiman, G., & Kaur, A. (2019). STOA: A bio-inspired based optimization algorithm for industrial engineering problems. Engineering Applications of Artificial Intelligence, 82, 148–174. 10.1016/j.engappai.2019.03.021 [DOI] [Google Scholar]
- Dhiman, G., & Kumar, V. (2017). Spotted hyena optimizer: A novel bio-inspired based metaheuristic technique for engineering applications. Advances in Engineering Software, 114, 48–70. 10.1016/j.advengsoft.2017.05.014 [DOI] [Google Scholar]
- Dhiman, G., & Kumar, V. (2018a). Emperor penguin optimizer: A bio-inspired algorithm for engineering problems. Knowledge-Based Systems, 159, 20–50. 10.1016/j.knosys.2018.06.001 [DOI] [Google Scholar]
- Dhiman, G., & Kumar, V. (2018b). Multi-objective spotted hyena optimizer: A multi-objective optimization algorithm for engineering problems. Knowledge-Based Systems, 150, 175–197. 10.1016/j.knosys.2018.03.011 [DOI] [Google Scholar]
- Dhiman, G., & Kumar, V. (2019). Seagull optimization algorithm: Theory and its applications for large-scale industrial engineering problems. Knowledge-Based Systems, 165, 169–196. 10.1016/j.knosys.2018.11.024 [DOI] [Google Scholar]
- Dhiman, G., Garg, M., Nagar, A., Kumar, V., & Dehghani, M. (2020a). A novel algorithm for global optimization: Rat swarm optimizer. Journal of Ambient Intelligence and Humanized Computing, 1–26. [Google Scholar]
- Dhiman, G., Oliva, D., Kaur, A., Singh, K. K., Vimal, S., Sharma, A., & Cengiz, K. (2021). BEPO: A novel binary emperor penguin optimizer for automatic feature selection. Knowledge-Based Systems, 211, 106560. 10.1016/j.knosys.2020.106560 [DOI] [Google Scholar]
- Dhiman, G., Singh, K. K., Slowik, A., Chang, V., Yildiz, A. R., Kaur, A., & Garg, M. (2020b). EMoSOA: A new evolutionary multi-objective seagull optimization algorithm for global optimization. International Journal of Machine Learning and Cybernetics, 1–26. [AQ]33727983 [Google Scholar]
- Dhiman, G., Singh, K. K., Soni, M., Nagar, A., Dehghani, M., Slowik, A., Kaur, A., Sharma, A., Houssein, E. H., & Cengiz, K. (2020c). MOSOA: A new multi-objective seagull optimization algorithm. Expert Systems with Applications, 114150. 10.1016/j.eswa.2020.114150 [DOI] [Google Scholar]
- Gozes, O., Frid-Adar, M., Greenspan, H., Browning, P. D., Zhang, H., Ji, W., Bernheim, A., & Siegel, E. (2020). Rapid AI development cycle for the coronavirus (COVID-19) pandemic: Initial results for automated detection & patient monitoring using deep learning CT image analysis. arXiv 1–19.
- Hamimi, A. (2016). MERS-CoV: Middle East respiratory syndrome corona virus: Can radiology be of help? Initial single center experience. The Egyptian Journal of Radiology and Nuclear Medicine, 47(1), 95–106. 10.1016/j.ejrnm.2015.11.004 [DOI] [Google Scholar]
- Huang, C., Wang, Y., & Li, X. (2020). Clinical features of patients infected with 2019 novel coronavirus in Wuhan, China. Lancet, 395(10223), P497–P506. 10.1016/S0140-6736(20)30183-5 [DOI] [PMC free article] [PubMed] [Google Scholar]
- Huang, C., Wang, Y., Li, X., Ren, L., Zhao, J., Hu, Y., Zhang, L., Fan, G., Xu, J., Gu, X., Cheng, Z., Yu, T., Xia, J., Wei, Y., Wu, W., Xie, X., Yin, W., Li, H., Liu, M., … Cao, B. (2020). Clinical features of patients infected with 2019 novel coronavirus in Wuhan. Lancet, 395(10223), 497–506. 10.1016/S0140-6736(20)30183-5 [DOI] [PMC free article] [PubMed] [Google Scholar]
- Joseph, P. C., Paul, M., Lan, D. (2020) Open database of COVID-19 cases with chest X-ray or CT images [Data set]. Git Hub. https://github.com/ieee8023/covid-chestxray-dataset
- Jung, S. M., Akhmetzhanov, A. R., Hayashi, K., Linton, N. M., Yang, Y., Yuan, B., Kobayashi, T., Kinoshita, R., & Nishiura, H. (2020). Real time estimation of the risk of death from novel coronavirus (2019-nCoV) infection: Inference using exported cases. Journal of Clinical Medicine, 9(2), 523. 10.3390/jcm9020523 [DOI] [PMC free article] [PubMed] [Google Scholar]
- Kaur, H., Rai, A., Singh Bhatia, S., & Dhiman, G. (2020a). MOEPO: A novel multi-objective emperor penguin optimizer for global optimization: Special application in ranking of cloud service providers. Engineering Applications of Artificial Intelligence , 96, 104008. 10.1016/j.engappai.2020.104008 [DOI] [Google Scholar]
- Kaur, S., Awasthi, L. K., Sangal, A. L., & Dhiman, G. (2020b). Tunicate swarm algorithm: A new bio-inspired based metaheuristic paradigm for global optimization. Engineering Applications of Artificial Intelligence, 90, 103541. 10.1016/j.engappai.2020.103541 [DOI] [Google Scholar]
- Mahase, E. (2020). Coronavirus covid-19 has killed more people than SARS and MERS combined, despite lower case fatality rate. BMJ 368, m641. 10.1136/bmj.m641. 10.1136/bmj.m641 [DOI] [PubMed] [Google Scholar]
- Mckeever, A. (2020, March 20). Here’s what coronavirus does to the body. From blood storms to honeycomb lungs, here’s an organ-by-organ look at how COVID-19 harms humans. National geographic. https://www.nationalgeographic.com/science/2020/02/here-is-what-coronavirus-does-to-the-body/
- Nishiura, H., Kobayashi, T., Yang, Y., Hayashi, K., Miyama, T., Kinoshita, R., Linton, N., Jung, S-m., Yuan, B., Suzuki, A., & Akhmetzhanov, A. (2020). The rate of under ascertainment of novel coronavirus (2019-nCoV) infection: Estimation using Japanese passengers data on evacuation flights. Journal of Clinical Medicine, 9(2), 419. 10.3390/jcm9020419 [DOI] [PMC free article] [PubMed] [Google Scholar]
- Paul, M (2019, March 20). Chest x-ray images (Pneumonia). Kaggle. https://www.kaggle.com/paultimothymooney/chest-xray-pneumonia.
- Rachna, C. (2017, March 2020). Difference between X-ray and CT scan. Bio differences. https://biodifferences.com/difference-between-x-ray-and-ct-scan.html
- Roosa, K., Lee, Y., Luo, R., Kirpich, A., Rothenberg, R., Hyman, J. M., Yan, P., & Chowell, G. (2020). Real-time forecasts of the COVID-19 epidemic in China from February 5th to February 24th, 2020. Infectious Disease Modelling, 5, 256–263. 10.1016/j.idm.2020.02.002 [DOI] [PMC free article] [PubMed] [Google Scholar]
- Shan, F., Gao, Y., Wang, J., Shi, W., Shi, N., Han, M., Xue, Z., & Shi, Y. Lung (2020). Infection Quantification of COVID-19 in CT Images with Deep Learning. arXiv, 1–19.
- Stoecklin, S. B., Rolland, P., Silue, Y., Mailles, A., Campese, C., Simondon, A., Mechain, M., Meurice, L., Nguyen, M., Bassi, C., Yamani, E., Behillil, S., Ismael, S., Nguyen, D., Malvy, D., Lescure, F. X., Georges, S., Lazarus, C., Tabaï, A., … Team, I. (2020). First cases of coronavirus disease 2019 (COVID-19) in France: Surveillance, investigations and control measures, January 2020. Eurosurveillance, 25(6), 2000094. [DOI] [PMC free article] [PubMed] [Google Scholar]
- Tang, B., Wang, X., Li, Q., Bragazzi, N. L., Tang, S., Xiao, Y., & Wu, J. (2020). Estimation of the transmission risk of the 2019-nCoV and its implication for public health interventions. Journal of Clinical Medicine, 9(2), 462. 10.3390/jcm9020462 [DOI] [PMC free article] [PubMed] [Google Scholar]
- Thompson, R. N. (2020). Novel coronavirus outbreak in Wuhan, China, 2020: Intense surveillance is vital for preventing sustained transmission in new locations. Journal of Clinical Medicine, 9, 498.] [DOI] [PMC free article] [PubMed]
- Wang, S., Kang, B., Ma, J., Zeng, X., Xiao, M., Guo, J., Cai, M., Yang, J., Li, Y., Meng, X., & Xu, B. (2020a). A deep learning algorithm using CT images to screen for corona virus disease (COVID-19). medRxiv, 1–26. 10.1101/2020.02.14.20023028 [DOI] [PMC free article] [PubMed] [Google Scholar]
- Wang, Y., Hu, M., Li, Q., Zhang, X. P., Zhai, G., & Yao, N. (2020b). Abnormal respiratory patterns classifier may contribute to large-scale screening of people infected with COVID-19 in an accurate and unobtrusive manner. arXiv 1–6..
- World Health Organization . (2020, March 20). Coronavirus. World Health Organization. https://www.who.int/health-topics/coronavirus
- Xie, X., Li, X., Wan, S., & Gong, Y. (2006). Mining X-ray images of SARS patients. In Graham J. Williams &. Simoff Simeon J (Eds.), Data mining: Theory, methodology, techniques, and applications(pp. 282–294). Springer-Verlag. [Google Scholar]
- Xu, X., Jiang, X., Ma, C., Du, P., Li, X., Lv, S., Yu, L., Chen, Y., Su, J., Lang, G., Li, Y., Zhao, H., Xu, K., Ruan, L., & Wu, W. (2020). Deep learning system to screen coronavirus disease 2019 pneumonia. arXiv 1–29. . [DOI] [PMC free article] [PubMed] [Google Scholar]
- Yan, L., Zhang, H. T., Xiao, Y., Wang, M., Guo, Y., Sun, C., Tang, X., Jing, L., Li, S., Zhang, M., Xiao, Y., Cao, H., Chen, Y., Ren, T., Jin, J., Wang, F., Xiao, Y., Huang, S., Tan, X., … Yuan, Y. (2020). Prediction of criticality in patients with severe Covid-19 infection using three clinical features: A machine learning-based prognostic model with clinical data in Wuhan. medRxiv, 1–18. 10.1101/2020.02.27.20028027 [DOI] [Google Scholar]
- Yildirim, O., Talo, M., Ay, B., Baloglu, U. B., Aydin, G., & Acharya, U. R. (2019). Automated detection of diabetic subject using pre-trained 2D-CNN models with frequency spectrum images extracted from heart rate signals. Computers in Biology and Medicine, 113, 103387. 10.1016/j.compbiomed.2019.103387 [DOI] [PubMed] [Google Scholar]
- Zhao, S., Musa, S. S., Lin, Q., Ran, J., Yang, G., Wang, W., Lou, Y., Yang, L., Gao, D., He, D., & Wang, M. H. (2020). Estimating the unreported number of novel coronavirus (2019-nCoV) cases in China in the first half of January 2020: A data-driven modelling analysis of the early outbreak. Journal of Clinical Medicine, 9(2), 388. 10.3390/jcm9020388 [DOI] [PMC free article] [PubMed] [Google Scholar]


