ABSTRACT
Introduction: Peripheral nerve crush injury (PNCI) models are commonly used to study nerve damage and the potential beneficial effects of novel therapeutic strategies. Current models of PNCI rely on inter-device and operator precision to limit the variation with applied pressure. Although the inability to accurately quantify the PNCI pressure may result in reduced reproducibility between animals and studies, there is very limited information on the standardization and quantification of applied pressure with PNCI. To address this deficit, we constructed a novel device comprised of an Arduino UNO microcontroller board and Force Sensitive Resistor capable of reporting the real-time pressure applied to a nerve.
Methods: Two forceps and two needle drivers were used to perform 30-second PNCIs to the sciatic nerves of mice (n = 5/group). Needle drivers were set to the first notch, and a jig was used to hold the forceps pinch at a reproducible pressure. The Force Sensitive Resistor was interposed in-series between the nerve and instrument during PNCI.
Results: Data collected from these procedures displayed average needle driver pressures an order of multitude greater than forceps pressures. Additionally, needle driver inter- and intra-procedure pressure remained more consistent than forceps pressure, with needle driver coefficient of variation equal to 14.5% vs. a forceps coefficient of variation equal to 45.4%.
Conclusions: This is the first demonstration of real-time pressure measurements in PNCI models and it reveals that the applied pressures are dependent on the types of device used. The large disparity in pressure represents an inability to apply graded accurate and consistent intermediate pressure gradients in PNCI. These findings indicate a need for documentation of pressure severity as a screening for PNCI in animals, and the real-time pressure sensor could be a useful tool in monitoring and applying consistent pressure, reducing the outcome variability within the same experimental model of PNCI.
INTRODUCTION
Traumatic peripheral nerve injury (TPNI) represents a major health problem that often leads to significant functional impairment and permanent disability.1 It is estimated that roughly 3% of all trauma patients have peripheral nerve injuries.2,3 Traumatic peripheral nerve injury are generally associated with motor vehicle collisions, penetrating injuries, lacerations, gun-shots, falls, burns, fractures, ischemia, traction, and crush injuries.2–5 Traumatic peripheral nerve injury occurs along a wide spectrum of severity and the recovery is directly dependent on the type and severity of the injury.4–7 The degree of nerve injury itself depends on the number and size of fascicles within the injured nerve (e.g., partial vs. complete severance of fascicles). Traumatic peripheral nerve injuries are also characterized based on the disruption of cellular and morphological structures within the nerve. Less severe trauma will injure the myelin sheath and axons first, while more severe forces will disrupt not only the myelin and axons but the connective nerve tissues such as the endoneurium, perineurium, and epineurium.4–7
Experimental TPNIs are commonly performed on rodent sciatic nerves to investigate the physiological and functional responses to possible therapeutic interventions.8 Peripheral nerve crush injury (PNCI) is a commonly studied TPNI model that utilizes forceps, locking needle drivers (NDs) or similar device, and an experienced hand to produce a crush injury.9–12 Current models of PNCI rely on inter-device and operator precision to limit the variation of applied pressure. Although the inability to accurately quantify the PNCI pressure results in reduced reproducibility between animals and studies, there is no report on the standardization and quantification of applied pressure with PNCI. It is thus expected that the ability to accurately deliver and report a consistent, precise series of injuries with multiple known intensities would benefit the TPNI field. An ideal model would be the one that could deliver a PNCI of a known nerve injury severity to each animal by any researcher or lab for reliable inter-study and device reproducibility.
To address this deficit, we constructed a novel calibrated digital device composed of an Arduino UNO (Arduino, Somerville, MA, USA) and Force Sensitive Resistor (FSR; Tekscan, South Boston, MA, USA) capable of reporting the real-time pressure applied to a nerve and tested this device for the reproducibility of different crush injury pressures exerted by different types of forceps and NDs.
METHODS
The experimental design and animal protocols were approved by the Institutional Animal Care and Use Committee (IACUC) at The Pennsylvania State University College of Medicine, Hershey, PA, and the experiments were performed according to the guidelines of IACUC. Ten-week-old female FVB mice (n = 5/instrument) were used in this study. The mice were housed at the animal facility, and the experimental animals were handled according to the IACUC guidelines for the care and use of laboratory animals.
Development of a Novel Digital PrecisionPinch Sensor System
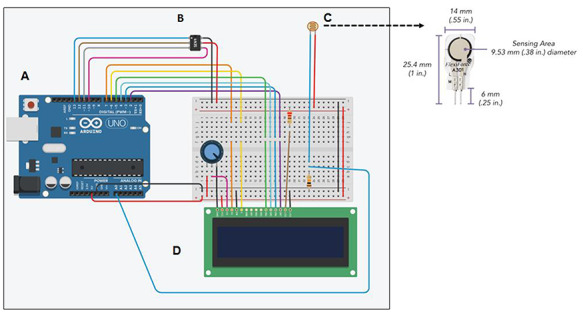
A novel pressure sensing device, named the PrecisionPinch, was constructed and optimized to determine the pressure applied by a tool during a PNCI. The PrecisionPinch system utilizes the open-source microcontroller board “Arduino UNO” along with an FSR (FlexiForce A301), “Arduino UNO” compatible 16 × 2 liquid crystal display (LCD) screen, and “Arduino UNO” compatible MicroSD card adapter (Fig. 1). The FSR is 0.203 mm thick and has a sensing area of 9.53 mm within the dimension 14 mm × 25.4 mm. All components were soldered together onto a custom printed circuit board (PCB) in the second prototype of the device, PrecisionPinch2.2 prototype. After construction of the device, calibration was manually performed at a range of 2.5 to 25 lbs over the functional sensor area.
FIGURE 1.

Schematic representation of PrecisionPinch system containing; (A) Arduino UNO, (B) Force Sensitive Resistor (FSR) FlexiForce A301, (C) 16 × 2 LCD screen, and (D) MicroSD card adapter. On the upper right panel, FSR is enlarged to show its dimensions and the sensing area.
Mouse Model of PNCI
After the PrecisionPinch device construction and calibration, in vivo studies were conducted to examine the pressure applied during currently utilized PNCI models. Sciatic nerve crush injury was performed as previously described.13 Briefly, after intraperitoneal ketamine (100 mg/kg)/xylazine (10 mg/kg) anesthesia, the right hind limb was shaved and prepared with alcohol swabs and povidone-iodine (Betadine). Under a precision stereo zoom binocular microscope (Model PZMIII, World Precision Instruments), a lateral skin incision (∼2.5 cm) was made along the length of the femur and the sciatic nerve was bluntly exposed through the iliotibial band. Crush injury was performed ∼3 mm proximal to the sciatic nerve trifurcation for 30 seconds using 2 forceps [Mx Prm 1996 (Miltex Premium 18-1107, 95OL) and Mx Prm 2018 (Miltex Premium 18-1107, 110,120-1711), Integra LifeSciences, Princeton, NJ, USA] and 2 NDs [V Mul ND (V. Mueller RH2560), Becton, Dickinson, and Company, Franklin Lakes, NJ, USA and Mx Prm ND (Miltex Premium 8-6), Integra LifeSciences, Princeton, NJ, USA]. These instruments have been previously used to publish PNCI data in our lab.11,13 Needle drivers were set to the first notch, and a jig was used to hold the forceps pinch at a reproducible pressure.
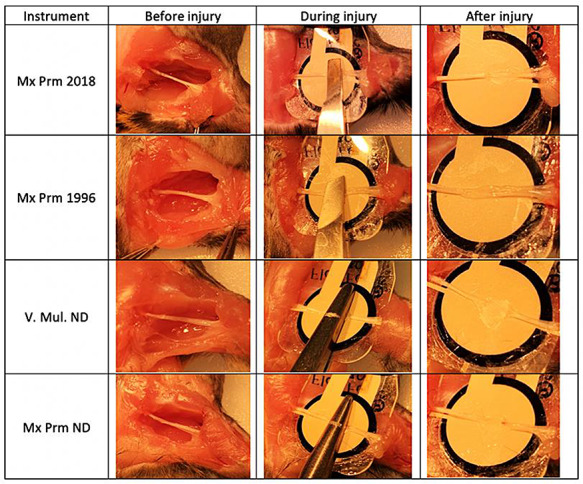
The sequential steps to press the nerve over the sensor and capture the pressure signals are shown in Fig. 2. Briefly, after blunt dissection and making enough space around the nerve, the sensor was positioned under the nerve before injury, and this step did not make any visible/recordable signals on the LCD screen. Then, the forceps or ND was advanced (over the nerve and below the sensor), positioned, and aligned with the nerve and the marking on the forceps/ND which known to produce the maximum pressure when pressed over the nerve. The forceps/ND did not touch the sensor or nerve at this step, and there was no background signals on the computer screen. Finally, the nerve was pressed over the sensor and the generated pressure signals were viewed and monitored on the LCD screen as MPa, and the data were saved and stored in the SD card. At this step, the positions of forceps/ND lips, nerve, and sensor were from top to below: upper lip of the forceps/ND, nerve, pressure-sensitive area of the sensor, and the lower lip of the forceps/ND. Only one PNCI was performed on each nerve by each instrument. After each PNCI, mice were euthanized under deep anesthesia followed by cervical dislocation. Pressure data were downloaded from the microSD card and analyzed using Matlab and Microsoft Excel.
FIGURE 2.

Representative gross images of sciatic nerves before, during, and after crush injury procedures with in-series PrecisionPinch device to document and measure real-time pressures. The injury severity intensity was more pronounced with needle drivers than forceps.
Statistical Analysis
The data were analyzed using unpaired Student’s t-test in Microsoft Excel. All values are presented as mean ± SEM. Probability (P) values of <.05 were considered statistically significant.
RESULTS
Utility of a Novel Real-Time Digital Pressure Sensor
The digital PrecisionPinch sensor (Fig. 1) operates by detecting the change in resistance of the FSR as a force is applied. First, the calibration curve (known weight vs. measured resistance) is converted to conductance (1/resistance) vs. weight in order to linearize the data. Then, a linear equation of best fit is calculated and integrated in the Arduino UNO code. This allows weight to be displayed on the LCD screen and stored in the MicroSD card. Pressure can be calculated from this data if the area of the tool is measured (Pressure = Force/Area). Thus, utilizing the calibration of known weights, resistance through the FSR can be converted to force and pressure. This device is able to sense and record most moderate amounts of pressure applied to it with a response time of <5 µsec, sampling rate of 20 Hz, and pressure range of 2.5 to 25 lbs. It does not sense a simple contact or touch unless both sides of the sensor are involved. The sensor is rated for three million actuations, but like all measuring devices it should be recalibrated every couple months to ensure the accurate readings. The digital PrecisionPinch sensor device with LCD screen as shown in Appendix 1 was made by our lab and the total cost was around $65. The data for the sensor (FlexiForce A301) is available at www.tekscan.com/flexiforce.
During the construction, calibration, and development process of this pressure sensor device, we checked different forceps or ND-induced pressure that is sensed and recorded by the pressure sensor device without anything in between the jaws of forceps/ND or with an intervening thread (having comparable diameter of a sciatic nerve) between the pressure sensor and jaws of the forceps/ND. We observed a difference in the pressure generation with or without the thread. The in vitro pressure (MPa) produced by each forceps and ND itself on the sensor (n = 5 readings/instrument) were: 0.35 ± 0.032 (Mx Prm 1996 forceps), 0.48 ± 0.002 (Mx Prm 2018 forceps), 5.27 ± 0.38 (Mx Prm ND), and 15.67 ± 0.41 (V Mul ND).
Real-Time Sciatic Nerve Crush Injury Pressures With PrecisionPinch Sensor
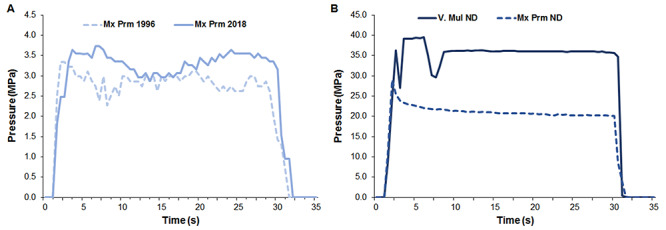
Figure 2 shows the representative images of the sciatic nerve and PrecisionPinch device measuring the pressure applied during PNCI. Crush injuries caused by NDs produced more severe damage to the nerves than forceps. Pressure data from each group of injuries were averaged by time to create a representative figure of the pressure created by a device during PNCI over time. When comparing the four groups, the inter- and intra-procedure pressure variation (wavy, irregular tracings) was substantially larger with forceps PNCI than with NDs (Figs. 3A and 3B). This difference can be represented quantitatively by an average forceps coefficient of variation (CoV) of 45.4% vs. an average ND CoV of 14.5%. Although the NDs were able to maintain a more constant pressure, slight operator error led to large fluctuations in pressure, as seen in the peaks of Mx Prm ND of Fig. 3B (solid line). These peaks represent the pressure applied by the operator to set the locking mechanism of the NDs. In one case, the operator missed the correct locking notch and needed to reset the NDs to the correct notch. This led to a large fluctuation in that sample, represented by the initial peaks and valleys of Fig. 3B (solid line).
FIGURE 3.

Tracings showing the time-course for real-time crush injury pressure by different forceps and needle drivers. Forceps pressure varies during crush injury and has a wide variability between separate injuries (Fig. 3A). Needle driver pressure shows disparity between two tools (forceps vs. needle drivers), but little variation in pressure intensity within them (Fig. 3B).
Device-Dependency of Crush Injury-Induced Pressures
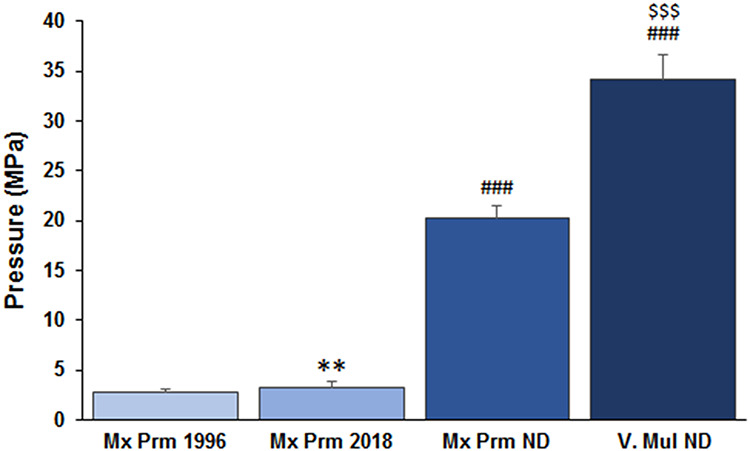
Figure 4 shows the averaged pressure data collected over time for each PNCI. Needle drivers produced significantly robust (>10 to 30 folds, ###P < .001) injury pressures as compared to the forceps. The pressure produced by V Mul ND was significantly larger than Mx Prm ND (34.11 ± 2.47 vs. 20.27 ± 1.23 MPa, $$$P < .001, n = 5/group). In contrast, pressure produced by Mx Prm 2018 forceps was significantly larger than Mx Prm 1996 forceps (3.18 ± 0.63 vs. 2.71 ± 0.29 MPa, **P < .01, n = 5/group). Of note, the magnitude of pressure data produced by each forceps and ND on the nerve corresponds to the magnitude of pressure data produced by each instrument itself on the sensor.
FIGURE 4.

Average pressure applied by four commonly used instruments during crush injury. Needle drivers produced significantly robust injury pressures as compared to the forceps. **P < .01 vs. Mx Prm 1996, ###P < .001 vs. forceps, and $$$P < .001 vs. Mx Prm ND; n = 5/group.
DISCUSSION
This is the first demonstration of nerve injury pressure measurements in PNCI models using a novel real-time digital pressure sensor and our study reveals that the applied pressures are dependent on the types of device used. The consistency of ND over forceps, owing to the ability of the NDs to “lock in place”, may contribute to reliable and reproducible outcomes, albeit at the expense of a much larger injury severity. The use of forceps, even with jigs to limit the variability, requires further standardization as a result of operator effects even in experienced hands. The large disparity in pressures between the forceps and NDs thus highlights the importance of a real-time pressure sensor to standardize the experimental nerve injury pressures between these two ubiquitously employed tools of PNCI. Different modes of failure by the pressure sensor, such as operator movement, sensor movement, and operator error in ND locking, are evident by the fluctuations in pressure tracings over time and high CoV.
Although TPNI occurs along a wide spectrum of severity and the recovery is directly dependent on the type and severity of the injury, there is scarcity in preclinical reports demonstrating reproducible spectrum of TPNIs with variable injury severity that can be reproduced in any lab.4–7 Different approaches are employed to monitor or apply consistent crush injuries, including fixed traction, electrophysiological control, or pressure-sensitive film. Most of these approaches are either invasive or require post-experiment analysis.9–11 Therefore, the inability to apply accurate and consistent intermediate grades of pressure in PNCI by different groups may explain the diversity of results with TPNIs and the difficulty in interpreting results from different experiments. Interestingly, we observed erythropoietin-induced severity-dependent functional recovery after crush injury, and it was evident that the efficacy of a drug regimen at one end of the TPNI spectrum is only applicable if it is reproducible.10
Considering the diversity in TPNI methods, we focused on devising a real-time monitoring device for injury pressure measurements that could be used in applying consistent pressure within the same experimental model of PNCI. The pressure tracings on the LCD screen of this device were continuously monitored for each second while making nerve injury, and all data were saved in the SD card continuously from before injury to the end of injury. This pressure sensor device was designed to output the read time pressure recordings sampled at the limit of the processor (20 Hz) with a response time of <5 µsec. The saved data in the SD card were processed in the computer for real-time pressure sampling and visualization, as shown in Fig. 3. Although the current version of this pressure sensor device is not equipped with the computer monitor for the nature of real-time concept, our novel digital in-series pressure sensor, PrecisionPinch, convincingly demonstrated that its ability to report real-time accurate pressure applied to a nerve with certain limitations. We tested and validated this device for the reproducibility and reliability of different crush injury pressures exerted using different types of forceps and NDs. The preliminary findings were presented as an abstract at 2019 Military Health System Research Symposium.14 The device schematic, instructions, and code to run it are available for others to emulate and use.
CONCLUSIONS
Our PrecisionPinch digital sensor is a very simple, portable, inexpensive, sensitive, and suitable for repeated use with any type of nerve injury-producing instruments in small animals. We hope that PrecisionPinch sensor that we described in this study can be used by others to produce consistent and reliable nerve injuries to better understand the nerve pathophysiology and molecular mechanisms of nerve regeneration and functional recovery. Future prototypes and devices should be aimed at decreasing the size of the sensor only to the extent that all injury is fully captured. Specific work is underway to integrate a sensor into the crush instruments themselves, while also improving software coding to limit noise and increase calibration accuracy.
Supplementary Material
Contributor Information
Grant D Wandling, Department of Orthopaedics and Rehabilitation, Center for Orthopaedic Research and Translational Science, The Pennsylvania State University College of Medicine, Milton S. Hershey Medical Center, Hershey, PA 17033, USA.
Jung Il Lee, Department of Orthopaedics and Rehabilitation, Center for Orthopaedic Research and Translational Science, The Pennsylvania State University College of Medicine, Milton S. Hershey Medical Center, Hershey, PA 17033, USA; Department of Orthopedic Surgery, Hanyang University College of Medicine, Hayang University Guri Hospital, Guri-si, Gyeonggi-do, 11923, South Korea.
M A Hassan Talukder, Department of Orthopaedics and Rehabilitation, Center for Orthopaedic Research and Translational Science, The Pennsylvania State University College of Medicine, Milton S. Hershey Medical Center, Hershey, PA 17033, USA.
Prem Kumar Govindappa, Department of Orthopaedics and Rehabilitation, Center for Orthopaedic Research and Translational Science, The Pennsylvania State University College of Medicine, Milton S. Hershey Medical Center, Hershey, PA 17033, USA.
John C Elfar, Department of Orthopaedics and Rehabilitation, Center for Orthopaedic Research and Translational Science, The Pennsylvania State University College of Medicine, Milton S. Hershey Medical Center, Hershey, PA 17033, USA.
SUPPLEMENTARY MATERIAL
Supplementary material is available at Military Medicine online.
FUNDING
This work was supported by grants from the National Institutes of Health (K08 AR060164-01A) and the Department of Defense (W81XWH-16-1-0725) to John C. Elfar in addition to the institutional support from Pennsylvania State University Medical Center.
REFERENCES
- 1. Robinson LR: Traumatic injury to peripheral nerves. Muscle Nerve 2000; 23(6): 863-73. [DOI] [PubMed] [Google Scholar]
- 2. Taylor CA, Braza D, Rice JB, Dillingham T: The incidence of peripheral nerve injury in extremity trauma. Am J Phys Med Rehabil 2008; 87(5): 381-5. [DOI] [PubMed] [Google Scholar]
- 3. Noble J, Munro CA, Prasad VS, Midha R: Analysis of upper and lower extremity peripheral nerve injuries in a population of patients with multiple injuries. J Trauma 1998; 45(1): 116-22. [DOI] [PubMed] [Google Scholar]
- 4. Robinson LR: Traumatic injury to peripheral nerves. Suppl Clin Neurophysiol 2004; 57: 173-86. [DOI] [PubMed] [Google Scholar]
- 5. Campbell WW: Evaluation and management of peripheral nerve injury. Clin Neurophysiol 2008; 119(9): 1951-65. [DOI] [PubMed] [Google Scholar]
- 6. Caillaud M, Richard L, Vallat JM, Desmoulière A, Billet F: Peripheral nerve regeneration and intraneural revascularization. Neural Regen Res 2019; 14(1): 24-33. [DOI] [PMC free article] [PubMed] [Google Scholar]
- 7. Menorca RM, Fussell TS, Elfar JC: Nerve physiology: mechanisms of injury and recovery. Hand Clin 2013; 29(3): 317-30. [DOI] [PMC free article] [PubMed] [Google Scholar]
- 8. Modrak M, Talukder MAH, Gurgenashvili K, Noble M, Elfar JC: Peripheral nerve injury and myelination: potential therapeutic strategies. J Neurosci Res 2019; 98(5): 780-95. doi: 10.1002/jnr.24538 [DOI] [PMC free article] [PubMed] [Google Scholar]
- 9. Alant JD, Kemp SW, Khu KJ, Kumar R, Webb AA, Midha R: Traumatic neuroma in continuity injury model in rodents. J Neurotrauma 2012; 29(8): 1691-703. [DOI] [PMC free article] [PubMed] [Google Scholar]
- 10. Geary MB, Li H, Zingman A, et al. : Erythropoietin accelerates functional recovery after moderate sciatic nerve crush injury. Muscle Nerve 2017; 56(1): 143-51. [DOI] [PMC free article] [PubMed] [Google Scholar]
- 11. Răducan A, Mirică S, Duicu O, et al. : Morphological and functional aspects of sciatic nerve regeneration after crush injury. Rom J Morphol Embryol 2013; 54(3 Suppl): 735-9. [PubMed] [Google Scholar]
- 12. Savastano LE, Laurito SR, Fitt MR, Rasmussen JA, Gonzalez Polo V, Patterson SI: Sciatic nerve injury: a simple and subtle model for investigating many aspects of nervous system damage and recovery. J Neurosci Methods 2014; 227: 166-80. [DOI] [PubMed] [Google Scholar]
- 13. Elfar JC, Jacobson JA, Puzas JE, Rosier RN, Zuscik MJ: Erythropoietin accelerates functional recovery after peripheral nerve injury. J Bone Joint Surg Am 2008; 90(8): 1644-53. [DOI] [PMC free article] [PubMed] [Google Scholar]
- 14. Wandling G, Lee JI, Talukder MA, Govindappa PK, Elfar J: Novel calibrated real-time pressure sensor reveals wide variations in current nerve crush injury models. Presentation at the 2019 Military Health System Research Symposium. Available at https://mhsrs.amedd.army.mil/sites/mhsrs2019/Conference/SitePages/Accepted%20Abstracts.aspx?View={963AA4DE-EED5-4658-B4DB-03E4E851E4B1}&SortField=Presenter&SortDir=Desc&FilterField1=LinkTitle&FilterValue1=MHSRS%2D19%2D00332; accessed February 14, 2020. [Google Scholar]
Associated Data
This section collects any data citations, data availability statements, or supplementary materials included in this article.


