

ABSTRACT
In conventional RNA high-throughput sequencing, modified bases prevent a large fraction of tRNA transcripts to be converted into cDNA libraries. Recent proposals aiming at resolving this issue take advantage of the interference of base modifications with RT enzymes to detect and identify them by establishing signals from aborted cDNA transcripts. Because some modifications, such as methyl groups, do almost not allow RT bypassing, demethylation and highly processive RT enzymes have been used to overcome these obstacles. Working with Escherichia coli as a model system, we show that with a conventional (albeit still engineered) RT enzyme and key optimizations in library preparation, all RT-impairing modifications can be highlighted along the entire tRNA length without demethylation procedure. This is achieved by combining deep-sequencing samples, which allows to establish aborted transcription signal of higher accuracy and reproducibility, with the potential for differentiating tiny differences in the state of modification of all cellular tRNAs. In addition, our protocol provides estimates of the relative tRNA abundance.
KEYWORDS: tRNA sequencing, deep-sequencing, base modifications, epitranscriptome
Introduction
During the past few years, several new experimental strategies have been developed to help characterize cellular tRNAs from either cells or tissues, both in terms of modification state and relative frequency [1, 2-5, 6]. These investigations came at the time of the realization that, although tRNA modifications are primarily ensuring an accurate and efficient deciphering of mRNAs during translation [reviewed in 7], a multitude of other biological processes are directly or indirectly impacted by them [8–10]. Furthermore, a large variety of diseases originate from an absence of tRNA modifications [11; 12, 13], while the modification state of tRNAs has also been shown to relate to metabolism [Alexandrov et al., 14-16]. It is, therefore, highly desirable to develop straightforward methods for the characterization of all tRNAs. The presence of modifications on tRNA constitutes a burden in traditional deep-sequencing experiments because they prevent RT enzymes from generating full cDNA transcripts by blocking their progression along the RNA strand. Earlier protocols of cDNA library preparation relied on RNA adapters ligated to both ends of the RNAs for PCR amplification, implying that aborted cDNA transcripts could not be amplified. RT enzymes may still bypass modifications at a rate depending on the nature and position of the chemical groups attached to nucleosides, which would often lead to nucleotide misincorporation. This information has already been used to identify modified residues in RNA-seq databases established from these earlier protocols [17,18]. Since then, procedures to amplify aborted cDNA transcripts have been developed, which have allowed to establishing signals at the location of RT-impending modifications, and thus acquiring quantitative information about the state of modification [3, 5, 19]. Currents methods are reviewed in [20,21] and [22]. Some modifications, such as methyl groups, do almost not allow any RT bypass when they are situated on the Watson-Crick face of bases. In order to overcome this issue, Lowe and coworkers [1] and Pan and coworkers [5] combined demethylase treatments with an exceptionally processive RT enzyme to generate full-lengh cDNA transcripts at higher yields. Alternate procedures were developed by Motorin, Helm and co-workers, who established aborted transcription signals from fragmented RNA [3]. Although it is still used in many RNA deep-sequencing protocols [2,3], RNA fragmentation generates a high level of noise in the analysis due to ambiguous gene mapping. This procedure was, therefore, avoided in the present study.
Searching for a method that could highlight RT-impairing base modifications with minimal benchwork, we identified a robust procedure that allows to generate signals from aborted cDNA transcripts without requiring demethylase treatment and/or RNA fragmentation, and that we validated with a regular RT enzyme (Superscript III, Invitrogen). Working with 3 biological replicates from Escherichia coli, a bacterial species the tRNA modifications of which are well characterized, we first show that conventional treatments of total RNA samples (DNase, DNase and deacylation) have no significant effect on these signals (we call them ts, termination signals). The number of QC-passed reads obtained from single samples (10–15 million) is, however, too low to fully characterize all tRNAs. Next, we show that a significant gain in accuracy of ts signals is obtained by combining independently sequenced samples. Because deep-sequencing experiments require PCR amplification, tiny variations in the amount of initial sample translate into noticeable differences in relative fractions of amplified cDNA transcripts, implying that ts signals fluctuate around characteristic values. Our data show that these fluctuations reach amplitudes as high as 90%. Pooling reads from 3 experiments allows us to demonstrate a reduction in ts standard deviation by a factor > 2. Furthermore, by combining all samples from 9 independent deep-sequencing experiments, totalizing about 60 million mapped reads, we show that the coverage is high enough to fully characterize 43 out of the 48 different E. coli tRNAs, 5 weakly expressed tRNAs being incompletely covered with ts signals. E. coli being an extensively studied bacteria, almost all ts signals can be attributed to modifications listed in the Modomics database [23]. An innovative aspect of our protocol based on the conserved CCA 3ʹ terminal of all tRNAs was found essential to obtaining highly consistent data. Because the ultimate A76 residue, that is required for aminoacylation, can be specifically removed by RNase T in E. coli [24,25], a subpopulation of non-functional tRNAs may always occur in these cells [26, and our unpublished data]. Conversely, an additional CCA may be added by the CCA-adding enzyme that tags these tRNAs for degradation through the combined action of poly(A) polymerase and RNase R [27–29]. We found that the use of primers with TGG 3ʹ overhang in the first PCR step essentially only amplifies CCA 3ʹ-ending RNA transcripts and drastically reduces background amplification. This enables our protocol to generate signals of unprecedented cleanliness, although it is restricted to almost only tRNAs. The universality of the tRNA CCA 3ʹ end makes it, however, applicable to any organism of interest. Because all transcribed cDNAs start at the 3ʹ end of the tRNAs, a relative quantification of mature isoacceptors can be established from the read coverage at that position.
Materials and methods
Preparation of samples
To test the proposed method, three biological replicates (R1, R2 and R3) of total RNA from E. coli MG1655 cells grown at 37°C in standard LB medium were sampled at an OD600 of ~4.0. Total RNA was extracted with trizol/chloroform. Glycogen was added and the solution was precipitated with ethanol. Each of these samples were prepared following three different procedures (Fig. 1): Total RNA was either not treated (a), or treated with DNase (b), or treated with DNase and deacylated (c) prior to 3ʹ adapter ligation (Table 1). DNase treatment (with TurboDNase, Ambion) was performed 4 hours at 37°C, followed by overnight incubation at 4°C. Adapter ligation (10°C overnight) was achieved with a pre-adenylated RNA 3ʹ adapter using a truncated T4 RNA ligase 2 (NEB). Reverse transcription was performed with Superscript III (Invitrogen), 1 h at 55°C. Chimeric RNA/cDNA products were directly loaded on gel for size selection between 35 to 200 bp by electrophoresis to eliminate the excess of 3ʹ adapters and select mid-size RNA transcripts. Gel-extracted products were subjected to poly-A tailing by a TdT enzyme (NEB) 45 min at 37°C. A first round of selective pre-amplification of the cDNA (10–18 cycles) was achieved using a Taq polymerase (Invitrogen) with Illumina TruSeq sRNA RTP with TGG overhang and Illumina TruSeq sRNA 5ʹ adapter primer with polyT(20). A second amplification (5–15 cycles) with Illumina RP1 and Illumina TruSeq sRNA Index primer (RPIX) that added a specific tag to each of the 9 samples provided the final libraries. Illumina deep sequencing (libraries multiplexing; pair-end: 2x125bp PE, HiSeq High Output mode, V4 chemistry) was performed by an external contractor (Genewiz). The detailed protocol of library preparation is available in supplemental File S1.
Figure 1.

Workflow of library preparation. See text for explanations and Supplemental File S1 for detailed protocol. Note that the stretch of 5 random positions (N5) preceding the poly(T) tail of the 5ʹ adapter primer is a requirement of Illumina deep-sequencing spot localization
Table 1.
The 9 total RNA samples analysed in this study
| Biological replicate |
|||
|---|---|---|---|
| Treatment | R1 | R2 | R3 |
| a. no treatment | R1a | R2a | R3a |
| b. DNase | R1b | R2b | R3b |
| c. DNase + deacylation | R1c | R2c | R3c |
Computational treatment of deep-sequencing data
Processing of the deep-sequencing data required an optimization to extract the most relevant signal from read coverage. We established a protocol (Fig. 2 and suppl. Fig. S1) that generated the sharpest termination signals (see below). In brief, only reads R2 in pair-end sequencing (i.e. sequenced from the 3ʹ end) were processed. Both adapters were removed and poly-T tails corresponding to TdT-added poly A on cDNA were trimmed. Mapping on E. coli K-12 (substr. MG1655) genome was achieved with Bowtie 2 [30] with the – local option, that maximizes the stretch of correct matches at the end of a read. This option turned out to be essential because bases other than A sometimes occur in the added poly-A that prevent its complete removal at the trimming step. Finally, a CCA/TGG filter complementing the selective PCR step only kept mapped transcripts with CCA at the 3ʹ end. The quality and distribution of read lengths at each step, performed with FastQC (v0.11.5, Babraham Bioinformatics), are shown in supplemental Figure S1. After filtering, about 5 million to 9 million reads mapped onto the E. coli genome (Table 2; suppl. Fig. S1), allowing to establishing tRNA genomic coverages.
Figure 2.
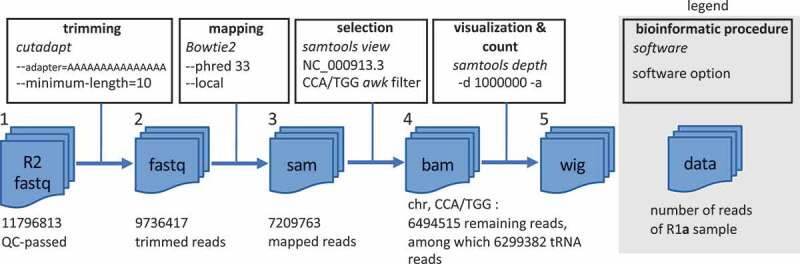
Computational workflow of deep-sequencing Illumina data processing (See Supplemental Figure S1 for details). Shown values are from the R1a sample (all samples provided similar results). Among half a dozen tested strategies, the established workflow provided the sharpest termination signals. From the initial QC-passed reads (1), trimmed reads (2) were obtained with cutadapt by identifying and trimming all TdT-added poly-A (i.e. poly-Ts on the tRNA gene sequence) with at least 15 nt. In a second step, a local mapping of the reads onto the E. coli genome with bowtie2 [30] was achieved, providing the mapped reads (3). The – local option maximizes the stretch of matching bases by removing mismatches at the end of the reads (softclipping). In a third step, mapped reads were filtered with a custom awk script to select only the reads ending with CCA/TGG (depending to the orientation of the tRNA on the genomic sequence), thus complementing the selection of mature tRNA achieved during library preparation. This operation provided the final mapping (4), from which a wig file (5) compiling the coverage of all expressed RNA genes was established with samtools depth using the – d 1,000,000 and – a options
Table 2.
Total read numbers of samples. Reads of tRNA are from the following genes (identical copies are indicated in brackets): (alaT, alaU, alaV), (alaX, alaW), (argQ, argV, argY, argZ), (argU), (argW), (argX), (asnT, asnU, asnV, asnW), (aspT, aspU, aspV), (cysT), (glnU, glnW), (glnV, glnX), (gltT, gltU, gltV, gltW), (glyT), (glyU), (glyV, glyW, glyX, glyY), (hisR), (ileT, ileU, ileV), (ileX), (ileY), (leuP), (leuQ, leuT, leuV), (leuU), (leuW), (leuX), (leuZ), (lysQ, lysT, lysV, lysW, lysY, lysZ), (metT, metU), (metV, metW, metZ), (metY), (pheU, pheV), (proK), (proL), (proM), (selC), (serT), (serU), (serV), (serW, serX), (thrT), (thrU), (thrV), (thrW), (trpT), (tyrT, tyrV), (tyrU), (valT, valU, valX, valY, valZ), (valV), (valW). Reads of pseudo tRNA are from the following genes: (pauD), (pawZ), (ptwF). Reads of tmRNA are from the following gene: (ssrA).
| Sample | Total reads mapped and CCA/TGG filtered | tRNA | pseudo tRNA | tmRNA |
|---|---|---|---|---|
| R1a | 6,494,515 | 6,299,382 (97,0%) |
45,775 (~1%) |
1,191 (~ 0.01%) |
| R2a | 5,150,196 | 5,026,263 (97,6%) |
44,260 (~1%) |
704 (~ 0.01%) |
| R3a | 6,941,871 | 6,793,490 (97,9%) |
67,948 (~1%) |
426 (~ 0.01%) |
| R1b | 7,229,758 | 7,056,586 (97,6%) |
91,245 (~1%) |
851 (~ 0.01%) |
| R2b | 6,803,833 | 6,669,159 (98,0%) |
45,793 (~1%) |
2,336 (~ 0.01%) |
| R3b | 7,551,225 | 7,385,017 (97,8%) |
103,008 (~1%) |
749 (~ 0.01%) |
| R1c | 9,045,057 | 8,899,275 (98,4%) |
54,894 (~1%) |
1,074 (~ 0.01%) |
| R2c | 7,457,325 | 7,301,761 (97,9%) |
54,527 (~1%) |
3,378 (~ 0.01%) |
| R3c | 6,771,946 | 6,598,669 (97,4%) |
82,914 (~1%) |
1,515 (~ 0.01%) |
Visualization
To connect ts signals with modified bases, all E. coli tRNA sequences from the Modomics database [23] were aligned onto the E. coli genome with blastn (ncbi-blast-2.5.0+), where a .gff file specifying the position of 661 modifications (suppl. File S2) allowed their visualization on IGV [31]. A separate .txt file (suppl. File S3) was used to generate plots connecting ts signals with tRNA sequences and modifications (Fig. 3B). Modifications one-letter-code are from the Modomics database (supplemental Table S1).
Figure 3.
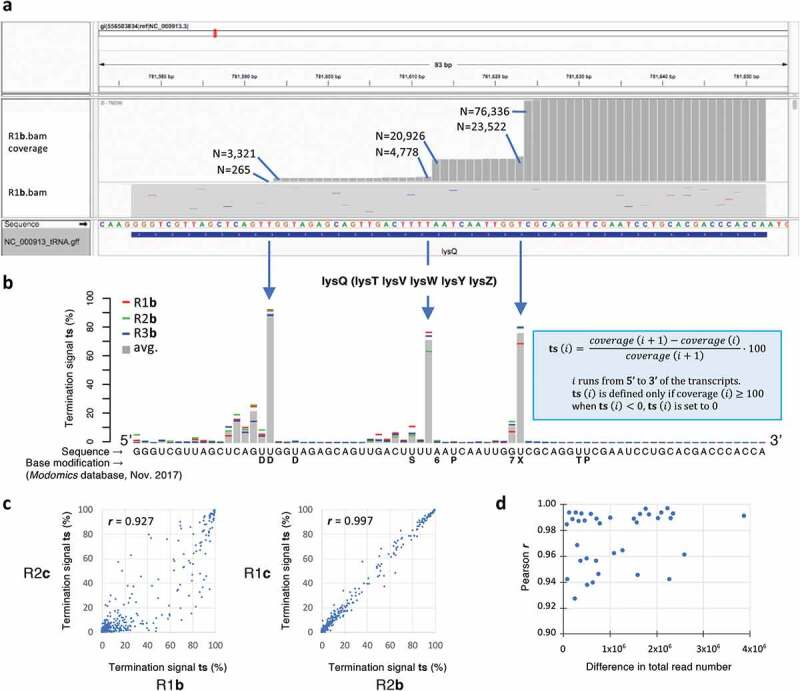
Table 3.
| R1a | R2a | R3a | R1b | R2b | R3b | R1c | R2c | R3c | |
|---|---|---|---|---|---|---|---|---|---|
| R1a | 1.0000 | **0.9643 | **0.9584 | *0.9463 | **0.9565 | **0.9623 | **0.9611 | ***0.9896 | **0.9686 |
| R2a | 1.0000 | ***0.9965 | ***0.9892 | ***0.9926 | ***0.9930 | ***0.9909 | *0.9424 | ***0.9861 | |
| R3a | 1.0000 | ***0.9937 | ***0.9937 | ***0.9926 | ***0.9935 | *0.9377 | ***0.9887 | ||
| R1b | 1.0000 | ***0.9928 | ***0.9871 | ***0.9923 | *0.9272 | ***0.9876 | |||
| R2b | 1.0000 | ***0.9890 | ***0.9968 | *0.9398 | ***0.9844 | ||||
| R3b | 1.0000 | ***0.9889 | *0.9422 | ***0.9853 | |||||
| R1c | 1.0000 | *0.9455 | ***0.9892 | ||||||
| R2c | 1.0000 | **0.9566 | |||||||
| R3c | 1.0000 |
Results
Analytical treatment of tRNA transcripts coverages
Examination of tRNA coverages (Fig. 3A) revealed that they were highly specific and reproducible. The coverages decrease from the terminal CCA3ʹ, with sudden jumps at locations of RT-impairing base modifications. Following analytical procedures introduced by Helm, Motorin and co-workers [3] and Pan and co-workers [5,19] these jumps were converted into termination signals (ts) highlighting the loss of coverage (in %) from nucleotide i + 1 to nucleotide i (Fig. 3B). A ts signal is defined only when coverage (i) ≥ 100 reads to ensure a minimal precision of the order of 1%. Furthermore, when negative values occur (reflecting very rare instances of amplified internal fragments), ts is set to zero. Fig. 3A illustrates the analysis with the R1b sample of lysQ, the coverage of which corresponds to the average expression of 6 identical genes (lysQ, lysT, lysV, lysW, lysY, lysZ). The average ts signal established from the R1b, R2b and R3b samples (Fig. 3B) allows to highlight three major termination events associated with base modifications (see below for the analysis). Although the amplitude of these signals fluctuates among samples, they all correlate well (Fig. 3C and Table 3): Pearson correlation coefficients (r) are all above 0.92, with 22/36 coefficients higher than 0.98 (all associated p values are zero). Two significant observations can be made from Table 3. First, the amplitude of ts signals does not depend on RNA treatment: the two samples related by the lowest r (0.927) are R1b and R2c (Fig. 3C, left), while the highest r (0.997) is observed between the R2b and R1c samples (Fig. 3C, right). It suggests that the difference in ts signal in between samples is essentially related to PCR amplification. Remarkably, these signals are not affected by the total read number of a sample (Fig. 3D), which constitutes an unexpected robustness of the method. It can thus be concluded that b and c treatments do not have noticeable effects on the ts analysis, and, within the range of values obtained in the present study (Table 2), ts signals are not affected by the total number of reads provided by a deep sequencing experiment. Because these signals display fluctuations that can be higher than 90%, single deep-sequencing experiments cannot accurately determine their characteristic values (Fig. 4A), a quantitative aspect that has not been addressed in earlier analyses based on aborted cDNA signals [e.g. 3,5]. Since ts signals were found not to be affected by total RNA treatments, we established the average ts standard deviation by combining a, b and c samples in each replicate R1, R2 and R3, and found an increase in the accuracy by a factor > 2 when three samples were combined (Fig. 4B; Table 4), the average standard deviation dropping from 6 to 3% for ts signals equal or higher than ~7% (i.e. tsR1+R2+R3 > 20). The decrease of the average standard deviation with the number of samples being approximately logarithmic, our data suggest that 7 to 8 independent sequencings provide signals ~10 times more accurate than single ones (supplemental Fig. S2). Furthermore, when samples are separately analysed, from 11 to 23 tRNAs sequences lack full 5ʹ ts characterization due to low coverage at the 5ʹ end. By combining the coverages of the 9 independently sequenced samples of the present study (Table 2), only about 3% of the combined tRNA sequence length could not be characterized (magenta lines in Fig. 5; see supplemental File S4). Combining independent samples has, therefore, a double benefit: it significantly increases the precision in the value of ts signals, required to assess the level of modification of residues, and allows to establishing a complete (or near complete) ts analysis of all tRNA sequences.
Figure 4.

Gain in precision obtained in the ts analysis when ts signals from 3 samples are averaged, as compared to signals obtained from single samples (illustration with valW tRNA). A) Comparison of ts values between three biological replicates (R1, R2 and R3) with a single sample (c treatment). B) Same comparison as in a, but with ts values of each biological replicate averaged over three samples (A, B and C). Because RNA sample treatment (A, B, C) were found not to noticeably alter ts signals (see Table 3 and text), they are considered as equivalent. For a global quantitative analysis, see Table 4
Table 4.
Comparison between biological replicates R1, R2 and R3: average ts standard deviation (%) as a function of the number of samples (a, b and/or c), established for four ts threshold. TsR1+R2+R3 > x implies that a particular standard deviation is computed only if the sum of ts signals of the three replicates at a given position is > x. About 2,500 ts values are simultaneously determined in all three replicates for a considered set of samples (the total number of nucleotide positions, including all tRNAs and three tRNA pseudogenes, is 3,916). Standard deviations are established for all possible combinations of samples. With one sample (A), there are 33 = 27 combinations. With two samples (B), there are also 33 = 27 combinations (ex: avg. (R1a, R1c); avg. (R2a, R2b); avg. (R3b, R3c)), whereas only one possibility occurs with three samples (C)
| ts threshold | A. 1 sample (a, b or c) | B. Avg., 2 samples (all comb.) | C. Avg., 3 samples (a, b, c) | ratio A/C |
|---|---|---|---|---|
| tsR1+R2+R3 > 0 | 0.719 (N = 66,781) | 0.456 (N = 68,775) | 0.324 (N = 2,538) | 2.22 |
| tsR1+R2+R3 > 1 | 1.952 (N = 23,239) | 1.278 (N = 23,070) | 0.920 (N = 839) | 2.12 |
| tsR1+R2+R3 > 10 | 5.230 (N = 6,977) | 3.467 (N = 6,863) | 2.520 (N = 249) | 2.08 |
| tsR1+R2+R3 > 20 | 6.249 (N = 5,204) | 4.177 (N = 5,172) | 3.033 (N = 188) | 2.06 |
Figure 5.

Atlas of ts signals of all E. coli tRNAs, with base modifications reported from Modomics (as of Nov. 2017), with one correction: only one D modification could be attributed to serW (serX). Modomics-uncharacterized tRNAs are underlined with grey lines. Identical tRNA genes are represented only once (copies are listed in brackets). Ts signals are established from the combined coverage of all 9 samples of the present work (Table 2). Magenta lines highlight 5ʹ portions of tRNAs for which the total coverage was too low to establish ts signals. Plots with individual ts values for all 9 samples are available in Supplemental File S4
Termination signal analysis of E. coli tRNA transcripts
The ts analysis generates signals similar to the arrest rate [3] and modification index [5,19]. It provides a set of characteristic signals reflecting the modification state of a tRNA. Some modifications, such as P and T, can only be revealed by chemical treatments that make them interfering with RT enzymes [32,33]. These were not investigated in the present study. To facilitate a rapid assessment of all tRNAs, four types of modifications are highlighted in Fig. 5 (see supplemental Table S1 for one letter code). Green dots indicate the T and P modifications of the T-loop, for which no interference with the RT enzyme is noticeable. Blue dots highlight the D modification, with which strong ts signals are observed when three or more of such residues are present (see below). Orange dots signal modifications for which strong ts signals are observed only when two or more of such modifications are in close vicinity (V, %, {, 6, Q, c, *, $, S, B, M and +) while red dots highlight modifications that are always interfering strongly with the RT enzyme (X, K, *, }) and E). Modifications that do essentially not affect the path of the RT enzyme (such as 4 and #) are left unhighlighted.
When modified residues are close to each other, non-linear ts amplifications are observed, a situation that can be attributed to the combined burden that these modifications impose to the core of the RT enzyme. It is thus often not possible to relate specific ts signals with a given modification, although the pattern of these signals is most often altered if a modification is missing. Also, when stretches of U residues occur on the 3ʹ side of modified bases, the position of ts signal(s) resulting from the interference with the RT enzyme is shifted to the 3ʹ side due to poly-T computational trimming on DNA reads (see Section ‘Computational treatment of deep-sequencing data’ and supplemental Fig. S3). This effect is highlighted in figures with blue arrows.
Following the path of the RT enzyme, ts signals are analysed below from the 3ʹ end to 5ʹ end (Fig. 6A), crossing four regions highlighted in green (from the 3ʹ end to the 5ʹ side of the T-arm), salmon (variable loop), sand (anticodon stem-loop) and blue (from the D-loop to the 5ʹ end).
Figure 6.

A) Standard tRNA nucleotide numbering according to the tRNA gene database curated by experts website [39]. The coloured regions correspond to the four successively analysed tRNA segments, from 3ʹ to 5ʹ: green, red, sand and blue. B) Ts analysis from pos. 76 to pos. 48 (green segment), established from an alignment of all tRNA transcripts. The sample with the highest values (R3c) is highlighted with a thick line. The left inset illustrates individual tRNA values (and the average) of the R3c sample. The right inset shows the sum of the ts signal as a function of the number of (G + C) residues in positions 61 to 65. Each blue dot corresponds to a tRNA; values averaged over all 9 samples (see Table 1). Red dots correspond to values averaged over all tRNAs. The base conservation logo reported at the bottom is based on all E. coli tRNA listed in Modomics. Because T and P modifications correspond to a stretch of two As on the cDNA, the ts signal of the two residues essentially combine into a single signal on the P residue (blue arrow) (see Material and Methods). C) Ts analysis of the variable loop (red segment). Ts signal in pos. 47 for all tRNAs bearing the 7 modification in pos. 46, according to Modomics. For tRNAs with multiple gene copies (e.g. asnT, asnU, asnV, asnW), only one set of values is indicated. tRNA genes are ranked from left to right following an increasing average value of the ts signal. The vertical dashed line splits tRNAs into those with U (left) from those with X in pos. 47 according to Modomics (as of Nov. 2017). Insets illustrate three ts signals. D) Sum of ts values from pos. 40 to 46 (trailing ts signals) as a function of the ts value in pos. 47. Note that according to the Modomics database, all E. coli tRNAs with 7 and X modifications do not have any e residue in the variable loop, implying that the sequences analysed in C and D follow standard numbering (panel A)
Region of the T-arm
The length encompassing the 3ʹ end of the tRNA to the 5ʹ side of the T-arm being highly conserved (it comprises 28 nucleotides in E. coli, tRNAsel being the only exception with 27 nts), we performed the ts analysis at once by combining signals of all tRNAs (Fig. 6B). Only T and P modifications are present, which do not constitute an obstacle to the RT enzyme [32]. From the 3ʹ end, the first region presenting a significant (albeit very low) ts signal starts after the entry of the T-arm (pos. 65; red arrow). It appears to be related to the RT enzyme encountering the densely folded region of the tRNA, as suggested by a correlation between the proportion of (G + C) residues in the T-arm and the summed ts signals along this segment (Fig. 6B, right inset). The line chart of Fig. 6B reveals that the profile of the average signal is highly reproducible: essentially only the amplitude varies among the 9 samples, an effect that we attribute to PCR amplification. The ts signals of pos. 54 and 55 (T and P) combine on pos. 55 (blue arrow on Fig. 6B) as a result of poly-A computational trimming (supplemental Figure S3). The variability of the ts signal for individual tRNAs (Fig. 6B, left inset) reveals that it is highly sequence dependent, even though the amplitude of this variability is small.
Region of the variable loop
Only two modified bases are present at the start of the variable loop in some E. coli tRNA: 3-(3-amino-3-carboxypropyl) uridine (X) and 7-methylguanosine (7). X is analogue to N1-Methyl-3-(3-amino-3-carboxypropyl)-pseudouridine, known to allow only minimal bypass by RT enzymes, while 7 was demonstrated not to detectably affect reverse transcription [32]. According to the Modomics database, the 7 modification is present in position 46 in slightly more than 50% of all E. coli tRNAs, and only when 7 is present does X occur in position 47 for half of these tRNAs. Our data show that a strong ts signal is always present when X is listed in Modomics (Fig. 6C). Furthermore, additional ‘trailing’ ts signals occur on the 5ʹ side of the major ts signal when it is higher than ~80% (Fig. 6D). Two important deductions can be made from our results: Fig. 6C shows that the ts signal associated with X cannot unambiguously separate 7 U from 7X-modified tRNAs, suggesting that all tRNAs with 7U in positions 46–47 are converted to 7X to some extent although they may not be listed as such in Modomics (prominent cases are argX and hisR). This observation corroborates biochemical analyses performed by Meyer et al. [34], who showed that the modifications of these two residues are interdependent. Furthermore, the value of the ts signal in position 47 converges towards ~97% when the overall signal reaches the highest values (Fig. 6D). Assuming that the fraction of X-modified tRNAs reaches 100% in that case, the bypass rate of this modification by the RT enzyme is of about 3%, the y-axis of Fig. 6C thus representing roughly the percentage at which U47 is converted into X on the tRNAs. A straightforward interpretation of trailing ts signals is that RT enzymes bypassing the X modification drop off one or a few nucleotides downstream as a result of the perturbation caused by the modification embedded in the chimeric cDNA/RNA duplex.
Region of the anticodon loop
The anticodon loop is by far the region with the most diverse types of modifications [23]. Fig. 7 and supplemental Figure S4 highlight ts signals generated by some of the most frequent E. coli modifications.
Figure 7.

Ts analysis of the anticodon loop. Plots of the average values and standard deviations established from all 9 samples (Table 1), highlighting ts signatures of some typical E. coli combinations of modifications (panels A to I) and their ts error that occur when only a single sample is considered. Anticodons are boxed in magenta. Known modifications are reported from the Modomics database below the sequences (5ʹ-3ʹ). Highlighted modifications (in orange and red) are illustrated above in the same order (cartoons are from the Modomics website). A blue arrow indicates a shift of a ts signal associated with a modification as a result of the presence of U residue(s) on its 3ʹ side (highlighted in blue), an artefact caused by poly-T computational trimming (see Materials and Methods). Red arrows highlight the shift of the ts signal to the 5ʹ direction observed with the 6 modification. The ts signal could not be established on the 5ʹ side of the } modification for IleX (panel D, dashed lines) in all samples. Although Inosine (I) is associated with a low ts signal (panel I), an examination of the read coverage shows that it leads to incorporation of 86%C and 14%U on the cDNA, a typical signal of the presence of this modification [6]
N6-threonylcarbamoyladenosine (6)
This large modified base appears to constitute a moderate obstacle to the RT enzyme (Fig. 7A, B, D, E, H). Unexpectedly, a major ts signal is not present at the location of the modification, but one base downstream the path of the RT enzyme (small red arrow), suggesting that it generates an impediment only after being incorporated into the cDNA/RNA duplex. An examination of the read processing revealed that the observed ts pattern (Fig. 7A) is partly the result of incomplete 5ʹ poly-A trimming due to the incorporation of other bases (often a C) in the poly-A, followed by local mapping (supplemental Fig. S3). Thus, the pattern of ts signals associated with a modification may not always be interpreted as a direct consequence of the interaction between the modification and the RT enzyme. Interference of 6 with other modifications: 6, that is only found in pos. 37, is often accompanied by other modifications in pos. 34 (Q, S) or in pos. 32 (%). Fig. 7B, 7E and 7H show that whenever this occurs, the combined perturbations generate a ts response that is stronger than a linear combination of individual ts signals (see below).
Queuosine (Q)
The effect of this large modification on RT processivity was not assessed in the seminal work of Motorin et al. [32]. Surprisingly, it does not generate a strong ts signal (Fig. 7C), suggesting that the RT enzyme can easily cross this residue if it is not in the vicinity of other modifications (Fig. 7B).
5-methylaminomethyl-2-thiouridine (S)
This modification generates a small ts signal (Fig. 7F) similar to Q (Fig. 7C). When combined with 6, the resulting ts signal (Fig. 7E) is similar to that of the 6-Q combination (Fig. 7B).
2-thiocytidine (%)
The nearly isosteric C2-O → C2-S modification of C does not generate any ts signal when it is in an unperturbed environment such as the one shown in FIg. 7I. In that case, the closest modified neighbour is an inosine (I), which is known not to interfere with the RT enzyme, although it leads to the incorporation of C and U [32]. However, in the context of a 6 modification in pos. 37 (Fig. 7H), % generates an unexpectedly high ts signal, suggesting that additional modification(s) unlisted in Modomics could be present on the % residue in that case.
2-methyladenosine (/)
This modification was found to only generate RT pause at low dNTP concentration [32]. Representative examples (Fig. 7C, f, i) show that it is indeed associated with almost no ts signal.
2-lysidine (})
Only one E. coli tRNA bears this large modification, that is associated with a strong ts signal (Fig. 7D).
1-methylguanosine (K)
This small modification is known to constitute a major obstacle for the RT enzyme [5,32]. This can clearly be seen in our data: with proK tRNA (Fig. 7G, left), the average ts signal at the position of the modification is as high as 99.65 ± 0.08%, corresponding to a coverage drop from 283,925 to 864 reads with the R1b sample. Assuming a rate of modification of 100% in that case implies a bypass rate of the order of 0.35%. As a result of computational trimming, the major ts signal is shifted when a pseudouridine (P) is present on its 3ʹ side (Fig. 7G, right).
2-methylthio-N6-isopentenyladenosine (*)
This base has a complex pattern of modifications that is expected to strongly impair the RT enzyme. It consistently generates a high ts signal (supplemental Fig. S4a). All related tRNAs only have 7, T and P modifications upstream the path of the RT enzyme, which do not affect its processivity. The only exception is pheU (pheV), that bears the dual 7X modifications in the variable loop. Although this early roadblock generates a strong ts signal in these tRNAs, our data show that the ts signal at the * position is identical to that of other tRNAs (supplemental Fig. S4b), demonstrating that ts signals generated by distant modifications along transcripts may be considered as independent.
Uridine 5-oxyacetic acid (V)
In a way similar to the % modification, V essentially does not generate any ts signal when occurring in a sequence context without perturbing modifications (supplemental Fig. S4c, d). When other nearby modifications are present, such as in the case of LeuW, the effect of this base is difficult to assess because stretches of U are present (supplemental Fig. S4e).
2′-O-methylcytidine (B)
This modification is known to generate RT pauses at low dNTP concentration [32]. In a sequence context without any other modified base, B does only generate a faint ts signal similar to V (supplemental Fig. S4f). With a * modification 6 bases upstream the path of the RT enzyme, the associated ts signal is slightly more pronounced (supplemental Fig. S4g), and with an additional V residue in between B and *, a strong and complex ts pattern is observed (supplemental Fig. S4h). This last example illustrates the non-linear response of the ts signal in the presence of three modifications, two of which do almost not generate any signal when found isolated (supplemental Fig. S4c, f).
Region of the D-loop
Dihydrouridine (D)
With 152 reported instances, D is the most frequent tRNA modification found in E. coli MG1655 tRNAs according to the Modomics database. Because the D-loop is located near the 5ʹ end, there is often not much exploitable signal in each sample due to 3ʹ upstream termination events caused by RT-blocking modifications (Fig. 3A). However, with the coverage provided by 9 deep-sequencing samples, accurate ts signals can be established up to the 5ʹ end for all but 5 weakly expressed tRNAs (Fig. 5). D is known to only create RT pauses [32]. The presence of major ts signals associated with this modification therefore came as a surprise. It turns out that these signals are highly dependent on the number of dihydrouridine(s) known to occur on the D-loop, a phenomenon already noticed by Clark et al. [19], although our quantitative analysis leads to a different conclusion with regard to the effect. Considering the sum of ts signals in 11-nt windows centred on each dihydrouridine, a near clear-cut threshold separates loops with one and two from those with three and four dihydrouridines when the window with highest ts sum is considered (Fig. 8A, B). No clear sequence context allows to predict the position of the major ts signal, which can be associated either with a doublet of dihydrouridines (glyV) or with one dihydrouridine (ileT). Furthermore, it can occur ‘early’ (aspT) or ‘late’ (ileT) along the path of the RT enzyme (Fig. 5). Clark et al. [19] found a strong signal associated with a doublet of dihydrouridine in human tRNAasn (GUU), and concluded that a doublet sufficiently destabilizes the RT enzyme to lead to transcription abortion. Our analysis suggests instead that all three U residues present on the D-loop of this tRNA are likely modified. Similarly, our analysis predicts the presence of an unknown D modification on the D-loop of leuW, where only two dihydrouridines are listed in the Modomics database. The ts signal analysis (Fig. 8B) and a sequence context that is identical to that of five other leucine tRNAs where an analogous uridine is modified (Fig. 8D) are indeed both consistent with the presence of a third dihydrouridine. With a high ts signal and only two possible D modifications on the loop, the case of serT is less clear (Fig. 8D). Examination of the Modomics database reveals that whenever a uridine is present in the D-loop, it is essentially modified into D, with two exceptions, glyT and argU (Fig. 8C). Our predictive analysis (Fig. 8B) suggests that at least two among the four uridines present in the D-loop of glyT are indeed not modified (Fig. 8D), supporting the possibility of this exception (the ts signal associated with argU cannot be unambiguously interpreted).
Figure 8.
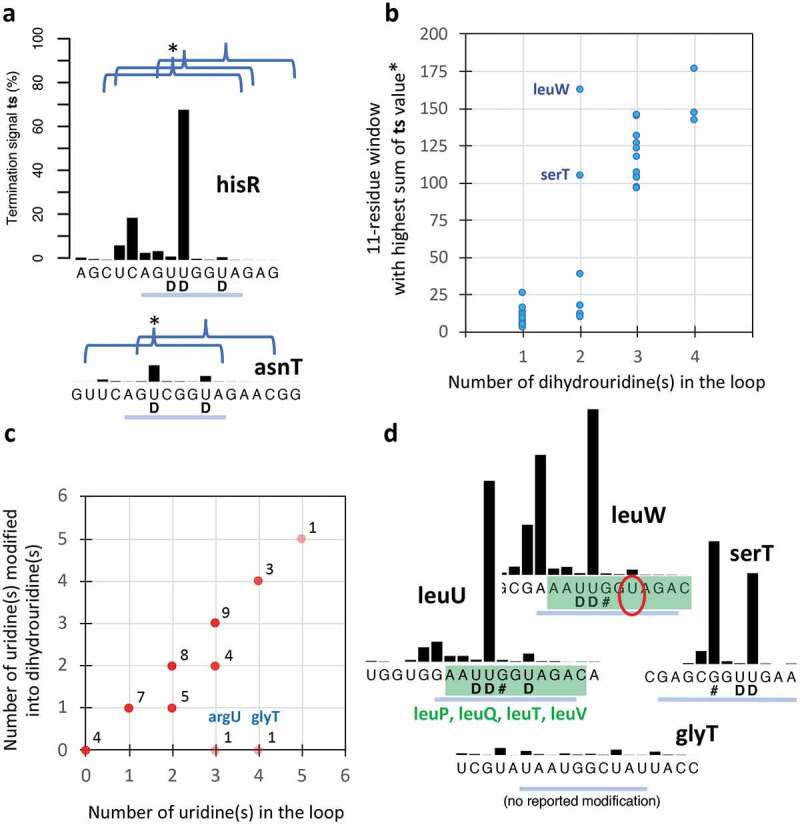
Ts analysis of the D-loop. A) Illustration of the effect of the presence of ≥ 3 (hisR, on top) and < 3 (asnT, bottom) dihydrouridine modifications. The curly brackets encompassing a window of 11 nts are centred on every reported dihydrouridine modification (this size allows to include most of the associated ts signal). B) Plot of the sum of ts signals in the window with the highest signal (*) as a function of the number of reported dihydrouridine modifications. C) Plots of the number of uridine(S) modified into dihydrouridine(s) in the D-loop according to the Modomics database (nov. 2017). In two cases, with 3 and 4 uridines (argU and glyT), no such modification has been reported. D) Ts signal and sequence similarity (in green) between leuU, leuP, leuQ, leuT, leuV, for which three dihydrouridines have been reported, and leuW, for which the ts analysis (in B) and sequence similarity predict the presence of a third unlisted dihydrouridine (circled). The low ts signal of glyT is consistent with the absence of at least two dihydrouridine modifications among the four uridines of the loop. Ts values are established from the combined coverage of all 9 samples (Table 1). D-loop segments are highlighted with a blue line
Quantification of -CCA ending tRNA transcripts
Since amplified 3ʹ tRNA segments are always long enough to be uniquely mapped onto the genome (except for identical tRNA genes), a relative frequency of tRNA isoacceptors can be established by reporting the number of reads at the position of the 3ʹ end (Fig. 9A; see also Fig. 3A). It is, however, important to keep in mind the non-linear nature of PCR amplification, that changes RNA transcripts true relative frequencies. Fig. 9A shows that the observed frequencies are comparable among all three biological replicates, and that sample treatment (a, b or c) only has a marginal effect, except for isoacceptors for which the amino acyl linkage is particularly resistant (ile, val) or prone to hydrolysis (ser) [35]. In the first case, deacylation increases these frequencies, while isoacceptors that are already substantially deacylated without any treatment become proportionally less represented (ser). Our data thus show that deacylation still occurs with a and b samples, that allowed the ligation of the RNA adapter. The mild pH of the RNA adapter ligation step (pH 7.5; overnight incubation at 10°C) is likely responsible for this phenomenon. Deacylated samples (c) provide a picture of the population of all tRNA isoacceptors regardless of their aminoacylation state. Fig. 9B shows that their relative frequency mainly follows that of their corresponding codons in the E. coli genome, a phenomenon that is expected based on tRNA gene copy number (Fig. 9C) [36; 37]. Transcripts of a group of isoacceptors (gln, asp, ser, glt, val gly and ala), however, appear significantly underrepresented, a feature that was not observed in a study in which quantification was achieved by probe hybridization on gel ([21]; supplemental Fig. S5). While we could not find a clear explanation for this result, it is possibly related to the -CCA 3ʹ end requirement of our protocol. The 3ʹ terminal adenosine can be specifically removed by RNase T in E. coli [24,25], in which case these tRNAs would not be amplified. Results of conventional deep sequencing indeed show that a significant proportion of tRNA 3ʹ segments lack the terminal adenosine (unpublished results), suggesting that the removal of this residue, that can be re-added by the CCA-adding enzyme, may play a role in translation regulation. A tRNA quality control mechanism involving these two enzymes has also been suggested [29]. The reason for which the relative frequency of these seven CCA-ending isoacceptors is unexpectedly low might be related to the cellular concentration of their cognate amino acid (Fig. 9B): in E. coli cells grown in conditions similar to that of our cultures, five of these amino acids were found to be at least one order of magnitude more abundant than the other ones [38], while the amino acid of the most underrepresented isoacceptor, glt, is even 103 times more abundant in normal growth conditions. High substrate concentration enables a fast turnover of tRNA aminoacylation, which might abrogate the necessity for a large amount of functional isoacceptors. Further experiments are required to clarify this issue.
Figure 9.

Relative quantification of E. coli CCA-ending tRNA isoacceptors (cultures grown in LB medium, sampled at OD650 nm ≈ 0.4) and codon usage. A) Relative quantification of tRNA isoacceptors as established form the coverages at the 3ʹ position of each tRNA (see Fig. 3a; values are in Supplemental File S6). Each bar represents the average relative frequency calculated over three replicates: a = <R1a, R2a, R3a>; b = <R1b, R2b, R3b>; c = <R1c, R2c, R3c >. B) Relative frequency of CCA-ending tRNA isoacceptors as a function of codon frequency in the E. coli K12 genome*. Inset: intracellular concentrations of encoded amino acids in E. coli as determined by Bennett et al. [38]. Cells grown under normal conditions, with glucose as the major source of carbon; cultures sampled at OD650 nm = 0.35. Glycine is the only encoded amino acid for which concentration was not determined in this study. C) E. coli MG1655 tRNA gene copy number as a function of codon frequency*
*data from https://openwetware.org/wiki/Escherichia_coli/Codon_usage
Discussion
Compared to recent tRNA sequencing proposals [1, , 2, 3, 5, 6], the present method is relatively easier to implement because no total RNA demethylase treatment and/or RNA fragmentation are required. Furthermore, we found that a conventional RT enzyme (Superscript III) is processive enough to generate signals far to the 5ʹ end of the tRNAs. Avoiding fragmentation enables an accurate gene mapping of all reads, as they all start at the 3ʹ end of the tRNA, where essential identity elements are present. Two methodological aspects ensure the lowest possible bias: first, the ligation of the 3ʹ adapter is non-selective due to the invariant CCA3ʹ dangling end of mature tRNAs, that are specifically amplified by GGT-ending primer during a first round of PCR. This feature of our protocol also allows to virtually remove all background noise present in current protocols [2, 3,19]. Second, TdT polyadenylation of cDNA after reverse transcription circumvents the issue of inefficient 5ʹ tRNA adapter ligation in conventional deep-sequencing protocols. Circularization of cDNA, which was used by Pan and coworkers [5] in their protocol, is another possibility. The obtained termination signals (ts) provide an atlas of the modified state of all tRNAs (Fig. 4). Furthermore, we showed that two limitations inherent to deep-sequencing experiments and the use of a conventional RT enzyme are simultaneously resolved by combining several samples: a significant gain in the accuracy of ts signals is achieved, and these signals can be established down to the 3ʹ end of all tRNAs. The combined tRNA read coverage of the 9 samples reported in the present study, totalizing about 62 million mapped R2 reads, were just short of generating a full tRNA ts atlas: about 3% of sequence length was left uncharacterized (magenta lines in Fig. 4). However, current standards of Illumina sequencing experiments generate 200 million reads. Based on the results of our computational processing, in which about 60% of the initial reads were mapped, full tRNA characterization is almost certainly achievable with a single Illumina sequencing experiment. While some modifications do not interfere with the RT enzyme, RNA chemical treatment may alter these silent modifications and make them visible [32], a procedure that has recently been applied [33] with an alternate protocol. Several silent modifications can still be detected when they occur nearby each other (highlighted in orange in Fig. 4), implying that a change of the ts pattern can be observed if one modification is missing. So far, near complete sets of tRNA modifications are available only for a couple of organisms in Modomics [23]. Besides Escherichia coli (43 out of the 48 tRNAs of the MG1655 strain are annotated), species with exhaustive repertoire of tRNA modifications are Streptomyces griseus, Haloferax volcanii, Mycoplasma capricolum, Lactococcus lactis and Saccharomyces cerevisiae. For most other species, alternate databases or specific investigations may provide the missing information (supplemental Table S2). When no data is available, an extensive amount of work will still be required to establish all tRNA modifications of the organism or organelle under investigation. However, the potentially unlimited accuracy of the ts signal analysis outlined in the present work, which only depends on the number of deep-sequenced samples, may allow the identification of tRNA positions with altered modification patterns by comparing ts atlas of reference subjects to that of subjects with different genotype, or exposed to different environmental conditions, or with different health or physiological condition(s). This would allow to quickly narrow down the investigation to one or some modification enzymes that may be associated with perturbed modification pattern(s) identified on some tRNAs (suppl. Fig. S6). Thus, while the present method may not directly allow the identification of highlighted modifications, its power is to provide a robust and extensive diagnostic of the modified state and relative frequencies of all cellular tRNAs with minimal benchwork
Supplementary Material
Acknowledgments
We thank Jinwei Zhang, Charles Bou-Nader, Sine Lo Svenningsen, Michael A. Sørensen and Shixin Ye for helpful comments and suggestions on several aspects of our analysis, and Philippe Bouloc for providing lab space and a stimulating working environment.
Funding Statement
This work was supported by the Chinese Scholarship Council [201206140111].
Disclosure statement
No potential conflict of interest was reported by the authors.
Authors contribution
JL and DG conceived of the project. JW and FL performed the experimental work. JL, DG, JW, and CT interpreted the results and performed the analysis. JL wrote the manuscript, with inputs from DG, CT and JW. CT and DG implemented the computational pipeline. All authors read and approved the manuscript.
Supplementary material
Supplemental data for this article can be accessed here.
References
- [1].Cozen AE, Quartley E, Holmes AD, et al. ARM-seq: alkB-facilitated RNA methylation sequencing reveals a complex landscape of modified tRNA fragments. Nat Methods. 2015;12:879–884. [DOI] [PMC free article] [PubMed] [Google Scholar]
- [2].Gogakos T, Brown M, Garzia A, et al. Characterizing expression and processing of precursor and mature human tRNAs by Hydro-tRNAseq and PAR-CLIP. Cell Rep. 2017;20:1463–1475. [DOI] [PMC free article] [PubMed] [Google Scholar]
- [3].Hauenschild R, Tserovski L, Schmid K, et al. The reverse transcription signature of N-1 methyladenosine in RNA-Seq is sequence dependent. Nucleic Acids Res. 2015;43:9950–9964. [DOI] [PMC free article] [PubMed] [Google Scholar]
- [4].Shigematsu M, Honda S, Loher P, et al. YAMAT-seq: an efficient method for high-throughput sequencing of mature transfer RNAs. Nucleic Acids Res. 2017;45:e70. [DOI] [PMC free article] [PubMed] [Google Scholar]
- [5].Zheng G, Qin Y, Clark WC, et al. Efficient and quantitative high-throughput tRNA sequencing. Nat Methods. 2015;12:835–837. [DOI] [PMC free article] [PubMed] [Google Scholar]
- [6].Schwartz S, Motorin Y.. Next-generation sequencing technologies for detection of modified nucleotides in RNAs. RNA Biol. 2017;14:1124–1137. [DOI] [PMC free article] [PubMed] [Google Scholar]
- [7].Krutyhołowa R, Zakrzewski K, Glatt S.. Charging the code - tRNA modification complexes. Curr Opin Struct Biol. 2019;55:138–146. [DOI] [PubMed] [Google Scholar]
- [8].Baldridge KC, Jora M, Maranhao AC, et al. Directed evolution of heterologous tRNAs leads to reduced dependence on post-transcriptional modifications. ACS Synth Biol. 2018;7:1315–1327. [DOI] [PubMed] [Google Scholar]
- [9].Chan C, Pham P, Dedon PC, et al. Lifestyle modifications: coordinating the tRNA epitranscriptome with codon bias to adapt translation during stress responses. Genome Biol. 2018;19:228. [DOI] [PMC free article] [PubMed] [Google Scholar]
- [10].Novoa EM, Pavon-Eternod M, Pan T, et al. A role for tRNA modifications in genome structure and codon usage. Cell. 2012;149:202–213. [DOI] [PubMed] [Google Scholar]
- [11].Bohnsack MT, Sloan KE.. The mitochondrial epitranscriptome: the roles of RNA modifications in mitochondrial translation and human disease. Cell Mol Life Sci. 2018;75:241–260. [DOI] [PMC free article] [PubMed] [Google Scholar]
- [12].de Crécy-lagard V, Boccaletto P, Mangleburg CG, et al. Matching tRNA modifications in humans to their known and predicted enzymes. Nucleic Acids Res. 2019;47:2143–2159. [DOI] [PMC free article] [PubMed] [Google Scholar]
- [13].Jonkhout N, Tran J, Smith MA, et al. the RNA modification landscape in human disease. RNA. 2017;23:1754–1769. [DOI] [PMC free article] [PubMed] [Google Scholar]
- [14].Ng CS, Sinha A, Aniweh Y, et al. tRNA epitranscriptomics and biased codon are linked to proteome expression in Plasmodium falciparum. Mol Syst Biol. 2018;14:e8009. [DOI] [PMC free article] [PubMed] [Google Scholar]
- [15].Pollo-Oliveira L, de Crécy-lagard V. Can protein expression be regulated by modulation of tRNA modification profiles? Biochemistry. 2018;58:355–362. [DOI] [PMC free article] [PubMed] [Google Scholar]
- [16].Richter U, Evans ME, Clark WC, et al. RNA modification landscape of the human mitochondrial tRNALys regulates protein synthesis. Nat Commun. 2018;9:3966. [DOI] [PMC free article] [PubMed] [Google Scholar]
- [17].Ryvkin P, Leung YY, Silverman IM, et al. HAMR: high-throughput annotation of modified ribonucleotides. RNA. 2013;19:1684–1692. [DOI] [PMC free article] [PubMed] [Google Scholar]
- [18].Vandivier LE, Anderson ZD, Gregory BD. HAMR: high-throughput annotation of modified ribonucleotides. Methods Mol Biol. 2019;1870:51–67. [DOI] [PubMed] [Google Scholar]
- [19].Clark WC, Evans ME, Dominissini D, Zheng G, Pan T.. tRNA base methylation identification and quantification via high-throughput sequencing. RNA. 2016;22:1771––1784.. doi: 10.1261/rna.056531.116 [DOI] [PMC free article] [PubMed] [Google Scholar]
- [20].Helm M, Motorin Y. Detecting RNA modifications in the epitranscriptome: predict and validate. Nat Rev Genet. 2017;18:275–291. [DOI] [PubMed] [Google Scholar]
- [21].Dong H, Nilsson L, Kurland CG. Co-variation of tRNA abundance and codon usage in Escherichia coli at different growth rates. J Mol Biol. 1996;260:649–663. [DOI] [PubMed] [Google Scholar]
- [22].Motorin Y, Helm M. Methods for RNA modification mapping using deep sequencing: established and new emerging technologies. Genes (Basel). 2019;10:35. [DOI] [PMC free article] [PubMed] [Google Scholar]
- [23].Boccaletto P, Machnicka MA, Purta E, et al. MODOMICS: a database of RNA modification pathways. 2017 update. Nucleic Acids Res. 2018;4(46(D1)):D303–D307. [DOI] [PMC free article] [PubMed] [Google Scholar]
- [24].Deutscher MP, Marlor CW, Zaniewski R. Ribonuclease T: new exoribonuclease possibly involved in end-turnover of tRNA. Proc Natl Acad Sci. 1984;81:4290–4293. [DOI] [PMC free article] [PubMed] [Google Scholar]
- [25].Deutscher MP, Marlor CW, Zaniewski R. RNase T is responsible for the end-turnover of tRNA in Escherichia coli. Proc Natl Acad Sci. 1985;82:6427–6430. [DOI] [PMC free article] [PubMed] [Google Scholar]
- [26].Czech A. Deep sequencing of tRNA’s 3ʹ-termini sheds light on CCA-tail integrity and maturation. RNA. 2020;26:199–208. [DOI] [PMC free article] [PubMed] [Google Scholar]
- [27].Li Z, Deutscher MP. RNase E plays an essential role in the maturation of Escherichia coli tRNA precursors. RNA. 2002;8:97–109. [DOI] [PMC free article] [PubMed] [Google Scholar]
- [28].Mohanty BK, Maples VF, Kushner SR. Polyadenylation helps regulate functional tRNA levels in Escherichia coli. Nucleic Acids Res. 2012;40:4589–4603. [DOI] [PMC free article] [PubMed] [Google Scholar]
- [29].Wellner K, Czech A, Ignatova Z, et al. Examining tRNA 3ʹ-ends in Escherichia coli: teamwork between CCA-adding enzyme, RNase T, and RNase R. RNA. 2018;24:361–370. [DOI] [PMC free article] [PubMed] [Google Scholar]
- [30].Langmead B, Salzberg SL. Fast gapped-read alignment with Bowtie 2. Nat Methods. 2012;9:357–359. [DOI] [PMC free article] [PubMed] [Google Scholar]
- [31].Thorvaldsdóttir H, Robinson JT, Mesirov JP. Integrative Genomics Viewer (IGV): high-performance genomics data visualization and exploration. Brief Bioinform. 2013;14:178–192. [DOI] [PMC free article] [PubMed] [Google Scholar]
- [32].Motorin Y, Muller S, Behm-Ansmant I, et al. Identification of modified residues in RNAs by reverse transcription-based methods. Methods Enzymol. 2007;425:21–53. [DOI] [PubMed] [Google Scholar]
- [33].Zhang W, Eckwahl MJ, Zhou KI, et al. Sensitive and quantitative probing of pseudouridine modification in mRNA and long noncoding RNA. RNA. 2019;25:1218–1225. [DOI] [PMC free article] [PubMed] [Google Scholar]
- [34].Meyer B, Immer C, Kaiser S, et al. Identification of the 3-amino-3-carboxypropyl (acp) transferase enzyme responsible for acp3U formation at position 47 in Escherichia coli tRNAs. Nucleic Acids Res. 2020;48:1435–1450. [DOI] [PMC free article] [PubMed] [Google Scholar]
- [35].Matthaei JH, Voigt HP, Heller G, et al. Specific interactions of ribosomes in decoding. Cold Spring Harb Symp Quat Biol. 1966;31:25–38. [DOI] [PubMed] [Google Scholar]
- [36].Du MZ, Wei W, Qin L, et al. Co-adaption of tRNA gene copy number and amino acid usage influences translation rates in three life domains. DNA Res. 2017;24:623–633. [DOI] [PMC free article] [PubMed] [Google Scholar]
- [37].Higgs PG, Ran W. Coevolution of codon usage and tRNA genes leads to alternative stable states of biased codon usage. Mol Biol Evol. 2008;25:2279–2291. [DOI] [PubMed] [Google Scholar]
- [38].Bennett BD, Kimball EH, Gao M, et al. Absolute metabolite concentrations and implied enzyme active site occupancy in Escherichia coli. Nat Chem Biol. 2009;5:593–599. [DOI] [PMC free article] [PubMed] [Google Scholar]
- [39].Abe T, Inokuchi H, Yamada Y, et al. tRNADB-CE: tRNA gene database well-timed in the era of big sequence data. Front Genet. 2014;5:114. [DOI] [PMC free article] [PubMed] [Google Scholar]
Associated Data
This section collects any data citations, data availability statements, or supplementary materials included in this article.