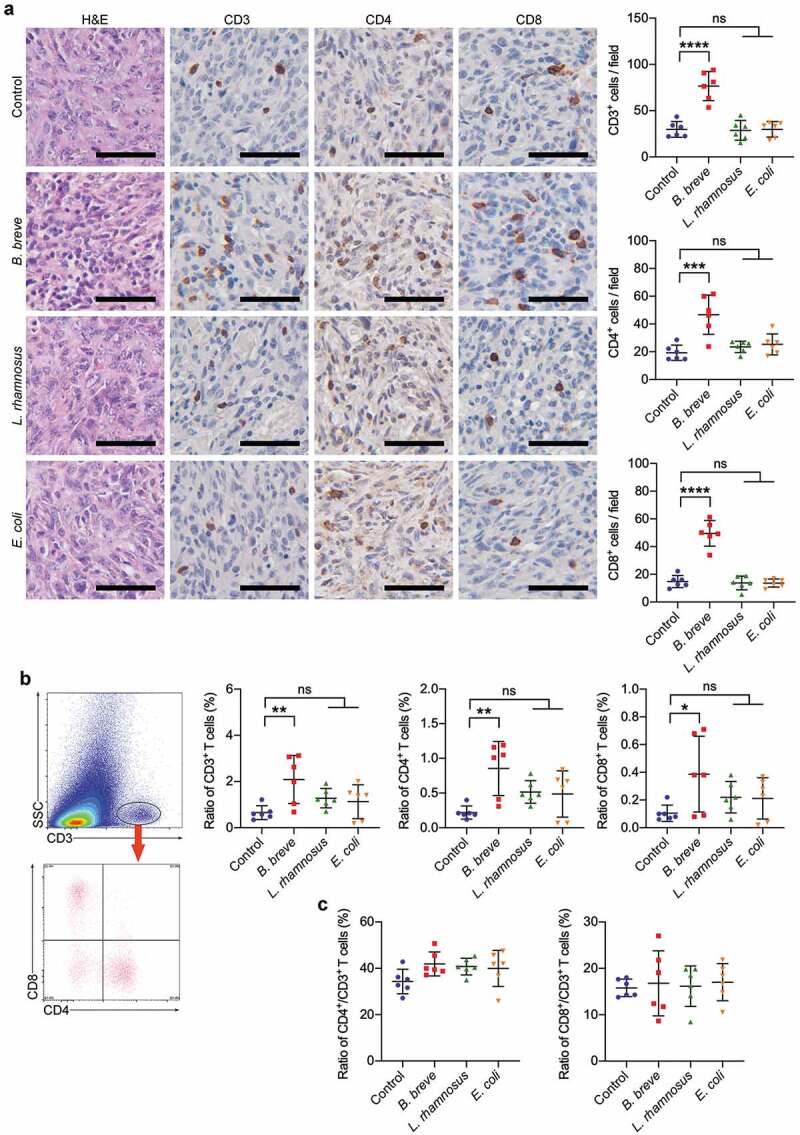
Figure 2.

Tumor suppression effect depended on antitumor immunity. a. Representative H&E staining images of tumor tissues were shown in the left panel, and the expressions of CD3, CD4, and CD8 in tumor tissues were detected by immunohistochemical staining assay (left; scale bar: 50 μm). The quantitative analysis was performed by ImageJ software and the number of positive cells were presented in scatter plots (right). b. Representative plots showing gating strategy of CD3+, CD4+, and CD8+ T cells within the tumor of C3H/HeN mice, as assessed by flow cytometry (left). The statistical analysis was shown in scatter plots (right). c. The ratio of tumor infiltrating CD4+/CD3+ T cells and CD8+/CD3+ T cells based on the data in b. Each dot represents one mouse in two to three independent experiments of six mice per group. All these data were analyzed with one-way ANOVA and presented as mean ± SD (*P < .05; **P < .01; ***P < .001; ****P < .0001; ns, not significant)
