

ABSTRACT
RNA-binding proteins (RBPs) are significantly dysregulated in glioma. In this study, we demonstrated the upregulation of Nuclear cap-binding subunit 3 (NCBP3) in glioma tissues and cells. Further, knockdown of NCBP3 inhibited the malignant progression of glioma. NCBP3 directly bound to small nucleolar RNA host gene 6 (SNHG6) and stabilized SNHG6 expression. In contrast, the gastrulation brain homeobox 2 (GBX2) transcription factor was downregulated in glioma tissues and cells. SNHG6 inhibited GBX2 transcription by mediating the H3K27me3 modification induced by polycomb repressive complex 2 (PRC2). Moreover, GBX2 decreased the promoter activities and downregulated the expression of the flotillin protein family 1 (FLOT1) oncogene. In conclusion, NCBP3/SNHG6 inhibits GBX2 transcription in a PRC2-dependent manner to facilitate the malignant progression of gliomas.
KEYWORDS: RNA-binding proteins, long non-coding RNA, H3K27me3, glioma
Introduction
Malignant gliomas are the most common and deadly intracranial tumours in adults [1]. The main treatment is still a combination of surgical resection, chemotherapy, and radiation therapy. Despite the rapid development of related fields, such as surgical aids and molecular pathology of gliomas in recent years, treatment results remain poor, recurrence rates are high, and survival times are short due to the glioma characteristics of aggressive growth and strong invasiveness [2,3]. Hence, current research on the genetic and molecular aspects of gliomas continues to explore the relevant influential mechanisms of malignant biological behaviours, such as proliferation, migration, invasion, and apoptosis, in order to identify potential genes and molecular therapeutic targets to inhibit tumour development [4–7].
A variety of RNA-binding proteins (RBPs) and many related proteins are involved in the fate of RNA from transcription and processing in the nucleus to translation and decay in the cytoplasm [8]. The cap structure, which is co-transcriptionally attached to the 5′-end of the RNA, is vital for gene expression in organisms ranging from yeasts to humans. When associated with polymer II transcripts, the cap structure plays a critical role as a signal in the binding of polymer II transcripts to downstream proteins [9]. The nuclear cap-binding complex (CBC) can bind tightly to the 5ʹ-cap structure and plays an important role in transcription, splicing, transcript export, and translation [10,11]. The CBC is highly conserved and consists of a heterodimer formed by nuclear cap-binding proteins NCBP1, NCBP2, and NCBP3. The latter protein (also known as C17orf85) is the recently identified cap-binding protein [12,13]. NCBP3 is crucial in conditions of cellular adversity compared with the conventional CBC formed by NCBP1 and NCBP2 [14]. Using data from The Cancer Genome Atlas (TCGA), we discovered that the high expression of NCBP3 leads to a shorter survival time compared to low/medium expression (Supplementary Fig. S1A).
In recent years, research has increasingly focused on non-coding regions that have long been neglected, especially long non-coding RNAs (lncRNAs). Although lncRNAs lack an open reading frame, they cannot all be dismissed as transcriptional ‘noise’ [15]. Indeed, lncRNAs play important regulatory roles in the development of tumours [16]. For example, HOTAIR is the first lncRNA that is closely related to breast cancer metastasis and poor patient prognosis [17]. Another study demonstrated that lncRNA-MALAT1 promotes the progression of hepatocellular carcinoma by upregulating serine and arginine-rich splicing factor 1 (SRSF1) and activating mammalian target of rapamycin (mTOR) [18]. Accumulating evidence indicates a vital role of lncRNAs in transcriptional regulation and epigenetic regulation [19]. The transcription of homeobox a10 (HOXA10) is promoted by lncHOXA10 via the recruitment of the SNF2 L chromatin remodelling complex, which promotes the self-renewal of liver tumour initiating cells [20]. Furthermore, lncRNA-PVT1 can bind with enhancer of zeste homolog 2 (EZH2) to form H3K27me3 and epigenetically silence ANGPTL4 in the nucleus, thus promoting the metastasis of cholangiocarcinoma [21].
Using lncRNA microarray, we found that SNHG6 was significantly downregulated in U87 and U251 cells treated with sh-NCBP3. Small nucleolar RNA host gene 6 (SNHG6) is located on human chromosome 8q13.1. Y. Emerging evidence suggests that small nucleolar RNAs (snoRNAs) and their host genes (SNHGs) play significant roles in the development of human cancers [22–24]. Reduction of SNHG6 can inhibit cell proliferation and epithelial–mesenchymal transition in gastric cancer [25]. In addition, SNHG6 is highly expressed in gliomas, and knockdown of SNHG6 can significantly inhibit cell proliferation and promote apoptosis [26,27]. Moreover, it was predicted that SNHG6 had the binding sequence with NCBP3 by the bioinformatics database starBase v2.0. However, the regulatory role and potential mechanisms of NCBP3 and SNHG6, as a polymer II transcript, are unclear.
The polycomb group (PcG) of proteins are important regulators of normal embryonic development and cell fate decisions [28]. Recent studies have shown that a variety of lncRNAs recruit polycomb repressive complex 2 (PRC2) to regulate transcription [29]. LncRNA-MEG3 reportedly regulates the transcription of transforming growth factor-beta (TGF-β) pathway genes by histone modification induced by binding to PRC2 and formation of an RNA-DNA triplex in its distal regulatory region in breast cancer [30]. In addition, lncRNA-MRCCAT1 can inhibit NPR3 transcription and promote the metastasis of clear cell renal cell carcinoma by binding to PRC2 [31]. LncRNA-MIR100HG can promote the proliferation of triple-negative breast cancer cells by forming triplex structures at the p27 locus [32]. The core subunits of the PRC2 complex include EZH2, embryonic ectoderm development (EED), and suppressor of zeste12 homologue (SUZ12) [33,34]. As the enzymatic component of PRC2, EZH2 functions as a repressor by catalysing histone H3 at lysine 27 trimethylation (H3K27me3) [35,36]. For instance, mH2A1.2 can recruit EZH2 to induce H3K27me3 and create a repressive barrier to LOX transcription in breast cancer [37]. Additionally, EZH2 can maintain the H3K27me3-mediated repression of the FOXC1 gene, thereby inactivating the FOXC1-driven anti-invasive transcriptional program in luminal B breast cancer [38].
Gastrulation brain homeobox 2 (GBX2) is a transcription factor located on human chromosome 2q37.2. Interestingly, GBX2 is a tumour suppressor in head and neck cancer [39], while being an oncogene in prostate cancer and breast cancer [40,41]. Genes have specific expression characteristics in different tissues. It is reported that PRC2 occupies CpG-rich chromatin regions in mammals [42]. In addition, H3K27me3 initially produced by PRC2 was enriched in CpG islands [43]. The CpG island of GBX2 promoter region was predicted in −1000 ~ 0 bp according to the bioinformatics software MethPrimer 2.0. Moreover, it has been reported that both Testis-specific Y-encoded-like protein 2 (TSPYL2) and EZH2 can bind to the GBX2 promoter, which increases the level of H3K27me3 and significantly reduces GBX2 expression in neurons [44]. So, we speculated GBX2 might be a target of PRC2.
FLOT1 is located on chromosome 6p21.33. It plays a vital role in vesicle trafficking and maintenance of cell morphology [45]. As a lipid raft protein, FLOT1 can initiate receptor kinase signalling and can be upregulated in malignant tumours, including oesophageal squamous cell carcinoma and liver cancer [46]. In addition, silencing of FLOT1 can reportedly inhibit the proliferation and tumorigenesis of breast cancer, lung adenocarcinoma, and renal cell carcinoma [47–49]. Furthermore, putative binding sites for GBX2 were predicted in the promoter of flotillin protein family 1 (FLOT1) using the JASPAR bioinformatics database.
The major purpose of this study was to investigate the expression of NCBP3, SNHG6, GBX2, and FLOT1 in glioma tissues and cell lines. We also explored their effect on regulating the malignant behaviour of glioma cells and the potential molecular mechanism. The results could inform a novel potential approach for glioma therapy.
Results
NCBP3 expression was up-regulated in glioma, knockdown of NCBP3 inhibited malignant behaviours of glioma cells
We found that high expression of NCBP3 (also known as C17orf85) led to a shorter survival time compared to low/medium expression by analysis of TCGA database (P = 0.00055) (Supplementary Fig. S1A). Quantitative real-time polymerase chain reaction (qRT-PCR) and western blot assay were performed to evaluate NCBP3 expression levels in glioma tissues and cells. The mRNA expression level of NCBP3 was highly upregulated in U87 and U251cells among the four glioma cell lines of U87, U251, U373, and A172 (Supplementary Fig. S1B). Therefore, we selected U87 and U251 cells for the subsequent experiments [50,51]. As shown in Fig. 1A-B, compared with normal brain tissues (NBTs), the mRNA and protein expression levels of NCBP3 were markedly upregulated in glioma tissues and elevated with the pathological grade (P < 0.05). Furthermore, NCBP3 expression levels were significantly elevated in U87 and U251 cells compared with normal human astrocyte (NHA) group (P < 0.05) (Fig. 1C-D). Stable NCBP3 knockdown U87 and U251 cells were constructed to assess the function of NCBP3. Infinite proliferation capability is reported to be one of the most basic characteristics of tumours. Therefore, cell proliferation is an important feature of tumour cells [52]. We used the Cell Counting Kit-8 (CCK-8) assay to measure the proliferation of U87 and U251 cells. The results showed that proliferation was decreased in sh-NCBP3 #2 group than that in sh-NC group (Fig. 1E). In addition, transwell is the most common assay to detect cell migration and invasion [53]. As shown in Fig. 1F-G, the numbers of migrated and invaded cells in the sh-NCBP3 #2 group were significantly declined compared with the sh-NC group (P < 0.05). Moreover, apoptosis is closely related to the generation and disappearance of tumours [54]. As shown in Fig. 1H, flow cytometry analysis showed that apoptosis rates were higher in the sh-NCBP3 #2 group compared with sh-NC group (P < 0.05). Moreover, different shRNAs were used to exclude off-target effects in targets knockdown transfection of this study, and it was demonstrated the consistent conclusions (Supplementary Fig. S2-3).
Figure 1.
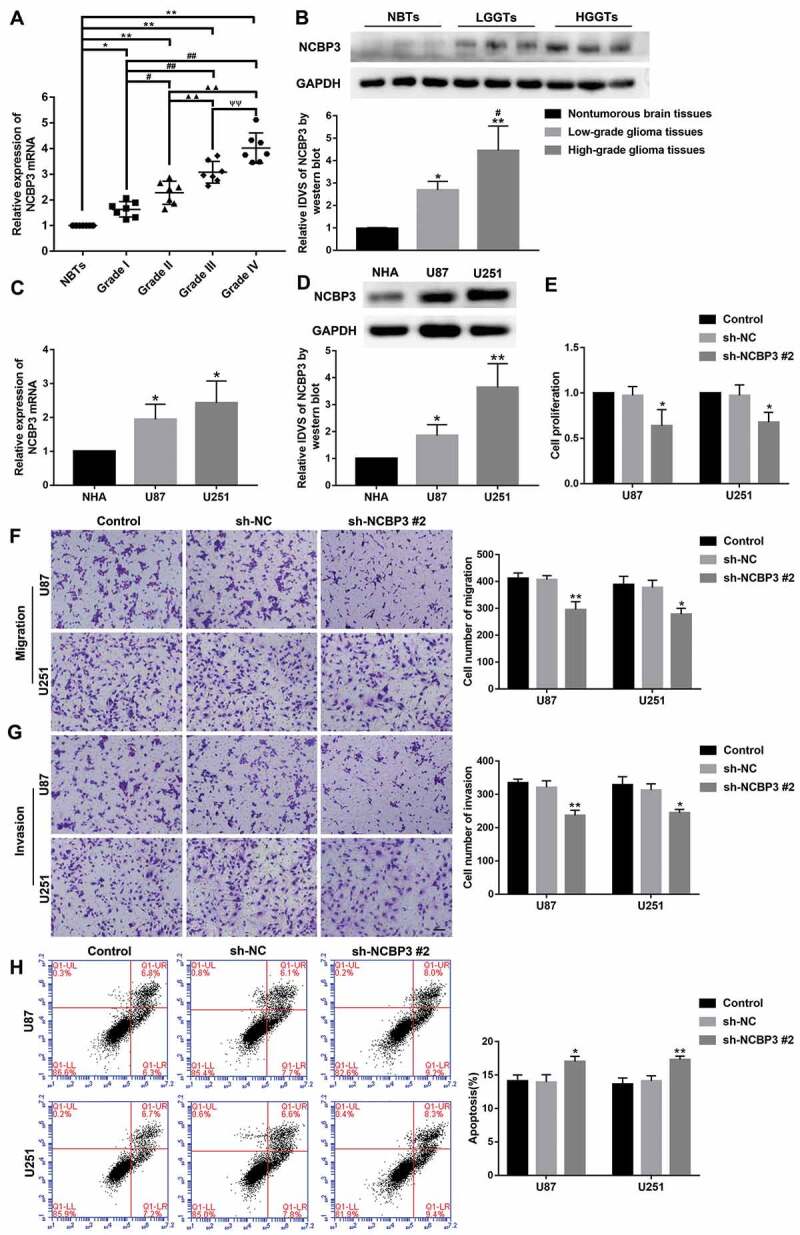
The expression and effects of NCBP3 in glioma. (A) The mRNA expression of NCBP3 in glioma tissues of different grades and NBTs. Data were presented as the mean ± standard deviation (SD) (n = 7 in each group). *P < 0.05, **P < 0.01 versus NBTs group; #P < 0.05, ##P < 0.01 versus Grade I group; ▲P < 0.05, ▲▲P < 0.01 versus Grade II group; ΨP<0.05 versus Grade III group. (B) NCBP3 protein expression levels in NBTs, low-grade glioma tissues (WHO I–II), and high-grade glioma tissues (WHO III–IV). The integrated density values (IDVs) of the blot bands were statistic analysed. Data were presented as the mean ± SD (n = 3 in each group). *P < 0.05, **P < 0.01 versus NBTs group; #P < 0.05 versus low-grade glioma tissues (LGGTs) group by one-way ANOVA. (C) Relative mRNA expression of NCBP3 in NHA, U87 and U251 cells by Real-time qPCR. GAPDH was used as an endogenous control. Data were presented as the mean ± SD (n = 3 in each group). *P < 0.05 versus NHA group. (D) Relative protein expression of NCBP3 protein in NHA, U87 and U251 cells by western blot. Data were presented as the mean ± SD (n = 3 in each group). *P < 0.05, **P < 0.01 versus NHA group. (E) Cell Counting Kit-8 (CCK-8) assay was used to detect the effect of NCBP3 on proliferation of U87 and U251 cells. Data were presented as the mean ± SD (n = 3 in each group). *P < 0.05 versus sh-NC group. (F, G) Transwell assays were used to investigate the effect of NCBP3 on cell migration and invasion of U87 and U251 cells. Data were presented as the mean ± SD (n = 3 in each group). *P < 0.05. **P < 0.01 versus sh-NC group; Scale bars represent 50 μm. (H) The apoptotic percentages of U87 and U251 were measured after NCBP3 knockdown. Data were presented as the mean ± SD (n = 3 in each group). *P < 0.05 versus sh-NC group
SNHG6 was involved in NCBP3-mediated regulation on malignant progression via stabilized by NCBP3
The expression profile from lncRNA microarray of U87 and U251 cells upon NCBP3 knockdown revealed several down-regulated lncRNAs. Further, it was verified by qRT-PCR that SNHG6 was significantly reduced in U87 and U251 cells compared with sh-NC group (Supplementary Fig. S4A-B). Therefore, we predicted that SNHG6 was involved in NCBP3-mediated regulation on glioma cells. We found that the expression of SNHG6 was significantly upregulated in glioma tissues and cells (P<0.05) (Fig. 2A-B). To further assess the potential role of SNHG6 in the biological behaviour of glioma cells, stable SNHG6 knockdown and overexpressed U87 and U251 cells were constructed. The efficiency of sh-SNHG6 #1 and pIRES2-SNHG6 data was detected by qRT-PCR (P<0.01) (Fig. 2C). As the results displayed, the knockdown of SNHG6 hampered cell proliferation, migration, and invasion, however, promoted apoptosis compared with sh-NC group (P <0.05) (Fig. 2D-G). Therefore, SNHG6 might act as an oncogene in glioma cells.
Figure 2.
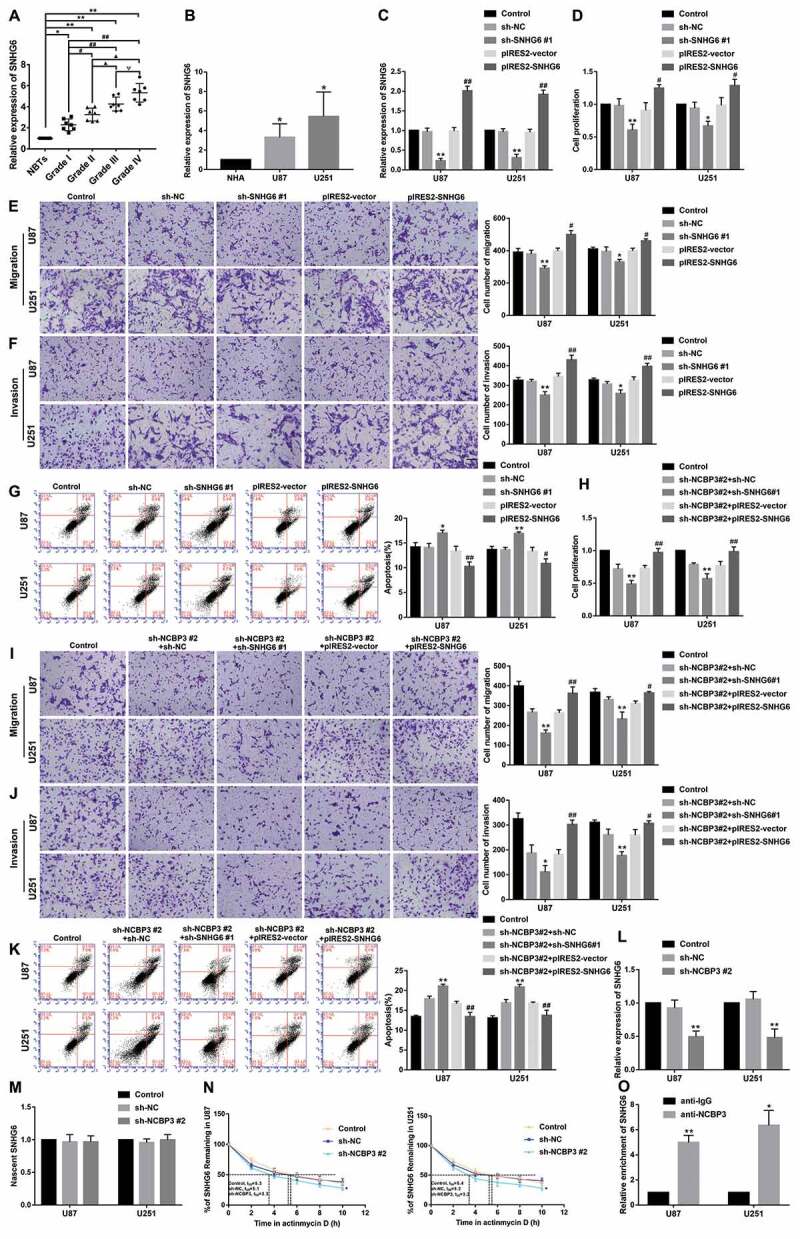
NCBP3 targeted and positively regulated SNHG6. (A) The expression of SNHG6 in glioma tissues of different grades and NBTs. Data were presented as the mean ± SD (n =7 in each group). *P <0.05, **P <0.01 versus NBTs group; #P<0.05, ##P<0.01 versus Grade I group; ▲P <0.05, ▲▲P<0.01 versus Grade II group; ΨP<0.05 versus Grade III group. (B) Relative expression levels of SNHG6 in NHA, U87 and U251 cells. Data were presented as the mean ± SD (n=3 in each group). *P<0.05 versus NHA group. (C) The efficiency of sh-SNHG6 #1 and pIRES2-SNHG6 data was detected by qRT-PCR of U87 and U251 cells. Data were presented as the mean ± SD (n=3 in each group). **P<0.01 versus sh-NC group; ##P <0.01 versus pIRES2-vector group. (D) CCK-8 assay was conducted to measure the effect of SNHG6 on the proliferation of U87 and U251 cells. Data were presented as the mean ± SD (n=3 in each group). *P<0.05, **P <0.01 versus sh-NC group; #P <0.05 versus pIRES2-vector group. (E, F) Transwell assays were conducted to investigate the effect of SNHG6 on cell migration and invasion of U87 and U251 cells. Data were presented as the mean ± SD (n=3 in each group). *P <0.05, **P <0.01 versus sh-NC group; #P<0.05, ##P<0.01 versus pIRES2-vector group; Scale bars represent 50μm. (G) The apoptotic percentages of U87 and U251 were detected after SNHG6 inhibition or overexpression. Data were presented as the mean ± SD (n=3 in each group). *P <0.05, **P<0.01 versus sh-NC group; #P <0.05, ##P<0.01 versus pIRES2-vector group. (H) CCK-8 assay was used to investigate the effect of NCBP3 and SNHG6 on the proliferation of U87 and U251 cells. Data were presented as the mean ± SD (n=3 in each group). **P<0.01 versus sh-NC group; ##P<0.01 versus pIRES2-vector group. (I, J) Transwell assays were used to measure the effect of NCBP3 and SNHG6 on cell migration and invasion of U87 and U251 cells. Data were presented as the mean ± SD (n=3 in each group). *P <0.05, **P<0.01 versus sh-NCBP3#2+sh-NC group; #P<0.05, ##P <0.01 versus sh-NCBP3#2+pIRES2-vector group. (K) Flow cytometry analysis of U87 and U251 cells to detect the effect of NCBP3 and SNHG6 on the apoptosis. Data were presented as the mean ± SD (n=3 in each group). **P <0.01 versus sh-NCBP3#2+sh-NC group; ##P <0.01 versus sh-NCBP3#2+pIRES2-vector group. (L) Relative expression of SNHG6 after NCBP3 inhibition in U87 and U251 cells. Data were presented as the mean ± SD (n=3 in each group). **P<0.01 versus sh-NC group. (M) Click-iT Nascent RNA capture assay was used to mark and get newly synthesized RNA. Real-time qPCR analysis for nascent SNHG6 in U87 and U251 cells. (N) Real-time qPCR was conducted to investigate relative levels of SNHG6 at different actinomycin D treatment times. Data were presented as the mean ± SD (n=3 in each group). *P<0.05 versus sh-NC group. (O) SNHG6 was separated in the NCBP3 complex. Data were presents as the mean ± SD (n=3 in each group). *P<0.05, **P<0.01 versus anti-IgG group
To clarify the relationship between NCBP3 and SNHG6, the stable NCBP3 knockdown cells were transfected with sh-SNHG6, pIRES2-SNHG6, or their corresponding negative control plasmids. As shown in Fig. 2H-J, the knockdown of SNHG6 enhanced the inhibitory effect of NCBP3 knockdown on the proliferation, migration, and invasion, but the overexpression of SNHG6 reversed the inhibitory effects. Also, it was observed that SNHG6 knockdown enhanced the promotion on apoptosis induced by NCBP3 knockdown alone, but SNHG6 overexpression reversed the promotion (Fig. 2K). Hence, SNHG6 mediated the tumour-suppressive effects of NCBP3 knockdown on glioma cells. Further, we found that SNHG6 expression was significantly decreased in the sh-NCBP3 #2 group compared with the sh-NC group (P<0.01) (Fig. 2L). To expound the mechanism that NCBP3 affected SNHG6 expression, Click-iT Nascent RNA capture assay was used to mark and get newly synthesized RNA. It showed that nascent SNHG6 had no significant change after NCBP3 knockdown (Fig. 2M). Moreover, as shown in Fig. 2N, the half-life of SNHG6 was significantly decreased in sh-NCBP3 #2 group treated with actinomycin D. To further clarify the relationship between NCBP3 and SNHG6, we predicted that SNHG6 had the binding sequence with NCBP3 by starBase v2.0 (Supplementary Fig. S4C). RNA immunoprecipitation (RIP) results demonstrated that enrichment of SNHG6 in the anti-NCBP3 group was significantly higher than that in negative control anti-normal IgG group (P < 0.05) (Fig. 2O). The results described above indicated that NCBP3 facilitated glioma cells malignant biological behaviour by stabilizing SNHG6.
GBX2 acted as a tumour suppressor in glioma cells
The GBX2 expression levels in glioma tissues and cells were detected by qRT-PCR and western blot. GBX2 expression was reduced with the pathological grades of glioma tissues and down-regulated in U87 and U251 compared with NHA (P < 0.05) (Fig. 3A-D). Moreover, stable GBX2 knockdown and overexpressed U87 and U251 cells were constructed. Further, as shown in Fig. 3E-H, knockdown of GBX2 promoted cell proliferation, migration, and invasion and inhibited cell apoptosis compared with sh-NC group, while overexpression of GBX2 resulted in a significant decrease in cell proliferation, migration and invasion, and increase in apoptosis (P < 0.05).
Figure 3.
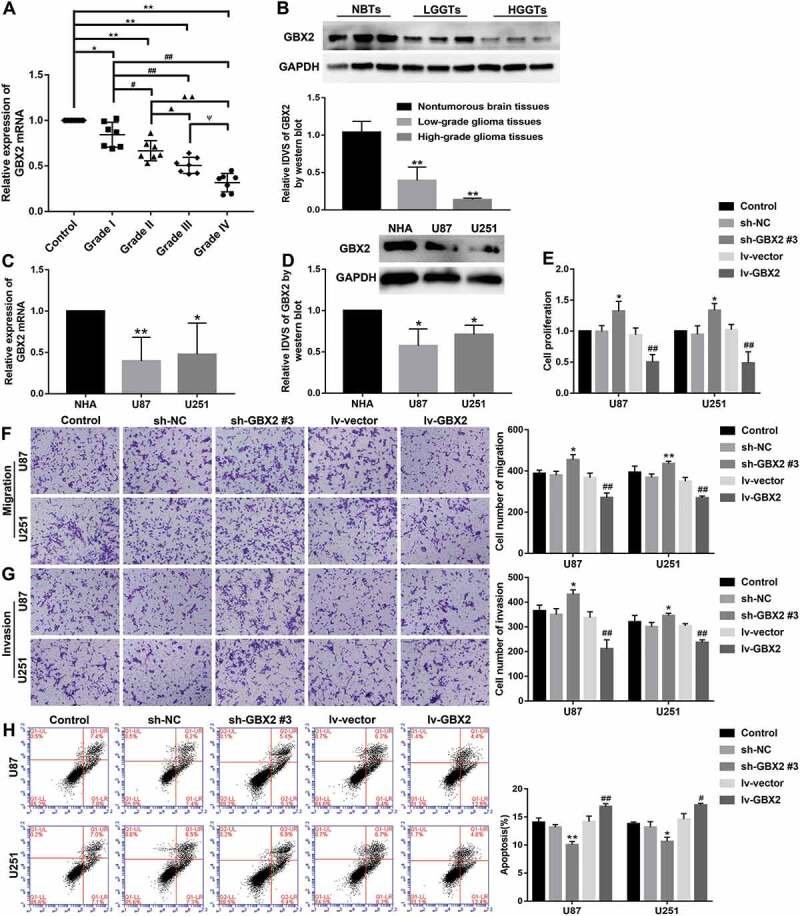
GBX2 acted as a tumour suppressor in glioma cells. (A) Expression of GBX2 in glioma tissues and NBTs. Data were presented as the mean ± SD (n = 7 in each group). *P < 0.05, **P < 0.01 versus NBTs group; #P < 0.05, ##P < 0.01 versus Grade I group; ▲P < 0.05, ▲▲P < 0.01 versus Grade II group; ΨP<0.05 versus Grade III group. (B) GBX2 protein expression in NBTs and glioma tissues. Data were presented as the mean ± SD (n = 3 in each group). **P < 0.01, **P < 0.01 versus NBTs group. (C) Relative expression of GBX2 mRNA in NHA, U87, and U251 cells. Data were presented as the mean ± SD (n = 3 in each group). *P < 0.05, **P < 0.01 versus NHA group. (D) The expression level of GBX2 protein in NHA, U87, and U251 cells. Data were presented as the mean ± SD (n = 3 in each group). *P < 0.05 versus NHA group. (E) CCK-8 assay was conducted to explore the effect of GBX2 on the proliferation of U87 and U251 cells. Data were presented as the mean ± SD (n = 3 in each group). *P < 0.05 versus sh-NC group; ##P < 0.01 versus lv-vector group. (F, G) Transwell assay was used to evaluate the effect of GBX2 on cell migration and invasion of U87 and U251 cells. Data were presented as the mean ± SD (n = 3 in each group). *P < 0.05, **P < 0.01 versus sh-NC group; ##P < 0.01 versus lv-vector group; Scale bars represent 50 μm. (H) Flow cytometry analysis of U87 and U251 cells to detect the effect of GBX2 on the apoptosis. Data were presented as the mean ± SD (n = 3 in each group). *P < 0.05, **P < 0.01 versus sh-NC group; #P < 0.05, ##P < 0.01 versus lv-vector group
SNHG6 mediated the H3K27me3 modification induced by PRC2 in the GBX2 promoter region to inhibit its transcription
To confirm whether GBX2 was involved in regulating the influence of SNHG6 on malignant progression, the stable SNHG6 knockdown and overexpressed cells were transfected with sh-GBX2, lv-GBX2 plasmids. As shown in Fig. 4A-D, compared with the control group, the proliferation, migration, and invasion of glioma cells were declined in the sh-SNHG6#1+lv-GBX2 group but were increased in the pIRES2-SNHG6+sh-GBX2#3 group. The apoptosis was enhanced in the sh-SNHG6#1+lv-GBX2 group, but decreased in the pIRES2-SNHG6+sh-GBX2#3 group (P<0.01). Moreover, knockdown of SNHG6 and GBX2 rescued the reduction of proliferation, migration, invasion, and the increase of apoptosis induced by cotransfection of SNHG6 knockdown with GBX2 overexpression, while overexpression of SNHG6 and GBX2 rescued the increase of proliferation, migration, invasion, and the decrease of apoptosis induced by cotransfection of SNHG6 overexpression with GBX2 knockdown. Therefore, GBX2 might be a direct or indirect target gene of SNHG6.
Figure 4.
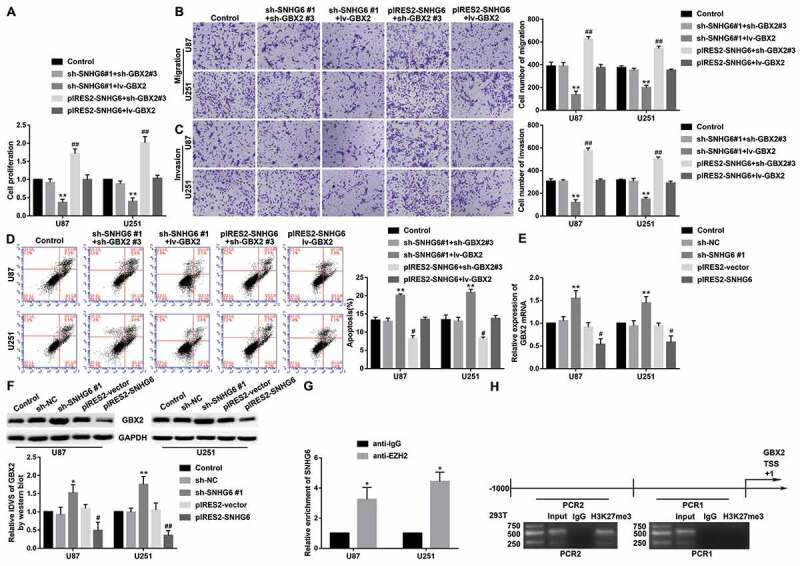
SNHG6 bound to EZH2 of PRC2, inhibiting the expression of GBX2 by enriching H3K27me3 modification. (A) CCK-8 assay was conducted to measure the effect of SNHG6 on the proliferation of U87 and U251 cells. Data were presented as the mean ± SD (n=3 in each group). **P<0.01 versus sh-SNHG6#1+sh-GBX2#3 group; ##P <0.01 versus pIRES2-SNHG6+lv-GBX2 group. (B, C) Transwell assay was used to explore the effect of SNHG6 and GBX2 on cell migration and invasion of U87 and U251 cells. Data were presented as the mean ± SD (n=3 in each group). **P<0.01 versus sh-SNHG6#1+sh-GBX2#3 group; ##P<0.01 versus pIRES2-SNHG6+lv-GBX2 group; Scale bars represent 50μm. (D) The apoptotic percentages of U87 and U251 were detected after inhibition and overexpression of SNHG6 and GBX2. Data were presented as the mean ± SD (n=3 in each group). **P<0.01 versus sh-SNHG6#1+ sh-GBX2#3 group; ##P <0.01 versus pIRES2-SNHG6+lv-GBX2 group. (E) GBX2 mRNA expression levels after inhibition and overexpression of SNHG6. Data were presented as the mean ± SD (n=3 in each group). **P < 0.01 versus sh-NC group; #P <0.05 versus pIRES2-vector group. (F) GBX2 protein expression levels after inhibition and overexpression of SNHG6. Data were presented as the mean ± SD (n=4 in each group). *P<0.05, **P<0.01 versus sh-NC group; #P <0.05, ##P <0.01 versus pIRES2-vector group. (G) SNHG6 was identified in the EZH2 complex. qRT-PCR was used to measure SNHG6 relative enrichment. Data were presented as the mean ± SD (n=3 in each group). *P < 0.05 versus anti-IgG group. (H) H3K27me3 existed in the promotor of GBX2 in HEK-293 T cells. Using normal rabbit IgG as negative control
Furthermore, mRNA and protein expression levels of GBX2 were decreased in the sh-SNHG6 #1 group compared with the sh-NC group (P < 0.05), while increased in lv-GBX2 group (Fig. 3E-F). It was suggested that SNHG6 was involved in the regulation of GBX2 expression. Emerging evidence suggests that many lncRNAs can recruit PRC2 to regulate transcription. The results of RIP assay showed that the enrichment of SNHG6 was significantly increased in the anti-EZH2 group compared with the negative control anti-normal IgG group (Fig. 3G). It was confirmed that SNHG6 bound to the important subunit EZH2 of PRC2. Moreover, to clarify whether PRC2 mediated SNHG6 regulation of GBX2 transcription, we performed chromatin immunoprecipitation (ChIP) assay. 1000 bp upstream of GBX2 transcription start site (TSS) was averagely divided into two fragments. As shown in Fig. 3H, H3K27me3 was enriched in the 500 ~ 1000 bp upstream of GBX2 TSS. Further, chromatin isolation by RNA purification (ChIRP) assay was performed. SNHG6 obtained 14%-77% retrieval, using tiling probes from the RNA fraction recovered. The promoter region −1000~-500bp of GBX2 obtained 16%-83% retrieval, while the promoter region −500 ~ 0 bp of GBX2 obtained ~3% retrieval from the DNA fraction recovered (Supplementary Fig. S4D-E). ChIRP assay revealed the presence of SNHG6 at the promoter region −1000~-500bp of GBX2. The results described above supported that SNHG6 mediated the H3K27me3 modification induced by PRC2 in the GBX2 promoter region to suppress the malignant progression of glioma cells.
Knockdown of FLOT1 inhibited malignant progression of glioma cells
FLOT1 might be a direct downstream target of GBX2 based on bioinformatics databases (JASPAR). The mRNA and protein expression levels of FLOT1 were determined by qRT-PCR and western blot assay in glioma tissues and cells. As shown in Fig. 5A-D, the expression of FLOT1 was elevated with the pathological grades of glioma tissue, and was also significantly up-regulated in U87 and U251 (P < 0.05). In addition, stable FLOT1 knockdown U87 and U251 cells were constructed. Further, the CCK-8 assay revealed that proliferation of U87 and U251 was decreased in the sh-FLOT1 #1 group (Fig. 5E). Besides, transwell assay confirmed that knockdown of FLOT1 significantly declined migration and invasion in both U87 and U251 cells (Fig. 5F-G), while knockdown of FLOT1 promoted apoptosis (Fig. 5H) (P < 0.05).
Figure 5.
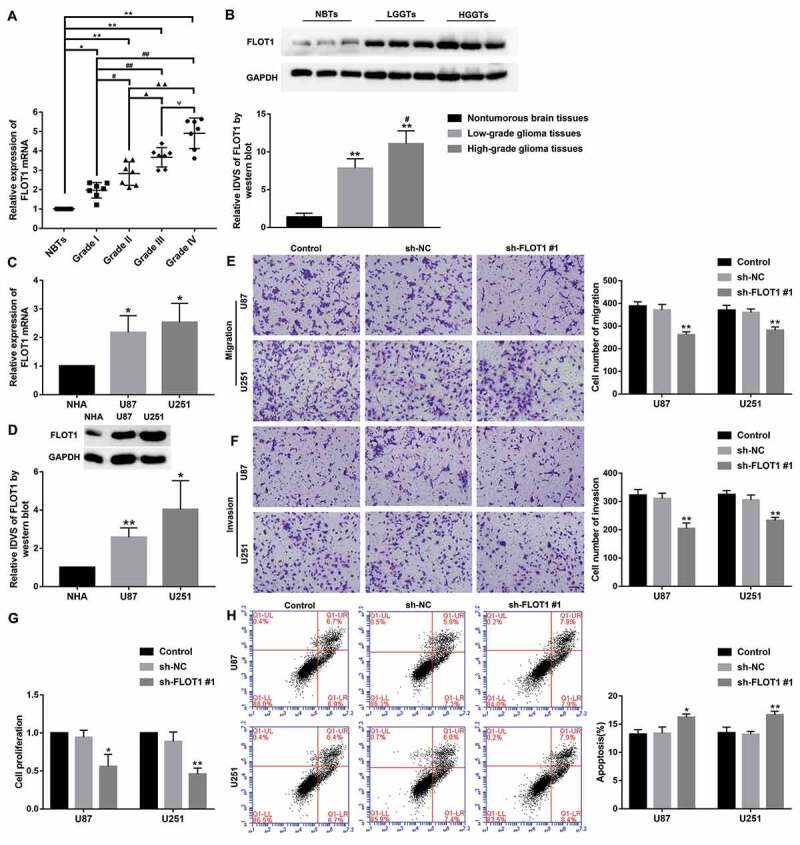
FLOT1 was upregulated in glioma tissues and glioma cell lines. (A) Expression of FLOT1 mRNA in glioma tissues and NBTs. Data were presented as the mean ± SD (n = 7 in each group). *P < 0.05, **P < 0.01 versus NBTs group; #P < 0.05, ##P < 0.01 versus Grade I group; ▲P < 0.05, ▲▲P < 0.01 versus Grade II group; ΨP<0.05 versus Grade III group. (B) FLOT1 protein expression in NBTs and glioma tissues. Data were presented as the mean ± SD (n = 3 in each group). **P < 0.01, **P < 0.01 versus NBTs group; #P < 0.05 versus LGGTs group. (C) Relative expression of FLOT1 mRNA in NHA, U87, and U251 cells. Data were presented as the mean ± SD (n = 3 in each group). *P < 0.05 versus NHA group. (D) The expression level of FLOT1 protein in NHA, U87, and U251 cells. Data were presented as the mean ± SD (n = 3 in each group). *P < 0.05, **P < 0.01 versus NHA group. (E, F) Transwell assay was conducted to measure the effect of GBX2 on cell migration and invasion of U87 and U251 cells. Data were presented as the mean ± SD (n = 3 in each group). *P < 0.05 versus sh-NC group; Scale bars represent 50 μm. (G) CCK-8 assay was conducted to explore the effect of FLOT1 on the proliferation of U87 and U251 cells. Data were presented as the mean ± SD (n = 3 in each group). *P < 0.05, **P < 0.01 versus sh-NC group. (H) Flow cytometry analysis of U87 and U251 cells to detect the effect of FLOT1 on the apoptosis. Data were presented as the mean ± SD (n = 3 in each group). *P < 0.05, **P < 0.01versus sh-NC group
GBX2 transcriptionally inhibited the expression of FLOT1, NCBP3 and SNHG6 by directly binding to their promoter regions
We found that the mRNA and protein expression levels of FLOT1 were elevated after GBX2 knockdown, but a significantly reduced by GBX2 overexpression (P <0.05) (Fig. 6A-B). Putative binding sites for GBX2 were predicted in the promoter region −1000~0 bp of FLOT1 by JASPAR. The ChIP assay was performed to validate the interaction between GBX2 and FLOT1 promoter region. We confirmed that GBX2 directly bound to FLOT1 promoter region in HEK-293 T cells (Fig. 6C). Further, luciferase reporter assay results showed that deletion of the −54 site did not have a significant change in FLOT1 promoter activity, compared to the full-length promoter-reporter construct. However, the −373 site deletion produced reversed promoter activity, compared to a −54 site deletion (Fig. 6D). It indicated that GBX2 might exhibit transcriptional repression of FLOT1 by binding to −373 site. Thus, FLOT1 was a downstream target of GBX2.
Figure 6.
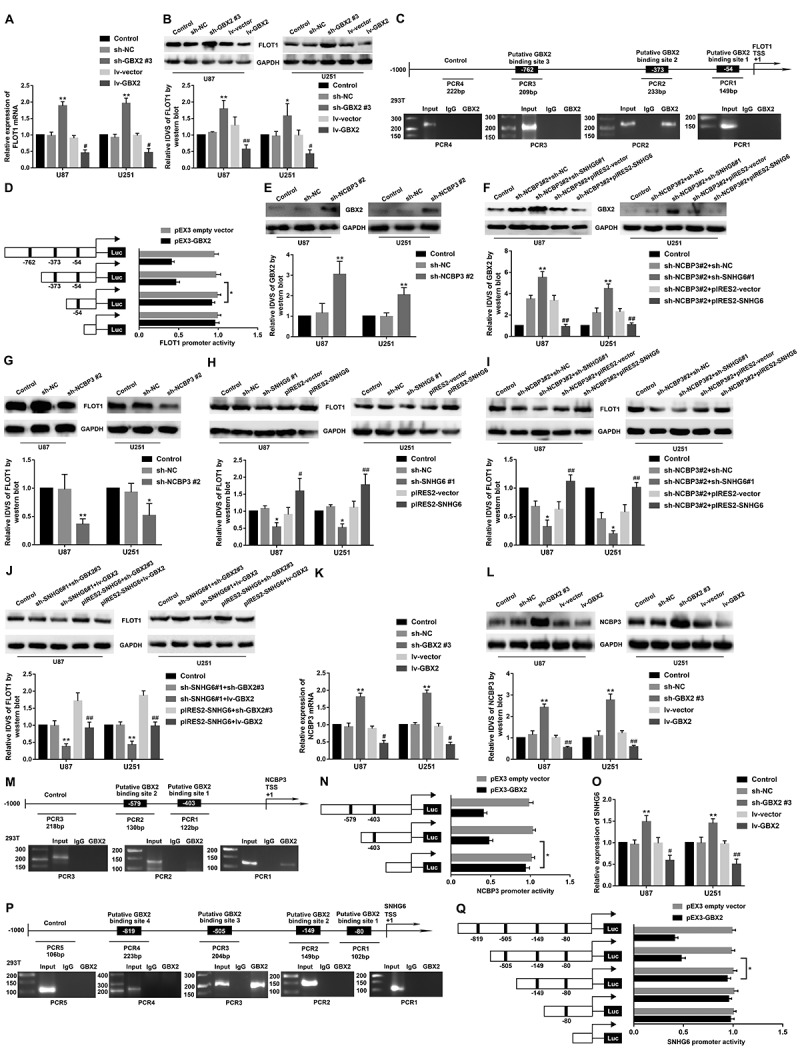
NCBP3/SNHG6 regulated FLOT1 by GBX2. (A, B) FLOT1 mRNA and protein expression levels after inhibition and overexpression of GBX2. Data were presented as the mean ± SD (n=3 in each group). *P <0.05, **P <0.01 versus sh-NC group; #P<0.05, ##P <0.01 versus lv-vector group. (C, M, P) GBX2 bound to the promotor of FLOT1 (C), NCBP3 (M), SNHG6 (P) in HEK-293T cells. Using normal rabbit IgG as negative control. Immunoprecipitated DNA was amplified by specific primer to explore the GBX2 binding site. (D, N, Q) Schematic depiction of the different reporter plasmids and relative luciferase activity of FLOT1 (D), NCBP3 (N) and SNHG6 (Q). The Y-bar is the deletion position on the promoter fragments. The X bar is the reporter vector activity after normalization with the cotransfected reference vector (pRL-TK), and relative to the activity of the pEX3 empty vector, and the activity was set to 1. Data were presented as the mean ± SD (n=5, each). *P<0.05. (E) GBX2 protein expression after inhibition of NCBP3. Data were presented as the mean ± SD (n=3 in each group). **P <0.01 versus sh-NC group. (F) Western blot assay was conducted to explore GBX2 expression regulated by NCBP3 and SNHG6. **P<0.01 versus sh-NCBP3#2+sh-NC group; ##P<0.01 versus sh-NCBP3#2+pIRES2-vector group. (G) FLOT1 protein expression after NCBP3 knockdown. *P<0.05, **P<0.01 versus sh-NC group. (H) FLOT1 protein expression after SNHG6 knockdown and overexpression. Data were presented as the mean ± SD (n=3 in each group). *P<0.05 versus sh-NC group; #P<0.05, ##P <0.01 versus pIRES2-vector group. (I) Using Western blot assay to detect FLOT1 expression regulated by NCBP3 and SNHG6. *P<0.05 versus sh-NCBP3#2+sh-NC group; ##P<0.01 versus sh-NCBP3#2+pIRES2-vector group. (J) Western blot assay was performed to detect FLOT1 expression regulated by SNHG6 and GBX2. **P<0.01 versus sh-SNHG6#1+sh-GBX2#3 group; ##P<0.01 versus pIRES2-SNHG6+sh-GBX2#3 group. (K, L) The mRNA and protein expression levels of NCBP3 after inhibition and overexpression of GBX2. Data were presented as the mean ± SD (n=3 in each group). **P<0.01 versus sh-NC group; ##P<0.01 versus lv-vector group. (O) qRT-PCR assay was used to evaluate SNHG6 expression regulated by GBX2. Data were presented as the mean ± SD (n=3 in each group). **P<0.01 versus sh-NC group; #P <0.05, ##P<0.01 versus lv-vector group
Western blot results showed that GBX2 protein levels were significantly increased following NCBP3 knockdown (Fig. 6E). We have known that the protein expression levels of GBX2 were markedly increased after SNHG6 knockdown, but decreased with SNHG6 overexpression (Fig. 4F). As shown in Fig. 6F, the stable co-transfected sh-NCBP3 #2 and sh-SNHG6 #1 cells had a more significantly promoted effect on GBX2 protein expression. However, the overexpression of SNHG6 rescued the increase of GBX2 protein expression induced by NCBP3 knockdown alone. Collectively, the findings indicated that NCBP3 knockdown increased the protein expression of GBX2 by downregulating SNHG6.
Interestingly, as shown in Fig. 6G, the expression of FLOT1 was significantly decreased in sh-NCBP3 #2 group compared with the sh-NC group (P < 0.05). Moreover, the FLOT1 expression was decreased in sh-SNHG6 #1 group, while increased in pIRES2-SNHG6 group (P < 0.05) (Fig. 6H). NCBP3 knockdown combined with SNHG6 overexpression rescued the inhibition of FLOT1 expression mediated by NCBP3 knockdown (Fig. 6I). Knockdown of SNHG6 and GBX2 rescued the reduction of FLOT1 expression caused by SNHG6 knockdown combined with GBX2 overexpression, while SNHG6 and GBX2 overexpression rescued the increase of FLOT1 expression induced by SNHG6 overexpression combined with GBX2 knockdown (Fig. 6J). We concluded that NCBP3 might regulate FLOT1 expression through GBX2.
We found that GBX2 overexpression decreased the expression of NCBP3 and SNHG6 (P < 0.05) (Fig. 6K, L, O). Several putative binding sites were predicted for GBX2 in the promoter region of NCBP3 and SNHG6 according to JASPAR. Further, ChIP assay demonstrated that GBX2 directly bound to NCBP3 and SNHG6 (Fig. 6M, P). As shown in Fig. 6N, deletion of the −403 site had a significant decrease in NCBP3 promoter activity compared to the full-length promoter-reporter construct. Similarly, deletion of the −505 site regions significantly reversed the promoter activity compared the −149 site (Fig. 6Q). These results indicated that GBX2 exhibited transcriptional repression of NCBP3 and SNHG6 by binding to their promoter regions.
In vivo, knockdown of NCBP3 and SNHG6 combined with overexpression of GBX2 led to the most suppressive tumour effect and the longest survival time
To further confirm the above findings, an in vivo tumour model was used. The results suggested that the sh-NCBP3 #2 group, sh-SNHG6 #1 group, lv-GBX2 group, and sh-NCBP3#2+ sh-SNHG6#1+ lv-GBX2 group had smaller tumours compared with the control group. In addition, tumours in the sh-NCBP3#2+ sh-SNHG6#1+ lv-GBX2 group had the smallest volume compared to the other groups (P < 0.05) (Fig. 7A-B). For survival analysis, the above glioma cells were implanted into the right striatum of mice stereotactically, the results showed that mice in the sh-NCBP3#2+ sh-SNHG6#1+ lv-GBX2 group had the longest survival time (Fig. 7C).
Figure 7.
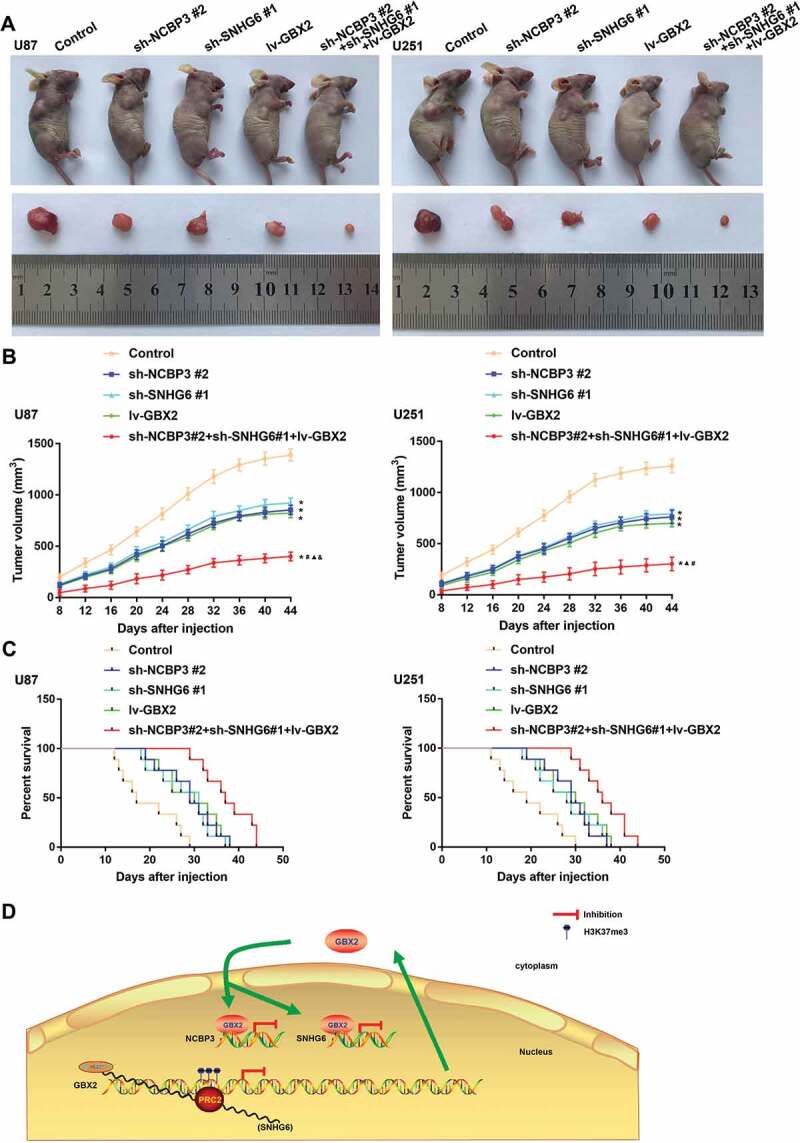
Tumour xenograft study in vivo. (A) The stable expressing cells were injected subcutaneously into nude mice for the tumour xenograft study. The nude mice carrying tumours and the sample tumours from respective groups are shown. (B) Tumour volume was calculated every 4 days after injection, and the tumour was excised after 44 days. Data were presented as the mean ± SD (n = 5 in each group). *P < 0.05 versus control group; #P < 0.05 versus sh-NCBP3 #2 group; ▲P < 0.05 versus sh-SNHG6 #1 group; &P < 0.05 versus lv-GBX2 group. (C) The survival curves of nude mice with xenografts injected into the right striatum (n = 9). (D) The schematic cartoon of the mechanism of NCBP3 as an oncogene positively regulation of SNHG6 in glioma cells
Discussion
RBPs can be significantly dysregulated in glioma, and in turn, alter biological behaviour [55,56]. We found that NCBP3 was upregulated in glioma tissues and cell lines, and the expression of NCBP3 was increased with pathological grade. Knockdown of NCBP3 inhibited the proliferation, migration, and invasion of glioma cells and promoted apoptosis. The findings indicate that NCBP3 might act as an oncogene in malignant glioma.
Recently, the involvement of lncRNAs in regulating the malignant progression of various tumours was proven [57]. The present study demonstrated that SNHG6 was upregulated in glioma tissues and cells. Knockdown of SNHG6 inhibited the proliferation, migration, and invasion of glioma cells and promoted apoptosis. Similar studies have reported the increased expression of SNHG6 in glioma tissues and cells, and that the downregulation of SNHG6 can inhibit the progression of malignant glioma [26,27]. Moreover, SNHG6 is reportedly upregulated in hepatocellular carcinoma, and knockdown of SNHG6 inhibits the tumour progression [58].
Presently, the expression of SNHG6 was downregulated after knockdown of NCBP3. Furthermore, a potential binding site for NCBP3 in the second exon region of SNHG6 was predicted using the starBase v2.0 bioinformatics database. In addition, a search of the UCSC database predicted a binding site located in the 5ʹ-UTR region of SNHG6. Using RIP experiments, we confirmed the binding of NCBP3 to SNHG6. RBPs may regulate RNA function in post-transcriptional expression by activities that include 5ʹ-cap, RNA splicing, RNA editing, polyadenylation, RNA export, and RNA stabilization [59]. NCBP3 can bind to NCBP1 to form an alternative CBC and plays an important role in RNA export [13,14]. Moreover, CBC can bind to the 5ʹ-cap of lncRNAs to stabilize and transport RNA [60,61]. Presently, knockdown of NCBP3 reduced SNHG6 mRNA levels and shortened SNHG6 half-life without changing the production of nascent SNHG6. These findings indicate that NCBP3 might stabilize SNHG6 by binding to its 5ʹ-end. Upregulated NCBP3 might, in turn, upregulate the expression of SNHG6 by increasing its stability, and promote the proliferation, migration, and invasion of glioma cells and inhibit apoptosis. Similar studies have shown that FXR1 can bind to MIR17HG, which can stabilize MIR17HG expression and regulate the biological behaviour of glioma cells [62].
We found that the expression of GBX2 was downregulated in glioma tissues and cells. Moreover, the overexpression of GBX2 inhibited the progression of glioma cells, suggesting that GBX2 acted as a tumour suppressor gene. O6-methylguanine-DNA-methyltransferase (MGMT) promoter methylation has been implicated as a biomarker in glioblastoma. Analysis of the TCGA database demonstrated GBX2 was downregulated at the mRNA level in mMGMT tumours [63].
Another study confirmed the significant roles of epigenetic changes and genetic alterations in cancer development [64]. LncRNAs have been implicated as important participants in recruiting PRC2 to regulate the expression of target genes [65,66]. Presently, SNHG6 overexpression inhibited the mRNA and protein expression of GBX2. In addition, knockdown of both SNHG6 and GBX2 reversed the inhibition of glioma malignant progression induced by co-transfection of SNHG6 knockdown and GBX2 overexpression. The findings suggest that GBX2 might be a downstream target gene of SNHG6. SNHG6 was reported to inhibit the transcription of p21 and promote the proliferation of colorectal cancer cells by recruiting EZH2 to its promoter region [67]. Moreover, mouse Ezh2 could be recruited to the Gbx2 promoter and regulate the H3K27me3 distribution [68]. We used the RIP assay to demonstrate the binding of SNHG6 to the important catalytic EZH2 subunit of the PRC2 complex. ChIP assay results revealed the enrichment of H3K27me3 in the GBX2 promoter. In addition, ChIRP assay findings revealed the presence of SNHG6 at the promoter region of GBX2. These results indicate that SNHG6 can specifically bind to the EZH2 subunit of PRC2 on the GBX2 promotor, which induces H3K27me3 modification. Similarly, lncRNA-HOTAIR can recruit PRC2 to multiple target genes, including JAM2, PCDH10, and PCDHB5, which enriches H3K27me3 and inhibits the transcription of target genes in breast cancer [17].
Presently, FLOT1 was highly expressed in glioma tissues and cells. Knockdown of FLOT1 inhibited the proliferation, migration, and invasion of glioma cells and promoted apoptosis. These findings indicate that FLOT1 acts as an oncogene in glioma cell lines. Similar to the results of this study, FLOT1 expression was upregulated in prostate cancer, and downregulation of FLOT1 significantly decreased the proliferation of prostate cancer cells [69]. Moreover, FLOT1 was reportedly abnormally highly expressed and promoted the malignant progression of oesophageal squamous cell carcinoma [70]. In addition, FLOT1 was highly expressed in small cell lung carcinoma (SCLC) samples and had an oncogenic role via the promotion of epithelial–mesenchymal transition (EMT) in SCLC [71].
We found that overexpression of GBX2 reduced FLOT1 expression levels. Using the JASPAR bioinformatics database, we predicted that the promoter region of FLOT1 had three putative binding sites for GBX2. Results of the ChIP and dual-luciferase reporter assay identified the specific binding of GBX2 to the ‘ATTA’ sequence present in the promoter region of FLOT1. The ATTA core sequence is an essential motif for GBX2 binding to the promoter region of the target gene [72]. These findings indicate that GBX2 can inhibit FLOT1 transcription and expression by binding to the FLOT1 promoter. Similar findings have been reported in embryonic brain formation of mice and lambs, in which Gbx2 can act as a transcriptional repressor and inhibit Otx2 transcription [73].
Interestingly, the overexpression of GBX2 significantly reduced the expression levels of NCBP3 and SNHG6, while knockdown of GBX2 led to a sharp decline of NCBP3 and SNHG6. Moreover, potential binding sites for GBX2 in NCBP3 and SNHG6 promoter region were predicted using the JASPAR bioinformatics database. The ChIP and dual-luciferase reporter assay revealed the binding of GBX2 to the promoter regions of NCBP3 and SNHG6, and the resultant decreased promoter activities. Molecular regulatory networks, including non-coding RNAs, are being increasingly studied. For example, CEBPA can regulate the expression of PIWIL3 by binding to its promoter region and can combine with PIWIL3/OIP5-AS1/miR-367-3p/CEBPA to regulate the biological behaviour of glioma cells [74]. Knockdown of SOX3 reportedly reduces the upstream SOX2OT expression by binding to its promoter region and can combine with SOX2OT/miR-194-5p (miR-122)/SOX3 to regulate the biological behaviour of glioma cells [75].
In conclusion, NCBP3 and SNHG6 were upregulated in glioma tissues and cell lines. Knockdown of NCBP3 and SNHG6 inhibited proliferation, migration, and invasion and promoted apoptosis. Upregulated NCBP3 could positively regulate SNHG6 expression by binding to it and enhancing its stability. Upregulated SNHG6 inhibited the transcription of GBX2 by binding to PRC2 and mediating the H3K27me3 modification in its promoter region. GBX2 decreased the promoter activities and downregulated the expression of oncogenic gene FLOT1. GBX2 also decreased the expression of NCBP3 and SNHG6 by binding to their promoter regions to regulate the malignant progression of glioma cells. In vivo, the knockdown of NCBP3 and SNHG6 combined with GBX2 overexpression led to the smallest tumour and the longest survival time in nude mice. Hence, the combined effect of NCBP3/SNHG6/GBX2 may provide new strategies and new ideas for glioma targeted therapy.
Materials and methods
Patients and glioma specimens
Glioma samples and human brain tissues were collected from the Department of Neurosurgery at Shengjing Hospital of China Medical University. All patients signed an informed consent form before surgery, and approval of the Ethics Committee of Shengjing Hospital of China Medical University was obtained. All the tissue samples were immediately frozen in liquid nitrogen after surgical resection. According to the WHO classification of tumours in the central nervous system (2007), glioma specimens were divided into four groups: Grade I (n = 7), Grade II (n = 7), Grade III (n = 7), and Grade IV (n = 7). NBTs acquired from fresh autopsy materials (donation from individuals who died in accident and determined to be free of any prior pathologically detectable conditions) were used as negative controls.
Cell culture
Human glioma cell lines (U87 and U251) and human embryonic kidney 293 T (HEK-293 T) cells were obtained from the Chinese Academy of Medical Sciences (Beijing, CHN). U87 glioma cells and HEK-293 T cells were cultured in DMEM (HyClone, Los Angeles, USA) supplement with 10% FBS. U251 glioma cells were cultured in DMEM/F12 medium with 10% FBS. NHA was purchased from the ScienCell Research Laboratories (California, USA), and grown in RPMI-1640 culture medium. All cells were incubated at 37°C in a humidified incubator with 5% CO2.
RNA extraction and quantitative real-time PCR (qRT-PCR)
Total RNA was extracted from NBTs, different grades of gliomas, and cells using Trizol reagent (Life Technologies, California, USA). The RNA concentrations were detected by 260/280 nm absorbance using a Nano-drop spectrophotometer (ND-100, Thermo Fisher Scientific, Massachusetts, USA). The primers of NCBP3, SNHG6, GBX2, and FLOT1 are listed in Supplementary Table 1, synthesized by shenggong (Shanghai, CHN). One-Step SYBR PrimeScript RT-PCR kit (Takara, Kyoto, Japan) was used to detect the RNA expression. Glyceraldehyde 3-phosphate dehydrogenase (GAPDH) was used as an endogenous control. PCR cycling conditions were as follows: 5 min at 42°C, 10 seconds at 95°C, 40 cycles of 3 seconds at 95°C, and 30 seconds at 60°C. Fold change in gene expression was calculated by relative quantification as 2−ΔΔCT [76].
Table 1.
Primers used for qRT-PCR
| Gene | Antibody |
|---|---|
| NCBP3 | 1:1000, Proteintech, Wuhan, CHN |
| GBX2 | 1:500, Proteintech, Wuhan, CHN |
| FLOT1 | 1:1000, Proteintech, Wuhan, CHN |
| GAPDH | 1:5000, Proteintech, Wuhan, CHN |
Western blot analysis
Total proteins were isolated from cells with RIPA buffer on ice and were further analysed by SDS-PAGE and electrophoretically transferred to polyvinylidene difluoride (PVDF) membranes. After non-specific binding was prevented by 5% non-fat milk at room temperature for 2 h, membranes were embraced overnight at 4°C by primary antibodies as shown in Supplementary Table 2. Then, the membranes were incubated 2 h at room temperature with HRP-conjugated secondary antibodies. Immunoblots were visualized by ECL chemiluminescence detection system and the relative integrated density values (IDVs) values were calculated by gel-pro analyser software [77].
Table 2.
Antibodies for western blot
| Primer or Probe | Gene | Sequence (5’->3’) |
|---|---|---|
| Primer | NCBP3 | F: TAGGCTAGGTGTTCCCAGGC |
| R: CCCTTTGCAGCTCAGAGTCG | ||
| SNHG6 | F: ACGCGGCATGTATTGAGCAT | |
| R: ATGCTGCATGCCACACTTGA | ||
| GBX2 | F: CGTCTATGAGCGCAGCGTTCC | |
| R: GTCTATGCTGAAGGCGGTGCTAC | ||
| FLOT1 | F: CAGCTGTACCAAGAGGCTGC | |
| R: TGGCTGAAGTCAAGGGACCA | ||
| GAPDH | F: CGGATTTGGTCGTATTGGG | |
| R: CTGGAAGATGGTGATGGGATT |
Microarray analysis of human lncRNA expression profile
For the expression profile of lncRNA, analysis was performed by Kangchen Bio-tech (Shanghai, CHN), using Agilent chip platform. Total RNA was extracted from sh-NC and sh-NCBP3 of U87 and U251 cells and reversed transcribed to cDNA. It was Cy3-labelled after cRNA being transcribed from obtained cDNA in vitro. Each slide was hybridized with Cy3-labelled cRNA in a hybridization oven. Then, the slides were washed in staining dishes, scanned by Agilent microarray scanner. The significantly expressed genes were obtained from samples after data analysed.
Cell transfection and generation of stable transfected cells
The short hairpin RNA against human NCBP3 (sh-NCBP3; sequence: site#1, 5ʹ- GGAGAAGAAATCAGGTAAT-3ʹ; site#2, 5ʹ- ACATCTATTAGATGAGAAA-3ʹ; site#3, 5ʹ- TCGTATAAACATCGACATT-3ʹ) was reconstructed in a Lentiviral-GV298/MCS/puromycin vector by Genechem (Shanghai, CHN), and its empty vector was used as a negative control (sh-NC). The short hairpin RNA against human SNHG6 (sh-SNHG6; sequence: site#1, 5ʹ- GAAGGTGTATGAAAGTCATCA-3ʹ; site#2, 5ʹ- GCGGCATGTATTGAGCATATA-3ʹ; site#3, 5ʹ- GTTACCTCAAGTGTGGCATGC-3ʹ), GBX2 (sh-GBX2; sequence: site#1, 5ʹ- GCTGGAGAGCGATGTGGACTA-3ʹ; site#2, 5ʹ- GCAGCTCACAAGGAGGAAGAC-3ʹ; site#3, 5ʹ- GCACCACGTCTACGGGCAAGA-3ʹ; site#4, 5ʹ- GAAGGCAGGCAATGCCAATTC-3ʹ), FLOT1 (sh-FLOT1; sequence: site#1, 5ʹ- GCATCAGTGTGGTTAGCTACA-3ʹ; site#2, 5ʹ- GGCACAGAGAGATTACGAACT-3ʹ; site#3, 5ʹ- GCCTATGACATCGAGGTCAAC-3ʹ; site#4, 5ʹ- GCAGAGAAGTCCCAACTAATT-3ʹ) were constructed in pGPU6/Neo vector by GenePharma (Shanghai, CHN), and their respective empty vector plasmids were also introduced. Human full-length SNHG6 gene was ligated into a pIRES2/EGFP vector (pIRES2-SNHG6, genscript, Nanjing, CHN), and its empty vector was used as a negative control (pIRES2-NC). Human full-length GBX2 gene was ligated into a Lentiviral-GV147 vector (lv-GBX2, Genechem, Shanghai, CHN), and its empty vector was used as a negative control (lv-NC). U87 and U251 cells were seeded in 24-well plates (Corning, New York, USA) and transfected using Lipo3,000 reagent (Life Technologies, California, USA) following the manufacturer’s protocols when the confluence reached at ~70%. Vectors were used at a concentration of 500 ng/µl according to the manufacturer’s instructions. Geneticin and puromycin (Thermo Fisher Scientific, Massachusetts, USA) were used to construct stable cell lines. The efficiency of transient or stable transfections was evaluated by qRT-PCR or western blot assay (Supplementary Fig. S5).
Cell proliferation assay
Glioma cell proliferation was evaluated by the Cell Counting Kit-8 (CCK-8) assay (Beyotime Institute of Biotechnology, Jiangsu, CHN). 87 and U251 cells were seeded in 96-well plates at a density of 2000 cells per well and detected 48 hours after transfection. A CCK-8 solution was added into each well (20 μl), and three replicate wells were used for each group. All cells were incubated for another 2 hours at 37°C. Then, the absorbance was measured at 450 nm through the spectraMax M5 microplate reader (Molecular Devices, USA) [75].
Table 3.
The primers for confirming the binding sites for GBX2 in the promotor region of FLOT1, NCBP3, and SNHG6
| Gene | Binding site or control |
Sequence (5’->3’) | Product size (bp) | Annealing temperature (°C) |
|---|---|---|---|---|
| FLOT1 | PCR1 | F: GGAAGGAGAGCGTCGTTAATTT R: TGCATTTACAGCAGGGGGAA |
149 | 53 |
| PCR2 | F: TCCTGGAGTCACAGAACCCA R: CAGTCACCGCCCTTCTTGAG |
209 | 59 | |
| PCR3 | F: GTGACTGCATCCTCCAGCAT R: AGATACACTCAAGACTGCAGACA |
233 | 59 | |
| Control | F: ACTCCCTCCGTCCTTCTTCT R: ATGAAGACACACACCGCGTA |
222 | 54 | |
| NCBP3 | PCR1 | F: AGGAAATCGGCGTCCAAGTT R: TGCCTTGCCAGTCTTTGTCT |
122 | 55 |
| PCR2 | F: TCCCTTAAATGGCGTCACCT R: ATGGGCCAGACACTTCCAAG |
130 | 55 | |
| Control | F: CGCCTGTAATCCCAGCACTT R: TGATCTCGGCTCACTGCAAG |
218 | 56 | |
| SNHG6 | PCR1 | F: GCACTTTGAGAAGCCAAGTCG R: TGCAGTCATGGCTCATAGCA |
204 | 57 |
| PCR2 | F: ATTCCAGCACTTTGGGAGGC R: AGTGCAGTGGCTCGATTTCA |
223 | 56 | |
| PCR3 | F: ACAGCTTCCCCTTCACACTG R: GACCTCAACCTGCTTCTTGGA |
102 | 57 | |
| PCR4 | F: AGCAGGTTGAGGTCCATGTC R: AGCCTAGTAAGCCTAGCAAAACA |
149 | 59 | |
| Control | F CAAAAATTAGCCAGGCTTCATGG R TCAGCTCACTGCAACCTCTG |
106 | 53 |
Cell migration and invasion assay
For cell migration, U87 and U251 cells were resuspended in 100 μl serum-free medium at a density of 2 × 10⁵ cells/ml and assayed in 24-well transwell chambers with an 8 μm pore size polycarbonate membrane (Corning, New York, USA). After incubation at 37°C for 24 hours, cells on the upper surface of the membrane were mechanically removed. The cell invasion assay procedure was similar to the migration assay. The upper chamber was precoated with a 500 ng/µl matrigel solution (BD Biosciences, New Jersey, USA). Cells that migrated or invaded on the lower surface of the membrane were fixed with methanol and glacial acetic acid at a ratio of 3:1 and stained with 20% Giemsa. Stained cells were randomly counted in random field of each chamber [78].
Quantization of apoptosis by flow cytometry
Apoptosis was detected by staining with Annexin V-APC/7-AAD (BD Biosciences, New Jersey, USA) according to the manufacturer’s instructions. U87 and U251 cells were washed twice with cold phosphate-buffered saline and resuspended in binding buffer at a concentration of 1 × 10⁶ cells/ml. A total of 5 μl allophycocyanin (APC) and 5 μl 7-aminoactinomycin D (AAD) were added to the cell suspension and incubated for another 15 minutes at room temperature in a darkroom, followed by addition of 400 μl binding buffer. Cell samples were analysed by flow cytometry (FACScan, BD Biosciences, New Jersey, USA) [79].
RNA stability measurement
After transfected with sh-NC or sh-NCBP3, 2 μg/ml actinomycin D was added to block de novo RNA synthesis. Total RNA was collected at indicated times and SNHG6 expression was measured by qRT-PCR. The half-life of SNHG6 was determined as the time required to reach 50% of the RNA levels after adding actinomycin D.
RNA immunoprecipitation (RIP) assay
RIP assay was performed according to the instructions in the Magna RIP RNA-binding Protein Immunoprecipitation Kit (Millipore, Massachusetts, USA). Briefly, HEK-293 T cell lysate was incubated with RIP buffer containing magnetic beads conjugated with human anti-NCBP3 (or anti-EZH2) antibody or negative control normal mouse IgG. Samples were incubated with Proteinase K, and immunoprecipitated RNA was isolated. Furthermore, RNA was purified from RNA–protein complex, bound to the beads, and then was analysed by qRT-PCR [80].
Nascent RNA capture assay
Following the manufacture’s protocols, nascent RNAs were detected by Click-iT Nascent RNA Capture Kit (Thermo Fisher Scientific, Massachusetts, USA). Briefly, cells were incubated in 5-ethynyl uridine (EU). Then, total RNA labelled with EU was isolated using Trizol reagent (Thermo Fisher Scientific, Massachusetts, USA). Subsequently, EU-labelled RNA was biotinylated in a Click-iT reaction buffer and captured using streptavidin magnetic beads. Eventually, using qRT-PCR to detect EU-nascent RNAs [81].
Chromatin immunoprecipitation (ChIP) assay
ChIP assay was conducted by Simple ChIP Enzymatic Chromatin IP kit (Cell Signalling Technology, Boston, USA), following the manufacturer’s instructions. HEK-293 T cells were cross-linked with 1% formaldehyde for 10 min and then dealt with glycine for 5 min at room temperature. Cells were lysed with cold buffer containing PMSF and resuspended with cold PBS. Chromatin was digested by micrococcal nuclease and incubated for 20 min at 37°C with frequent mixture. Lysates were employed as an input reference. Other immunoprecipitation samples were incubated overnight with normal rabbit IgG or anti-GBX2 antibodies (Proteintech, Wuhan, CHN) at 4°C with vibration. Protein G agarose beads were used to collect the chromatin-immune complex, and beads were scoured with low salt buffer and high salt buffer. DNA crosslinks were reversed by 5 mol/l NaCl and proteinase K at 65°C for 2 h to purify. Immunoprecipitated DNA was amplified by PCR using their specific primers. The primers for each PCR set, the sizes of PCR products, and annealing temperatures are listed in Supplementary Table 2–4 [82].
ChIRP assay
ChIRP (n = 3) was performed as described [83], using antisense DNA oligonucleotide probes specific for full-length SNHG6 in HEK-293 T cells (listed in Table S5). A set of probes against LacZ RNA were generated as the mock control. All probes were biotinylated at the 3ʹ-end (Ribo Bio, Guangzhou, CHN). For PCR analysis, cDNA tiling oligonucleotide probes against SNHG6 or the −1000 ~ 0 bp of GBX2 TSS were used (Supplementary Table 5).
Dual-luciferase reporter assay
For the reporter constructs, the NCBP3, SNHG6 and FLOT1 promoter regions (−1000 ~ 0 bp) were amplified from human genomic DNA by PCR. In addition, putative GBX2 binding sites in the PCR conducts were deleted one by one. The PCR products were subcloned into the pGL3 vector (Promega, Wisconsin, USA) upstream of a luciferase gene. Human full-length GBX2 gene was constructed in pEX3 (pGCMV/MCS/Neo) plasmid vector (GenePharma, Shanghai, CHN). HEK-293 T cells were co-transfected with the pGL3 vector with either full-length promoter regions (or deleted promoter regions) and pEX3-GBX2 (or pEX3 empty vector) using Lipofectamine 3000. Dual-Luciferase Reporter System was used to analyse luciferase activity, and the relative luciferase activity was expressed as the ratio of firefly luciferase activity to renilla luciferase activity [84].
Tumour xenografts in nude mice
All animal procedures were performed in accordance with the Care and Use of Laboratory Animals and protocols approved by the Animal Care Committee of Shengjing Hospital. Four weeks old female BALB/C athymic nude mice were obtained from the National Laboratory Animal Centre (Beijing, CHN). Animals were in line with the guidelines of the laboratory animal centre. For the in vivo study, the stably transfected U87 and U251 cells with control, sh-NCBP3, sh-SNHG6, lv-GBX2, sh-NCBP3 + sh-SNHG6+ lv-GBX2 were picked as described above. A suspension of 3 × 10⁵ cells in a 100 μl volume was subcutaneously injected into the right flanks of mice. The tumour volume was evaluated every 4 days and calculated by the formula: volume (mm3) = length × width2/2. The mice were sacrificed and tumours were isolated on the 40th day postinoculation. As for intracranial orthotopic inoculation, 3 × 10⁵ cells were implanted into the right striatum of mice stereotactically. The number of survived nude mice was registered, and survival analysis was determined using Kaplan–Meier survival curve [85].
Statistical analysis
Data were presented as mean ± SD from at least three independent experiments. All statistical analyses were performed by SPSS 18.0 statistical software (IBM, New York, USA) with the Student’s t-test (two tailed) or one-way analysis of variance for multiple groups. Survival analysis was evaluated using the Kaplan–Meier method and assessed using the log-rank test. Differences were considered statistically significant when P < 0.05.
Supplementary Material
Acknowledgments
This work was supported by grants from the National Natural Science Foundation of China (81872503, 81872073, 81802514, 81602725), China Postdoctoral Science Foundation (2019M661172), Liaoning Science and Technology Plan Project (2020- BS-097, 2017225020), Project of Key Laboratory of Neuro-oncology in Liaoning Province (112-2400017005).
Funding Statement
This work was supported by grants from the National Natural Science Foundation of China (81872503, 81872073, 81802514, 81602725), China Postdoctoral Science Foundation (2019M661172), Liaoning Science and Technology Plan Project (2020-BS-097, 2017225020), Project of Key Laboratory of Neuro-oncology in Liaoning Province (112-2400017005).
Disclosure statement
The authors declare that there is no potential conflict of interest exist.
Supplementary material
Supplemental data for this article can be accessed here.
References
- [1].Ostrom QT, Bauchet L, Davis FG, et al. The epidemiology of glioma in adults: a “state of the science” review. Neuro Oncol. 2014;16:896–913. [DOI] [PMC free article] [PubMed] [Google Scholar]
- [2].Van Meir EG, Hadjipanayis CG, Norden AD, et al. Exciting new advances in neuro-oncology: the avenue to a cure for malignant glioma. CA Cancer J Clin. 2010;60:166–193. [DOI] [PMC free article] [PubMed] [Google Scholar]
- [3].Vajkoczy P, Knyazev P, Kunkel A, et al. Dominant-negative inhibition of the Axl receptor tyrosine kinase suppresses brain tumor cell growth and invasion and prolongs survival. Proc Natl Acad Sci U S A. 2006;103:5799–5804. [DOI] [PMC free article] [PubMed] [Google Scholar]
- [4].Wang R, Zhang S, Chen X, et al. EIF4A3-induced circular RNA MMP9 (circMMP9) acts as a sponge of miR-124 and promotes glioblastoma multiforme cell tumorigenesis. Mol Cancer. 2018;17:166. [DOI] [PMC free article] [PubMed] [Google Scholar]
- [5].Fan Y, Xue W, Schachner M, et al. Honokiol eliminates glioma/glioblastoma stem cell-like cells via JAK-STAT3 signaling and inhibits tumor progression by targeting epidermal growth factor receptor. Cancers (Basel). 2018;11:22. [DOI] [PMC free article] [PubMed] [Google Scholar]
- [6].Kathagen-Buhmann A, Maire CL, Weller J, et al. The secreted glycolytic enzyme GPI/AMF stimulates glioblastoma cell migration and invasion in an autocrine fashion but can have anti-proliferative effects. Neuro Oncol. 2018;20:1594–1605. [DOI] [PMC free article] [PubMed] [Google Scholar]
- [7].Bhuvanalakshmi G, Gamit N, Patil M, et al. Stemness, pluripotentiality, and WNT antagonism: sFRP4, a WNT antagonist mediates pluripotency and stemness in glioblastoma. Cancers (Basel). 2018;11:25. [DOI] [PMC free article] [PubMed] [Google Scholar]
- [8].Muller-McNicoll M, Neugebauer KM.. How cells get the message: dynamic assembly and function of mRNA-protein complexes. Nat Rev Genet. 2013;14:275–287. [DOI] [PubMed] [Google Scholar]
- [9].Topisirovic I, Svitkin YV, Sonenberg N, et al. Cap and cap-binding proteins in the control of gene expression. Wiley Interdiscip Rev RNA. 2011;2:277–298. [DOI] [PubMed] [Google Scholar]
- [10].Schulze WM, Cusack S. Structural basis for mutually exclusive co-transcriptional nuclear cap-binding complexes with either NELF-E or ARS2. Nat Commun. 2017;8:1302. [DOI] [PMC free article] [PubMed] [Google Scholar]
- [11].Gonatopoulos-Pournatzis T, Cowling VH. Cap-binding complex (CBC). Biochem J. 2014;457:231–242. [DOI] [PMC free article] [PubMed] [Google Scholar]
- [12].Mazza C, Ohno M, Segref A, et al. Crystal structure of the human nuclear cap binding complex. Mol Cell. 2001;8:383–396. [DOI] [PubMed] [Google Scholar]
- [13].Schulze WM, Stein F, Rettel M, et al. Structural analysis of human ARS2 as a platform for co-transcriptional RNA sorting. Nat Commun. 2018;9:1701. [DOI] [PMC free article] [PubMed] [Google Scholar]
- [14].Gebhardt A, Habjan M, Benda C, et al. mRNA export through an additional cap-binding complex consisting of NCBP1 and NCBP3. Nat Commun. 2015;6:8192. [DOI] [PMC free article] [PubMed] [Google Scholar]
- [15].Ponting CP, Oliver PL, Reik W. Evolution and functions of long noncoding RNAs. Cell. 2009;136:629–641. [DOI] [PubMed] [Google Scholar]
- [16].Gibb EA, Brown CJ, Lam WL. The functional role of long non-coding RNA in human carcinomas. Mol Cancer. 2011;10:38. [DOI] [PMC free article] [PubMed] [Google Scholar]
- [17].Gupta RA, Shah N, Wang KC, et al. Long non-coding RNA HOTAIR reprograms chromatin state to promote cancer metastasis. Nature. 2010;464:1071–1076. [DOI] [PMC free article] [PubMed] [Google Scholar]
- [18].Malakar P, Shilo A, Mogilevsky A, et al. Long noncoding RNA MALAT1 promotes hepatocellular carcinoma development by SRSF1 upregulation and mTOR activation. Cancer Res. 2017;77:1155–1167. [DOI] [PMC free article] [PubMed] [Google Scholar]
- [19].Chen Q, Cai J, Wang Q, et al. Long noncoding RNA NEAT1, regulated by the EGFR pathway, contributes to glioblastoma progression through the WNT/beta-catenin pathway by scaffolding EZH2. Clin Cancer Res. 2018;24:684–695. [DOI] [PubMed] [Google Scholar]
- [20].Shao M, Yang Q, Zhu W, et al. LncHOXA10 drives liver TICs self-renewal and tumorigenesis via HOXA10 transcription activation. Mol Cancer. 2018;17:173. [DOI] [PMC free article] [PubMed] [Google Scholar]
- [21].Yu Y, Zhang M, Liu J, et al. Long non-coding RNA PVT1 promotes cell proliferation and migration by silencing ANGPTL4 expression in cholangiocarcinoma. Mol Ther Nucleic Acids. 2018;13:503–513. [DOI] [PMC free article] [PubMed] [Google Scholar]
- [22].Mourtada-Maarabouni M, Pickard MR, Hedge VL, et al. GAS5, a non-protein-coding RNA, controls apoptosis and is downregulated in breast cancer. Oncogene. 2009;28:195–208. [DOI] [PubMed] [Google Scholar]
- [23].Askarian-Amiri ME, Crawford J, French JD, et al. SNORD-host RNA Zfas1 is a regulator of mammary development and a potential marker for breast cancer. RNA. 2011;17:878–891. [DOI] [PMC free article] [PubMed] [Google Scholar]
- [24].Chang L, Yuan Y, Li C, et al. Upregulation of SNHG6 regulates ZEB1 expression by competitively binding miR-101-3p and interacting with UPF1 in hepatocellular carcinoma. Cancer Lett. 2016;383:183–194. [DOI] [PubMed] [Google Scholar]
- [25].Li Y, Li D, Zhao M, et al. Long noncoding RNA SNHG6 regulates p21 expression via activation of the JNK pathway and regulation of EZH2 in gastric cancer cells. Life Sci. 2018;208:295–304. [DOI] [PubMed] [Google Scholar]
- [26].Meng Q, Yang BY, Liu B, et al. Long non-coding RNA SNHG6 promotes glioma tumorigenesis by sponging miR-101-3p. Int J Biol Markers. 2018;33:148–155. [DOI] [PubMed] [Google Scholar]
- [27].Cai G, Zhu Q, Yuan L, et al. LncRNA SNHG6 acts as a prognostic factor to regulate cell proliferation in glioma through targeting p21. Biomed Pharmacother. 2018;102:452–457. [DOI] [PubMed] [Google Scholar]
- [28].Comet I, Riising EM, Leblanc B, et al. Maintaining cell identity: PRC2-mediated regulation of transcription and cancer. Nat Rev Cancer. 2016;16:803–810. [DOI] [PubMed] [Google Scholar]
- [29].Liang Z, Wang X, Xu X, et al. MicroRNA-608 inhibits proliferation of bladder cancer via AKT/FOXO3a signaling pathway. Mol Cancer. 2017;16(1):96. [DOI] [PMC free article] [PubMed] [Google Scholar]
- [30].Mondal T, Subhash S, Vaid R, et al. MEG3 long noncoding RNA regulates the TGF-beta pathway genes through formation of RNA-DNA triplex structures. Nat Commun. 2015;6:7743. [DOI] [PMC free article] [PubMed] [Google Scholar]
- [31].Li JK, Chen C, Liu JY, et al. Long noncoding RNA MRCCAT1 promotes metastasis of clear cell renal cell carcinoma via inhibiting NPR3 and activating p38-MAPK signaling. Mol Cancer. 2017;16:111. [DOI] [PMC free article] [PubMed] [Google Scholar]
- [32].Wang S, Ke H, Zhang H, et al. LncRNA MIR100HG promotes cell proliferation in triple-negative breast cancer through triplex formation with p27 loci. Cell Death Dis. 2018;9:805. [DOI] [PMC free article] [PubMed] [Google Scholar]
- [33].Vizan P, Beringer M, Ballare C, et al. Role of PRC2-associated factors in stem cells and disease. Febs J. 2015;282:1723–1735. [DOI] [PubMed] [Google Scholar]
- [34].Wang D, Li X, Li J, et al. APOBEC3B interaction with PRC2 modulates microenvironment to promote HCC progression. Gut. 2019;68:1846–1857. [DOI] [PubMed] [Google Scholar]
- [35].Anwar T, Arellano-Garcia C, Ropa J, et al. p38-mediated phosphorylation at T367 induces EZH2 cytoplasmic localization to promote breast cancer metastasis. Nat Commun. 2018;9:2801. [DOI] [PMC free article] [PubMed] [Google Scholar]
- [36].Maclary E, Hinten M, Harris C, et al. PRC2 represses transcribed genes on the imprinted inactive X chromosome in mice. Genome Biol. 2017;18:82. [DOI] [PMC free article] [PubMed] [Google Scholar]
- [37].Kim J, Shin Y, Lee S, et al. Regulation of breast cancer-induced osteoclastogenesis by MacroH2A1.2 involving EZH2-mediated H3K27me3. Cell Rep. 2018;24:224–237. [DOI] [PMC free article] [PubMed] [Google Scholar]
- [38].Hirukawa A, Smith HW, Zuo D, et al. Targeting EZH2 reactivates a breast cancer subtype-specific anti-metastatic transcriptional program. Nat Commun. 2018;9:2547. [DOI] [PMC free article] [PubMed] [Google Scholar]
- [39].Demokan S, Chuang AY, Pattani KM, et al. Validation of nucleolar protein 4 as a novel methylated tumor suppressor gene in head and neck cancer. Oncol Rep. 2014;31:1014–1020. [DOI] [PMC free article] [PubMed] [Google Scholar]
- [40].Tolkach Y, Merseburger A, Herrmann T, et al. Signatures of adverse pathological features, androgen insensitivity and metastatic potential in prostate cancer. Anticancer Res. 2015;35:5443–5451. [PubMed] [Google Scholar]
- [41].Yu KD, Zhu R, Zhan M, et al. Identification of prognosis-relevant subgroups in patients with chemoresistant triple-negative breast cancer. Clin Cancer Res. 2013;19:2723–2733. [DOI] [PMC free article] [PubMed] [Google Scholar]
- [42].Laugesen A, Hojfeldt JW, Helin K. Molecular mechanisms directing PRC2 recruitment and H3K27 methylation. Mol Cell. 2019;74:8–18. [DOI] [PMC free article] [PubMed] [Google Scholar]
- [43].Oksuz O, Narendra V, Lee CH, et al. Capturing the onset of PRC2-mediated repressive domain formation. Mol Cell. 2018;70:1149–1162 e1145. [DOI] [PMC free article] [PubMed] [Google Scholar]
- [44].Liu H, Peng L, So J, et al. TSPYL2 regulates the expression of EZH2 target genes in neurons. Mol Neurobiol. 2019;56:2640–2652. [DOI] [PMC free article] [PubMed] [Google Scholar]
- [45].Lin C, Wu Z, Lin X, et al. Knockdown of FLOT1 impairs cell proliferation and tumorigenicity in breast cancer through upregulation of FOXO3a. Clin Cancer Res. 2011;17:3089–3099. [DOI] [PubMed] [Google Scholar]
- [46].Song L, Gong H, Lin C, et al. Flotillin-1 promotes tumor necrosis factor-alpha receptor signaling and activation of NF-kappaB in esophageal squamous cell carcinoma cells. Gastroenterology. 2012;143:995–1005 e1012. [DOI] [PubMed] [Google Scholar]
- [47].Li L, Luo J, Wang B, et al. Microrna-124 targets flotillin-1 to regulate proliferation and migration in breast cancer. Mol Cancer. 2013;12:163. [DOI] [PMC free article] [PubMed] [Google Scholar]
- [48].Zhang PF, Zeng GQ, Hu R, et al. Identification of flotillin-1 as a novel biomarker for lymph node metastasis and prognosis of lung adenocarcinoma by quantitative plasma membrane proteome analysis. J Proteomics. 2012;77:202–214. [DOI] [PubMed] [Google Scholar]
- [49].Xu X, Wu J, Li S, et al. Downregulation of microRNA-182-5p contributes to renal cell carcinoma proliferation via activating the AKT/FOXO3a signaling pathway. Mol Cancer. 2014;13:109. [DOI] [PMC free article] [PubMed] [Google Scholar]
- [50].Siegelin MD, Reuss DE, Habel A, et al. Quercetin promotes degradation of survivin and thereby enhances death-receptor-mediated apoptosis in glioma cells. Neuro Oncol. 2009;11:122–131. [DOI] [PMC free article] [PubMed] [Google Scholar]
- [51].Shoji T, Saito R, Chonan M, et al. Local convection-enhanced delivery of an anti-CD40 agonistic monoclonal antibody induces antitumor effects in mouse glioma models. Neuro Oncol. 2016;18:1120–1128. [DOI] [PMC free article] [PubMed] [Google Scholar]
- [52].Hanahan D, Weinberg RA. Hallmarks of cancer: the next generation. Cell. 2011;144:646–674. [DOI] [PubMed] [Google Scholar]
- [53].Bendrick JL, Eldredge LA, Williams EI, et al. Desmoplakin harnesses Rho GTPase and p38 mitogen-activated protein kinase signaling to coordinate cellular migration. J Invest Dermatol. 2019;139(6):1227–1236. [DOI] [PMC free article] [PubMed] [Google Scholar]
- [54].Nguyen HT, Phung CD, Thapa RK, et al. Multifunctional nanoparticles as somatostatin receptor-targeting delivery system of polyaniline and methotrexate for combined chemo-photothermal therapy. Acta Biomater. 2018;68:154–167. [DOI] [PubMed] [Google Scholar]
- [55].Pajvani UB, Shawber CJ, Samuel VT, et al. Inhibition of Notch signaling ameliorates insulin resistance in a FoxO1-dependent manner. Nat Med. 2011;17:961–967. [DOI] [PMC free article] [PubMed] [Google Scholar]
- [56].Wang E, Lu SX, Pastore A, et al. Targeting an RNA-binding protein network in acute myeloid leukemia. Cancer Cell. 2019;35:369–384 e367. [DOI] [PMC free article] [PubMed] [Google Scholar]
- [57].Chen F, Chen J, Yang L, et al. Extracellular vesicle-packaged HIF-1alpha-stabilizing lncRNA from tumour-associated macrophages regulates aerobic glycolysis of breast cancer cells. Nat Cell Biol. 2019;21:498–510. [DOI] [PubMed] [Google Scholar]
- [58].Cao C, Zhang T, Zhang D, et al. The long non-coding RNA, SNHG6-003, functions as a competing endogenous RNA to promote the progression of hepatocellular carcinoma. Oncogene. 2017;36:1112–1122. [DOI] [PubMed] [Google Scholar]
- [59].Bahrami-Samani E, Xing Y. Discovery of allele-specific protein-RNA interactions in human transcriptomes. Am J Hum Genet. 2019;104:492–502. [DOI] [PMC free article] [PubMed] [Google Scholar]
- [60].Redrup L, Branco MR, Perdeaux ER, et al. The long noncoding RNA Kcnq1ot1 organises a lineage-specific nuclear domain for epigenetic gene silencing. Development. 2009;136:525–530. [DOI] [PMC free article] [PubMed] [Google Scholar]
- [61].Muller-McNicoll M, Neugebauer KM. Good cap/bad cap: how the cap-binding complex determines RNA fate. Nat Struct Mol Biol. 2014;21:9–12. [DOI] [PubMed] [Google Scholar]
- [62].Cao S, Zheng J, Liu X, et al. FXR1 promotes the malignant biological behavior of glioma cells via stabilizing MIR17HG. J Exp Clin Cancer Res. 2019;38:37. [DOI] [PMC free article] [PubMed] [Google Scholar]
- [63].Kessler T, Sahm F, Sadik A, et al. Molecular differences in IDH wildtype glioblastoma according to MGMT promoter methylation. Neuro Oncol. 2018;20:367–379. [DOI] [PMC free article] [PubMed] [Google Scholar]
- [64].Jones PA, Baylin SB. The epigenomics of cancer. Cell. 2007;128:683–692. [DOI] [PMC free article] [PubMed] [Google Scholar]
- [65].Swigut T, Wysocka J. H3K27 demethylases, at long last. Cell. 2007;131:29–32. [DOI] [PubMed] [Google Scholar]
- [66].Jiao L, Liu X. Structural basis of histone H3K27 trimethylation by an active polycomb repressive complex 2. Science. 2015;350:aac4383. [DOI] [PMC free article] [PubMed] [Google Scholar]
- [67].Li Z, Qiu R, Qiu X, et al. SNHG6 promotes tumor growth via repression of P21 in colorectal cancer. Cell Physiol Biochem. 2018;49(2):463–478. [DOI] [PubMed] [Google Scholar]
- [68].Caprio C, Baldini A. p53 suppression partially rescues the mutant phenotype in mouse models of DiGeorge syndrome. Proc Natl Acad Sci U S A. 2014;111:13385–13390. [DOI] [PMC free article] [PubMed] [Google Scholar]
- [69].Santamaria A, Castellanos E, Gomez V, et al. PTOV1 enables the nuclear translocation and mitogenic activity of flotillin-1, a major protein of lipid rafts. Mol Cell Biol. 2005;25:1900–1911. [DOI] [PMC free article] [PubMed] [Google Scholar]
- [70].Gong H, Song L, Lin C, et al. Downregulation of miR-138 sustains NF-kappaB activation and promotes lipid raft formation in esophageal squamous cell carcinoma. Clin Cancer Res. 2013;19:1083–1093. [DOI] [PubMed] [Google Scholar]
- [71].Zhao L, Li J, Liu Y, et al. Flotillin1 promotes EMT of human small cell lung cancer via TGF-beta signaling pathway. Cancer Biol Med. 2018;15:400–414. [DOI] [PMC free article] [PubMed] [Google Scholar]
- [72].Kowenz-Leutz E, Herr P, Niss K, et al. The homeobox gene GBX2, a target of the myb oncogene, mediates autocrine growth and monocyte differentiation. Cell. 1997;91:185–195. [DOI] [PubMed] [Google Scholar]
- [73].Nakamura H. Regionalization of the optic tectum: combinations of gene expression that define the tectum. Trends Neurosci. 2001;24(1):32–39. [DOI] [PubMed] [Google Scholar]
- [74].Liu X, Zheng J, Xue Y, et al. PIWIL3/OIP5-AS1/miR-367-3p/CEBPA feedback loop regulates the biological behavior of glioma cells. Theranostics. 2018;8:1084–1105. [DOI] [PMC free article] [PubMed] [Google Scholar]
- [75].Su R, Cao S, Ma J, et al. Knockdown of SOX2OT inhibits the malignant biological behaviors of glioblastoma stem cells via up-regulating the expression of miR-194-5p and miR-122. Mol Cancer. 2017;16:171. [DOI] [PMC free article] [PubMed] [Google Scholar]
- [76].Zhang F, Ruan X, Ma J, et al. DGCR8/ZFAT-AS1 promotes CDX2 transcription in a PRC2 complex-dependent manner to facilitate the malignant biological behavior of glioma cells. Mol Ther. 2020;28:613–630. [DOI] [PMC free article] [PubMed] [Google Scholar]
- [77].Shao L, He Q, Liu Y, et al. UPF1 regulates the malignant biological behaviors of glioblastoma cells via enhancing the stability of Linc-00313. Cell Death Dis. 2019;10:629. [DOI] [PMC free article] [PubMed] [Google Scholar]
- [78].Yu M, Xue Y, Zheng J, et al. Linc00152 promotes malignant progression of glioma stem cells by regulating miR-103a-3p/FEZF1/CDC25A pathway. Mol Cancer. 2017;16:110. [DOI] [PMC free article] [PubMed] [Google Scholar] [Retracted]
- [79].Tang W, Wang D, Shao L, et al. LINC00680 and TTN-AS1 stabilized by EIF4A3 promoted malignant biological behaviors of glioblastoma cells. Mol Ther Nucleic Acids. 2019;19:905–921. [DOI] [PMC free article] [PubMed] [Google Scholar]
- [80].Liu X, Zheng J, Xue Y, et al. Inhibition of TDP43-mediated SNHG12-miR-195-SOX5 feedback loop impeded malignant biological behaviors of glioma cells. Mol Ther Nucleic Acids. 2018;10:142–158. [DOI] [PMC free article] [PubMed] [Google Scholar]
- [81].Benzine T, Brandt R, Lovell WC, et al. NS5A inhibitors unmask differences in functional replicase complex half-life between different hepatitis C virus strains. PLoS Pathog. 2017;13(6):e1006343. [DOI] [PMC free article] [PubMed] [Google Scholar]
- [82].Shen S, Yu H, Liu X, et al. PIWIL1/piRNA-DQ593109 regulates the permeability of the blood-tumor barrier via the MEG3/miR-330-5p/RUNX3 axis. Mol Ther Nucleic Acids. 2018;10:412–425. [DOI] [PMC free article] [PubMed] [Google Scholar]
- [83].Chu C, Qu K, Zhong FL, et al. Genomic maps of long noncoding RNA occupancy reveal principles of RNA-chromatin interactions. Mol Cell. 2011;44:667–678. [DOI] [PMC free article] [PubMed] [Google Scholar]
- [84].Wu P, Gao Y, Shen S, et al. KHDRBS3 regulates the permeability of blood-tumor barrier via cDENND4C/miR-577 axis. Cell Death Dis. 2019;10:536. [DOI] [PMC free article] [PubMed] [Google Scholar]
- [85].Wang D, Zheng J, Liu X, et al. Knockdown of USF1 inhibits the vasculogenic mimicry of glioma cells via stimulating SNHG16/miR-212-3p and linc00667/miR-429 axis. Mol Ther Nucleic Acids. 2019;14:465–482. [DOI] [PMC free article] [PubMed] [Google Scholar] [Retracted]
Associated Data
This section collects any data citations, data availability statements, or supplementary materials included in this article.