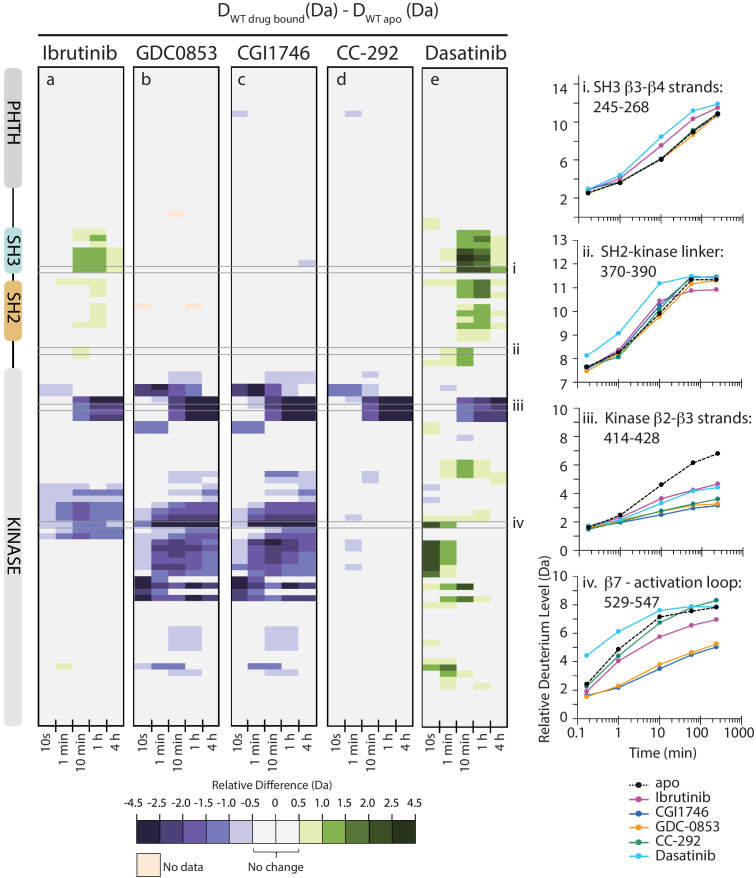
Figure 5. Active site inhibitors induce different conformational responses in full-length BTK.
(a–e) The measured relative deuterium level of peptides in apo BTK was subtracted from the deuterium level of the corresponding peptide from each drug-bound form of BTK (Ddrug-bound-Dapo) and the differences colored according to the scale shown. In this and subsequent figures, peptic peptides are shown from N- to C-terminus, top to bottom, and the amount of time in deuterium is shown left to right. The relative difference data shown here represents a curated set of peptides that are coincident across all six states (apo and five drug-bound BTK forms). The identification of these chosen peptides, the relative difference values, and the complete data set for each state can be found in Source data 1. The approximate position of the domains of BTK, as described in Figure 1a, is shown at the left. Deuterium uptake curves of selected peptides (indicated with a gray box in panels a-e and labeled i-iv) from various regions of the protein are shown on the right.

