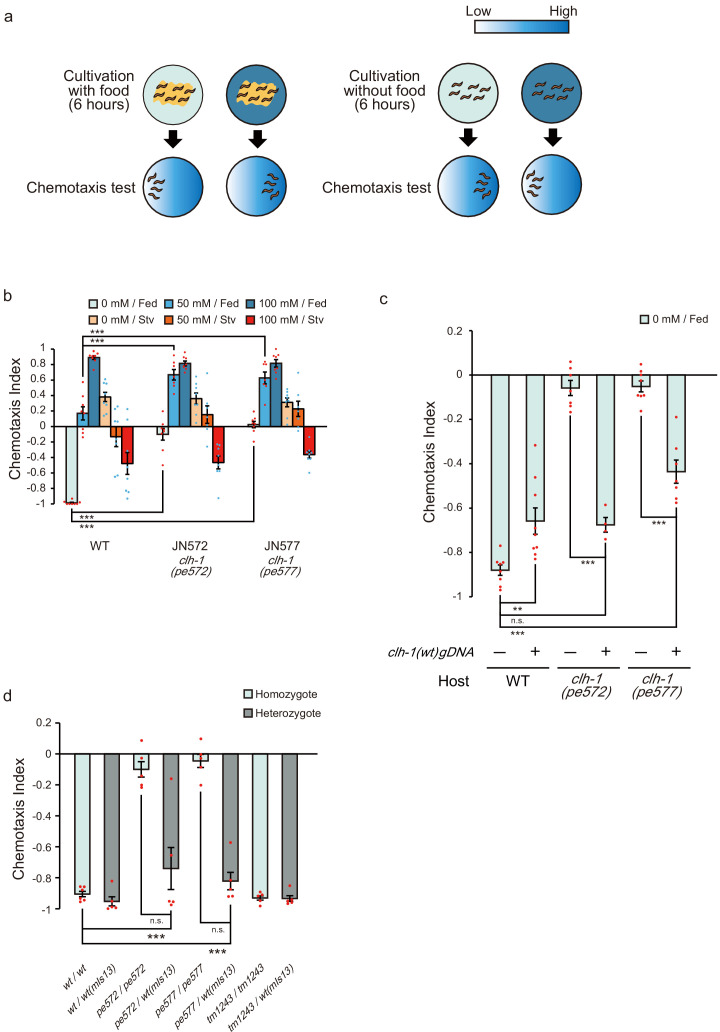
Figure 1. Two missense mutations in clh-1 give rise to food-associated salt chemotaxis disorder.
(a) Salt concentration chemotaxis of wild type. Adult hermaphrodites were cultivated at 0 mM or 100 mM of NaCl with or without food for 6 hr and placed on a chemotaxis assay plate on which NaCl gradient was created. Distribution of animals was quantified by calculating a chemotaxis index. See Materials and methods for details. (b) Chemotaxis of wild-type animals and two mutants obtained from screening, JN572: clh-1(pe572) and JN577: clh-1(pe577). Dots represent individual trials. Bars and the error bars represent mean +/- s.e.m., n = 8 assays, Dunnett’s test, ***p<0.001. (c) Rescue of clh-1(pe572) and clh-1(pe577) mutants by a clh-1 genomic DNA fragment. Dots represent individual trials. Bars and the error bars represent mean +/- s.e.m., n ≧ 4, Tukey’s test, ***p<0.001, **p<0.01, n.s. not significant. (d) Chemotaxis of clh-1 heterozygotes. clh-1 homozygotes were crossed with a clh-1(wt) reporter strain that express GFP in pharyngeal muscle (mIs13). Resulted F1 animals were used for assay. Dots represent individual trials. Bars and the error bars represent mean +/- s.e.m., n ≧ 4, Tukey’s test, ***p<0.001, n.s. not significant.


