

Graphical abstract
Keywords: Favipiravir, COVID-19 virus, Pharmaceutical analysis, Human plasma, Experimental design
Highlights:
-
•
The first spectrofluorimetric method for determination of favipiravir which is a potential treatment of COVID-19 virus.
-
•
The developed method is simple, rapid, robust and sensitive.
-
•
Experimental design has been applied during optimization to ensure robustness of the method.
-
•
The excellent sensitivity of the method allowed the determination of favipiravir in human plasma.
-
•
Assessment of greenness of the proposed method using the analytical eco-scale.
Abstract
The present work describes development of rapid, robust, sensitive and green spectrofluorimetric method for determination of favipiravir (FAV). Different factors affecting fluorescence were carefully studied and Box Behnken Design was applied to optimize experimental parameters. The proposed method is based on measuring native fluorescence of FAV in 0.2 M borate buffer (pH 8.0) at 432 nm after excitation at 361 nm. There was a linear relationship between FAV concentration and relative fluorescence intensity over the range 40–280 ng/mL with limit of detection of 9.44 ng/mL and quantitation limit of 28.60 ng/mL. The method was successfully implemented for determination of FAV in its pharmaceutical formulation with mean % recovery of 99.26 ± 0.87. Moreover, the high sensitivity of the method allowed determination of FAV in spiked human plasma over a range of 48–192 ng/mL. The proposed spectrofluorimetric method was proved to be eco-friendly according to analytical eco-scale.
1. Introduction
Favipiravir (Trade name: Avigan®) was developed by the Fujifilm Toyama Chemical Company in Japan. It selectively inhibits RNA dependant RNA polymerase (RdRP), an enzyme required for RNA viral replication inside human cells. It functions as a purine analogue and is incorporated instead of guanine and adenine. The incorporation of a single molecule of FAV terminates the elongation of viral RNA. Inside the cell, FAV is converted into its active phosphorylated form and is then recognized as a substrate by viral RdRP. It shows a broad spectrum of activity against different RNA viruses including influenza virus [1]. In 2014, FAV was approved in Japan for use in the outbreak of novel or recurrent influenza viral infections, where other antiviral drugs usually used in influenza are insufficiently effective. In Influenza, the beneficial effect has been attributed to decline in pulmonary viral load and TNF-alpha levels in the airways [2]. FAV was also used for the post exposure prophylaxis and treatment of patients with Ebola virus infections [3].
In December 2019, the first cases infected with COVID-19 virus (also known as SARS-Cov-2) were reported in Wuhan, China. Now this virus becomes pandemic all over the world. 25327,098 cases have been diagnosed, and 848,255 died from the pandemic worldwide as of September 1,2020.SARS-Cov-2 is a beta coronavirus which is enveloped positive strand RNA viruse like MERS (Middle East respiratory syndrome)-Cov and SARS (severe acute respiratory syndrome)-Cov [4]. For SARS-Cov-2, the viral genome codes for sixteen nonstructural proteins (Nsps) required for virus replication and pathogenesis and four structural proteins [5]. Unfortunately, no specific therapeutic agent has been approved for the treatment of SARS-Cov-2 till now. However, a number of already existing antiviral drugs which have been proved to be safe and effective against other viruses are tested for their activity against the SARS-Cov-2. Special concern is given to RNA dependent RNA polymerase (RdRp) inhibitors. One of these drugs is favipiravir (FAV) which is known as T-705. Chemically, it is 6-fluoro-3-oxo-3,4- dihydropyrazine −2-carboxamide as shown in Fig. 1 .
Fig. 1.

Chemical structure of favipiravir (FAV).
Literature review reveals that the only reported methods for analysis of FAV is HPLC methods with UV detectio [6], [7]. No spectrofluorometric method has been developed for quantitation of FAV neither in pure form nor in pharmaceutical preparation.
Different experimental designs have been applied for development, optimization and validation of various analytical techniques [8], [9], [10], [11], [12], [13]. The Design of Experiments (DoE) approach allows optimization of experimental parameters after implementing minimal number of experiments. Moreover, it studies interaction between factors which cannot be detected using traditional One Factor at Time (OFAT). Box Behnken Design (BBD) is one of the designs that are used to reach at optimum conditions by examining the factors at three levels with a fewer number of experimental runs compared to other three level designs such as three level factorial design and Central Composite Design (CCD) [14].
The aim of the current work was to develop simple, rapid and robust spectrofluorimetric method for the quantitation of FAV in pure form and pharmaceutical formulation. Box Behnken Design was applied for optimization of experimental factors to get a robust method. The spectrofluorimetric method was implemented for quantitation of FAV in spiked human plasma with satisfactory results. Moreover, the proposed method involved the use of water as diluent which match with green chemistry requirements.
2. Experimental:
2.1. Apparatus
JASCO model FP −6300 spectrofluorometer (Tokyo, Japan) was used for scanning all the fluorescence spectra. Fluorometer was equipped with xenon lamp (150 W) and holographic grating monochromators. The instrument was controlled by Spectra Manager® software V1.53.01. pH measurements were made with HANNA pH 211 Microprocessor pH meter with double junction glass electrode. Design Expert® software (Version 11.1.2.0, Stat-Ease Inc. Minneapolis, MN, USA) was used to develop and analyze Box Behnken design.
For HPLC comparison method, A Dionex UltiMate 3000 RS system was used, (Thermo Scientific™, Dionex™, Sunnyvale, CA, USA). The instrument was connected to a computer bundled with Chromeleon® 7.1 Chromatography Data System software. Inertsil® ODS-3(250 mm × 4.6 mm, 5 μm) column was used for analysis of FAV.
2.2. Material and reagents
Analytical grade chemicals and reagents were utilized throughout the present study.
Favipiravir (FAV) powder (percent assay 100.1%) was procured from Biophore India Pharmaceuticals Private Limited (Telangana, India). Triton – X100 and CTAB (cetyl trimethyl ammonium bromide) were purchased from Sigma-Aldrich (Missouri, USA). Brij-35 was obtained from Fisher scientific (Germany). Sodium dodecyl sulfate (SDS) was purchased from Belami fine chemicals (Mumbai, India). Tween-80 and carboxymethylcellulose (CMC), boric acid, potassium chloride and sodium acetate were bought from El-Nasr Chemical Co. (Cairo, Egypt). Sodium hydroxide was purchased from WinLab (UK).Hydrochloric acid was bought from Ridel-de Haën (Germany). HPLC grade solvents including acetonitrile, methanol and ethanol were procured from Fisher scientific (Germany). All excipients used in the preparation of laboratory prepared tablets were kindly supplied by Pharmaceutical Technology Department, Faculty of Pharmacy, Tanta University (Tanta, Egypt). Human plasma was kindly supplied by Tanta Blood Bank-Tanta international educational hospital (Tanta, Egypt). 0.2 M acetate buffer pH 4.4 and different concentrations of borate buffer with different pH values were prepared as described in USP and “Buffers for pH and Metal Ion Control” book [15], [16].
2.3. Standard solution
The stock solution of FAV was prepared in distilled water at a concentration of 400 µg/mL by dissolving accurately weighed 10 mg of FAV in a calibrated 25-mL volumetric and completing the volume with water. The stock solution was stable in a refrigerator at 4 °C for two weeks. Working standard solution was prepared by taking aliquot of 50 µL from the stock solution and diluting it to 25 mL with water in a calibrated 25-mL volumetric flask. The concentration of this working solution was 800 ng/mL.
2.4. Construction of the calibration curve
Into a set of 10-mL volumetric flasks, aliquots of FAV working standard solution were quantitatively transferred; followed by 2.5 mL of 0.2 M borate buffer pH 8.0.
The solutions were diluted to 10 mL with water and mixed thoroughly to yield final concentrations in the range of 40–280 ng/mL. The solutions were measured at 432 nm after excitation at 361 nm and the reading was corrected in respect to blank. Relative fluorescence intensity (RFI) of each solution was plotted against the final drug concentration in ng/mL and the corresponding regression equation was computed.
2.5. Analysis of laboratory prepared tablet
The tablet of favipiravir is not available yet in the local market, so a laboratory prepared mixture simulating this tablet dosage form (Avigan® 200) was prepared, the amounts of excipients were deduced from handbook of pharmaceutical excipients [17]. The tablet was prepared by mixing of 200 mg FAV with the following excipients: 7.05 mg povidone, 2.35 mg colloidal silicon dioxide, 11.75 mg low substituted hydroxypropyl cellulose, 11.75 mg cross povidone, 2.35 sodium stearyl fumarate, 10 mg talc, and 5 mg titanium dioxide. An accurately weighed amount of the laboratory synthetic tablet containing 10 mg of FAV was transferred into a calibrated 25-mL volumetric flask and 10 mL distilled water was added, sonicated for 10 min and completed to the specified volume using distilled water. This solution was filtered through a 0.45 µm membrane nylon filter, the first portion of the filtrate was discarded, and then 50 µL of the filtrate was transferred to a calibrated 25-mL volumetric flask and completed to the mark with distilled water. Finally, 1.5 mL of this solution was transferred to a 10-mL volumetric flask, followed by 2.5 mL of 0.2 M borate buffer pH 8.0, and diluted to the specified volume with distilled water to obtain a solution containing 120 ng/mL. The same procedure was repeated on another five portions of the synthetic tablets. Fluorescence intensity of the solutions was obtained at 432 nm after excitation at 361 nm. Blank experiments were performed alongside and the fluorescence readings were corrected for it. The concentration of FAV in the tablet was calculated using the regression equation.
2.6. Application to biological fluid (human plasma)
Into 5-ml volumetric flask, 1 mL of plasma was transferred and spiked with FAV working solutions (12–48 µg/mL) so that FAV concentration in plasma lies within the range of (6–24 μg/mL). Then, the volume was completed to the mark with methanol to precipitate protein.
Afterwards, the mixtures were vortex-mixed for two minutes then centrifuged at 4000 rpm for 10 min. For each mixture, an aliquot of 400 µL was transferred to a calibrated 10-mL volumetric flask, 2.5 mL of borate buffer pH 8.0 was added and then distilled water was added up to the mark to obtain final concentrations in the range of 48 – 192 ng/mL. Fluorescence intensity of the solutions was measured at 432 nm after excitation at 361 nm. Blank experiments were carried out by handling FAV plasma free samples in a similar way. Regression equation was derived. The human plasma used in the study was approved by the institution's ethics committee.
3. Results and discussion:
3.1. Effect of experimental parameters
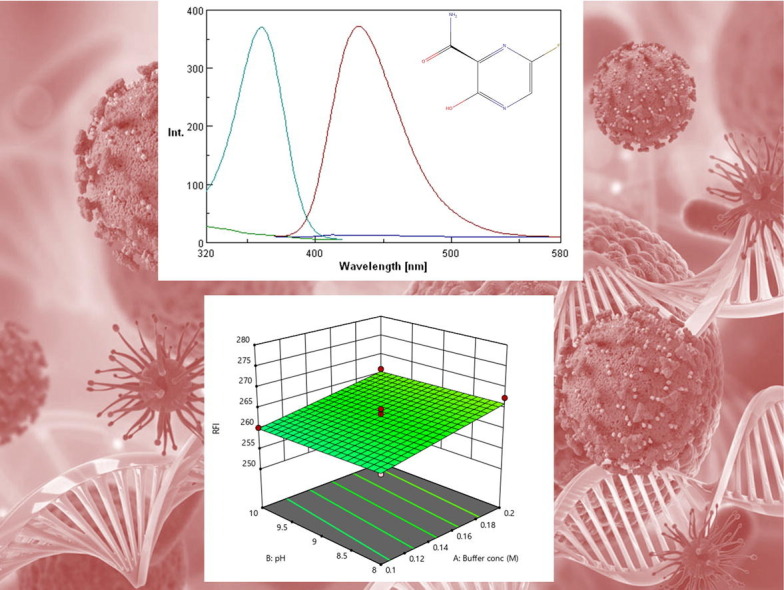
FAV was found to exhibit native fluorescence of high intensity at 432 nm after excitation at 361 nm as excitation wavelength. Fig. 2 shows excitation and emission spectra of FAV solution at concentration of 120 ng/mL. Different parameters affecting the native fluorescence of FAV such as: diluting solvent, buffer system, effect of surfactants, pH, concentration of buffer, and volume of buffer were studied.
Fig. 2.

Excitation and emission spectra of 120 ng/mL FAV, where (A) is the excitation of FAV, (A’) is the emission of FAV, (B) is blank excitation and (B’) is blank emission.
3.1.1. Effect of diluting solvent
Different diluting solvents as water, acetonitrile, methanol, ethanol, and acetone were studied. Water resulted in the highest fluorescence intensity after considering the blank reading as illustrated in Fig. 3 (a). Water also has an advantage regarding greenness of the method. Thus, the water was selected as diluting solvent.
Fig. 3.

(a) Effect of different solvents on RFI of FAV, (b) Effect of different buffers on RFI, and (c) Effect of different surfactants on RFI of FAV.
3.1.2. Effect of different buffer systems
Different buffers such as acetate buffer (pH 4.4) and borate buffer (pH 9.5) in addition to 0.1 N HCl and 0.1 N NaOH were studied covering different pH ranges. Fluorescence intensity FAV was found to increase in alkaline media. The highest RFI was obtained in borate buffer as shown in Fig. 3 (b).
3.1.3. Effect of organized media
Different surfactants including anionic surfactant (SDS), cationic surfactant (CTAB), non-ionic surfactants (Tween 80, Triton X-100 and Brij-35), anionic polysaccharide (CMC sodium) and macromolecules (β cyclodextrin) were investigated separately by adding 2 mL of a 2% (w/v) aqueous solution of each surfactant to FAV solution and measuring RFI. It was found that none of the mentioned surfactants increased the fluorescence intensity of FAV while SDS decreased it as shown in Fig. 3 (c).
3.1.4. Optimization of experimental parameters using Box Behnken Design
As stated earlier, borate buffer was the best buffer regarding fluorescence intensity. Box Behnken Design was implemented to optimize concentration of buffer, pH, and volume of buffer. Box Behnken design was selected for optimization because it helps to reach optimum conditions using three levels of factors with a minimum number of experimental runs compared to other response surface designs. A set of 15 experiments with three central points were carried out, and relative fluorescence intensity (RFI) was taken as response to be optimized as shown in Table 1 .
Table 1.
Box Behnken Design matrix for optimization of RFI of FAV.
| Factor 1 | Factor 2 | Factor 3 | Response | |
|---|---|---|---|---|
| Run | A:Buffer conc (M) | B:pH | C:volume of buffer (mL) | RFI |
| 1 | 0.1 | 10 | 1.5 | 260.262 |
| 2 | 0.15 | 10 | 2.5 | 271.069 |
| 3 | 0.2 | 9 | 2.5 | 275.152 |
| 4 | 0.2 | 10 | 1.5 | 266.135 |
| 5 | 0.1 | 8 | 1.5 | 260.505 |
| 6 | 0.2 | 9 | 0.5 | 254.102 |
| 7 | 0.15 | 8 | 2.5 | 271.18 |
| 8 | 0.15 | 9 | 1.5 | 263.587 |
| 9 | 0.15 | 9 | 1.5 | 264.888 |
| 10 | 0.2 | 8 | 1.5 | 267.539 |
| 11 | 0.1 | 9 | 0.5 | 250.966 |
| 12 | 0.15 | 8 | 0.5 | 253.706 |
| 13 | 0.1 | 9 | 2.5 | 269.571 |
| 14 | 0.15 | 9 | 1.5 | 264.656 |
| 15 | 0.15 | 10 | 0.5 | 252.872 |
Different results obtained from Box Behnken Design including contour plot, 3D response surface diagram, interaction plot are shown in Fig. 4 . No significant interaction between factors was observed. Response optimizer provided the optimum conditions that involved the use of 2.5 mL borate buffer at pH 8.0.
Fig. 4.

Box Behnken Design Results (a) contour plot, (b) 3D response surface plot, (c) interaction plot and (d) Desirability plot.
3.2. Method validation
The validation of the developed analytical procedure was achieved by following the guidelines of ICH [18]. Linearity and range, limits of quantitation (LOQ) and detection (LOD), accuracy, precision, and robustness were investigated.
3.2.1. Linearity & range:
The linearity was confirmed by construction of the calibration curves through plotting the RFI of FAV, on y-axis, against the corresponding concentration of FAV in µg/mL, on x-axis. Statistical results were presented in Table 2 .
Table 2.
1 Linearity regression data for FAV using the proposed spectrofluorimetric method.
| Parameter | Value |
|---|---|
| Linearity range (ng/mL) | 40–280 |
| slope | 3.0128 |
| SE of slope | 0.0154 |
| Intercept | 1.0068 |
| SE of Intercept | 2.5939 |
| Correlation coefficient (r) | 0.9998 |
| SE of estimation | 3.5587 |
3.2.2. Quantitation (LOQ) and detection (LOD) limit
The guidelines of ICH (Q2 (R1)) were followed for the estimation of LOQ and LOD by applying the following equations: LOQ = 10 Sa / b and LOD = 3.3 σ/S, where σ is the standard deviation of the intercept, and the slope of the calibration curve is represented by S. The found values of LOD and LOQ were 9.44 and 28.60 ng/mL respectively. These values indicate the high sensitivity of the proposed spectrofluorimetric method.
3.2.3. Accuracy and precision
The accuracy of the proposed method was assessed by performing the general analytical procedure for estimating five solutions containing different concentrations of FAV within the linearity range. The measurement was performed in three replicates and the recovery percentage and standard deviation (SD) were calculated. The obtained % recovery values were close to 100% giving a sign for the respected degree of accuracy of the suggested method as shown in Table 3 . For calculation of intra and inter day precisions, triplicate samples corresponding to three different concentrations of FAV were assayed in one day and in three different successive days, respectively. The small values of % RSD was indicative for the precision of the method as shown in Table 4 .
Table 3.
Evaluation of accuracy for the determination of FAV.
| Drug | conc. taken (ng/mL) | conc. found (ng/mL)* | % Recovery | Mean % recovery ± SD |
|---|---|---|---|---|
| FAV | 40 | 40.25 | 100.63 | 100.54 ± 0.53 |
| 60 | 60.73 | 101.22 | ||
| 120 | 120.21 | 100.18 | ||
| 240 | 241.94 | 100.81 | ||
| 280 | 279.66 | 99.88 |
Mean of five determinations.
Table 4.
Evaluation of the precision of the proposed method for the determination of FAV.
| Drug | Intra day | Inter day | ||||
|---|---|---|---|---|---|---|
| conc. taken (ng/mL) | conc. found (ng/mL)* | %RSD | conc. taken (ng/mL) | conc. found (ng/mL)* | %RSD | |
| FAV | 60 | 60.28 | 0.66 | 60 | 60.27 | 0.85 |
| 61.03 | 61.07 | |||||
| 60.89 | 61.25 | |||||
| 120 | 119.80 | 0.46 | 120 | 120.21 | 0.57 | |
| 120.00 | 121.11 | |||||
| 120.85 | 121.56 | |||||
| 240 | 243.12 | 0.42 | 240 | 240.63 | 0.49 | |
| 241.41 | 242.26 | |||||
| 241.29 | 242.91 | |||||
Mean of three determinations.
3.2.4. Robustness
Robustness of the current methodology was studied by introducing small yet deliberate variations within its optimized parameters. The examined parameters in the robustness testing were the change in volume of borate buffer (2.5 mL ± 0.2) and change of pH (8.0 ± 0.2).
The relative standard deviation was still less than 2% indicating robustness of the method.
3.3. Applications
3.3.1. Analysis of the pharmaceutical formulation
The proposed method was implemented for the analysis of FAV in its laboratory prepared tablet with no interference from excipients. The percent recovery ± S.D. was 99.26 ± 0.87 indicating the high accuracy and precision of the method. The percent recovery of the proposed method was compared with that of the reference method. It was found that there is no significant difference between the developed method and the comparison method as indicated by statistical analysis of the results using student's t-test and the F-test shown in Table 5 .
Table 5.
Application of the proposed method and comparison method for the determination of the FAV in laboratory prepared tablet.
| Proposed method | Reported method | |
|---|---|---|
| % Recovery of FAV | % Recovery of FAV | |
| 99.37 | 98.25 | |
| 98.53 | 97.26 | |
| 100.67 | 99.45 | |
| 99.09 | 100.26 | |
| 97.98 | 101.02 | |
| 99.89 | 99.23 | |
| Mean % recovery ± S.D. | 99.26 ± 0.87 | 99.25 ± 1.24 |
| t-test | 0.987 (2.228)* | |
| F-test | 1.995 (5.050)* | |
Values in parenthesis are the tabulated t- and F- values at p = 0.05.
3.3.2. Application to biological fluid (spiked human plasma)
Different studies have been carried out to determine the pharmacokinetic effects of multiple doses of FAV. Cmax of FAV ranged from 22.01 µg/mL to 36.24 µg/mL in healthy American and Japanese subjects [19]. The proposed spectrofluorimetric method was investigated for its capability to determine FAV in plasma samples through a linear range from 48 to192 ng/mL. Different solvents were tried to precipitate plasma proteins including methanol, ethanol and acetonitrile. Methanol was selected as it gives the best percent extraction (93.54%) compared with acetonitrile and ethanol (77.23% and 74.85% respectively). The plasma calibration curve was linear with the following equation: y = 3.2485x − 28.5004 (r2 = 0.9988). The method has been carried out on blank plasma in order to check the effect of interfering matrix.
The proposed method selectivity has proven by determination of FAV in spiked human plasma samples without interference from endogenous matrix. The results shown in Table 6 , revealed the suitability of the method for the assay of FAV in spiked human plasma with acceptable recovery.
Table 6.
Application of the spectrofluorometric method to the determination of FAV in spiked human plasma.
| Conc. added (ng/mL) | Mean conc. found (ng/mL)* | Mean % recovery ± SD | %RSD |
|---|---|---|---|
| 48 | 48.97 | 102.02 ± 3.86 | 3.78 |
| 80 | 79.53 | 99.42 ± 3.63 | 3.65 |
| 128 | 125.29 | 97.88 ± 2.34 | 2.39 |
| 160 | 162.71 | 101.69 ± 2.96 | 2.91 |
| 192 | 191.51 | 99.74 ± 2.54 | 2.54 |
Mean of five determinations.
3.4. Assessment of the method greenness:
The greenness of the proposed spectrofluorimetric method was proved by calculating analytical eco-scale. The calculation of analytical eco-scale assumes that an ideal green method has a score of 100, and penalty points are assigned for each of the method parameters including energy consumption, reagents, and waste which deviate from optimum green analysis [20]. The calculated eco-scale was found to be 92 as shown in Table 7 .
Table 7.
Calculation of analytical eco-scale for the developed method.
| Reagents/Instruments | Penalty points |
|---|---|
| Reagents | |
| Boric acid | 2 |
| Potassium chloride | 1 |
| Sodium hydroxide | 2 |
| Instruments | |
| Spectrofluorimetry | 0 |
| Occupational hazards | 0 |
| Waste | 3 |
| Total penalty points | ∑ 8 |
| Analytical eco-scale score | 92 |
4. Conclusion
The current study was carried out to investigate spectrofluorimetric method for rapid quantitation of the new antiviral drug; favipiravir that has potential therapeutic effect against COVID-19 virus. The present work is the first spectrofluorimetric approach for the assay of FAV in pharmaceutical formulations. The implementation of Box-Behnken Design led to development of robust method with less trial and error experiments. The adopted method is simple, fast, robust and green and can replace the only reported HPLC method for determination of favipiravir in routine analysis. Moreover, the high sensitivity of the proposed method allowed determination of FAV in spiked human plasma.
CRediT authorship contribution statement
Safa M. Megahed: Conceptualization, Investigation, Formal analysis, Writing - original draft, Writing - review & editing. Ahmed A. Habib: Conceptualization, Formal analysis, Writing - review & editing. Sherin F. Hammad: Conceptualization, Formal analysis, Writing - review & editing. Amira H. Kamal: Conceptualization, Formal analysis, Writing - review & editing.
Declaration of Competing Interest
The authors declare that they have no known competing financial interests or personal relationships that could have appeared to influence the work reported in this paper.
Acknowledgement:
I would like to acknowledge with much appreciation Dr. Mohammed Abdol Quader, R&D section head in pharmaceutical industry for his unlimited support and providing raw materials.
References
- 1.Furuta Y., Komeno T. Favipiravir (T-705), a broad spectrum inhibitor of viral RNA polymerase. P. Jpn. Acad. B-Phys. 2017;93:449–463. doi: 10.2183/pjab.93.027. [DOI] [PMC free article] [PubMed] [Google Scholar]
- 2.Tanaka T., Kamiyama T. T-705 (Favipiravir) suppresses tumor necrosis factor α production in response to influenza virus infection: a beneficial feature of T-705 as an anti-influenza drug. Acta Virol. 2017;61:48. doi: 10.4149/av_2017_01_48. [DOI] [PubMed] [Google Scholar]
- 3.Bai C.-Q., Mu J.-S. Clinical and virological characteristics of Ebola virus disease patients treated with favipiravir (T-705)—Sierra Leone. Clin. Infect. Dis. 2014;63(2016):1288–1294. doi: 10.1093/cid/ciw571. [DOI] [PubMed] [Google Scholar]
- 4.Elfiky A.A. SARS-CoV-2 RNA dependent RNA polymerase (RdRp) targeting: An in silico perspective. J. Biomol. Struct. Dyn. 2020:1–9. doi: 10.1080/07391102.2020.1761882. [DOI] [PMC free article] [PubMed] [Google Scholar]
- 5.Zhu N., Zhang D. A novel coronavirus from patients with pneumonia in China, 2019. New Eng. J. Med. 2020 doi: 10.1056/NEJMoa2001017. [DOI] [PMC free article] [PubMed] [Google Scholar]
- 6.冯光玲丁文娟邓玉晓赵仁永龚艳艳段崇刚孙晋瑞, 2015, A kind of Favipiravir has the HPLC assay method of related substance, CN104914185B.
- 7.Bulduk İ. HPLC-UV method for quantification of favipiravir in pharmaceutical formulations. Acta Chromatogr. 2020 doi: 10.1556/1326.2020.00828. [DOI] [PMC free article] [PubMed] [Google Scholar]
- 8.Little T.A. Design of experiments for analytical method development and validation. BioPharm Int. 2014 [Google Scholar]
- 9.Orlandini S., Pinzauti S. Application of quality by design to the development of analytical separation methods. Anal. Bioanal. Chem. 2013;405:443–450. doi: 10.1007/s00216-012-6302-2. [DOI] [PubMed] [Google Scholar]
- 10.Habib A.A., Mabrouk M.M. Implementation of factorial design for optimization of forced degradation conditions and development of validated stability indicating RP-HPLC method for Lidocaine hydrochloride. Der Pharma Chemica. 1981;7:198–211. [Google Scholar]
- 11.Habib A.A., Hammad S.F. Innovative quality by design approach for development of green micellar HPLC method for simultaneous determination of atorvastatin and amlodipine. Chromatographia. 2020;83:1221–1231. doi: 10.1007/s10337-020-03937-5. [DOI] [Google Scholar]
- 12.Ye C., Liu J. Design of experiment and data analysis by JMP®(SAS institute) in analytical method validation. J. Pharm. Biomed. Anal. 2000;23:581–589. doi: 10.1016/S0731-7085(00)00335-6. [DOI] [PubMed] [Google Scholar]
- 13.S.M. Megahed, A. Habib, et al., Application of chromatographic response function in development of stability indicating hplc method for determination of benoxinate hydrochloride and fluorescein sodium mixture using factorial design, JAMPR1 (2020) 1–8. 10.21608/JAMPR.2020.21563.1001
- 14.Ferreira S.C., Bruns R. Box-Behnken design: an alternative for the optimization of analytical methods. Anal. Chim. Acta. 2007;597:179–186. doi: 10.1016/j.aca.2007.07.011. [DOI] [PubMed] [Google Scholar]
- 15.Perrin D. Springer Science & Business Media; 2012. Buffers for pH and Metal Ion Control. [Google Scholar]
- 16.The United States Pharmacopeia, USP 40, Online version, US Pharmacopeial Convention, Rockville, 2017. http://www.uspnf.com, Accessed 10.8.2020
- 17.Rowe R.C., Sheskey P. Handbook of pharmaceutical excipients. Libros Digitales-Pharmaceutical Press. 2009 [Google Scholar]
- 18.C. Nehls, M. Buonarati, S. Cape, R. Islam, C. Satterwhite, C. Briscoe, R. Hayes, A. Dinan, K. Sales, S. Anderson, GCC consolidated feedback to ICH on the 2019 ICH M10 bioanalytical method validation draft guideline, Bioanalysis 11 (2019) 1–228. [DOI] [PubMed]
- 19.Pharmaceuticals and Medical Devices Agency: Avigan(favipiravir) Review Report (2014).
- 20.Gałuszka A., Migaszewski Z.M., Konieczka P., Namieśnik J. Analytical Eco-Scale for assessing the greenness of analytical procedures. TrAC Trend Anal. Chem. 2012;37:61–72. doi: 10.1016/j.trac.2012.03.013. [DOI] [Google Scholar]