Abstract
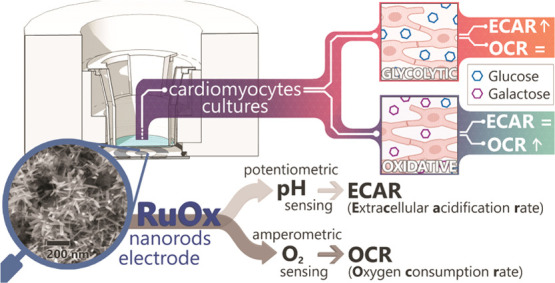
In vitro studies which focus on cellular metabolism can benefit from time-resolved readouts from the living cells. pH and O2 concentration are fundamental parameters upon which cellular metabolism is often inferred. This work demonstrates a novel use of a ruthenium oxide (RuOx) electrode for in vitro studies. The RuOx electrode was characterized to measure both pH and O2 using two different modes. When operated potentiometrically, continuous pH reading can be obtained, and O2 concentration can be measured chronoamperometrically. In this work, we demonstrate the use of the RuOx electrodes in inferring two different types of metabolism of human pluripotent stem cell-derived cardiomyocytes. We also show and discuss the interpretation of the measurements into meaningful extracellular acidification rates and oxygen consumption rates of the cells. Overall, we present the RuOx electrode as a versatile and powerful tool in in vitro cell metabolism studies, especially in comparative settings.
Keywords: ruthenium oxide, cell metabolism, dual electrode, extracellular acidification rate, oxygen consumption rate
In vitro cell culture models are essential tools in current biomedical research. Many classes of in vitro models have been developed in addressing research questions at practically any biological complexity. From single-cell models which have successfully elucidated single-cell physiologies,1−3 up to organ- and body-level in vitro models are currently being developed, aspiring to replace animal models.4,5 More often than not, cell biochemical pathways and cellular metabolism are at the center of these biomedical studies (e.g., disease model studies, drug response). These studies can thus highly benefit from time-resolved (chemical) readouts from living cells. A class of microsensors (often called microphysiometry), explicitly developed for such purposes, have been expanding over the years.6,7 Such microsensors could be placed in close vicinity of the cells to monitor metabolic parameters from the cells’ immediate surroundings, from which cellular metabolism or signaling pathways could be inferred.
Some of the most prevalent readouts involve the fundamental parameters of cell metabolism, i.e., the extracellular acidification rates (ECARs—determined from measured pH) and oxygen consumption rates (OCRs—determined from measured O2 level). The ECARs are often used as a measure of glycolytic metabolism, while the OCRs are used as a measure of oxidative phosphorylation.6,8,9 In this work, we present a novel, on-chip ruthenium oxide (RuOx) electrode that can be operated using different electrochemical techniques to sense both pH and O2 of a cell culture environment. Our electrode offers a versatile and low-cost alternative to the commercially available microphysiometry dedicated systems (e.g., Seahorse XF analyzers by Seahorse Bioscience, Oroboros O2K system by Bioblast10,11). While these systems are an excellent means to study cellular metabolism, they can only cater for a limited range of models/system designs. As pointed out, many different classes of in vitro models/devices have been developed that encompass different levels of biological complexity. For instance, currently, no commercially available system can be applied in the rapidly growing class of microfluidic organ-on-chips devices. Our on-chip electrode can be implemented in such microfluidic devices, as well as in a static cell reactor setup (shown in this work).
We demonstrate the working of our RuOx electrode in studying the metabolism of human pluripotent stem cell-derived cardiomyocytes (hPSC-CMs). hPSC-CMs are a very effective tool in studying many prevalent diseases and the treatment thereof. However, the differentiated cells tend to be immature and different maturation methods are being investigated to achieve hPSC-CMs that can accurately model adult cardiomyocytes for in vitro studies.12−14 One of the characteristics of mature cardiomyocytes is the ability to switch their energetic metabolism based on the available carbon substrates.10,15 Mature cardiomyocytes cultured in an abundance of glucose have been reported to undergo glycolysis. However, they are also capable of switching to oxidative phosphorylation when exposed to low-glucose level and an abundance of galactose instead.14,15 hPSC-CMs, on the other hand, rely for the most part on aerobic glycolysis and exhibit little oxidative phosphorylation activity. Readouts of hPSC-CMs metabolism are therefore directly useful in studying their maturity. While cells undergoing different energetic metabolisms cannot be discerned optically (in a label-free manner), they are discernible by their ECARs and OCRs.15
Here, we show the use of the RuOx electrode to extract both the ECARs and OCRs of hPSC-CMs in culture. The ECARs were calculated from the cell media pH, recorded potentiometrically,16 and the OCRs from the cell media O2 level, sampled using a chronoamperometric technique. The use of a single electrode for both parameters offers many advantages. It unquestionably simplifies the fabrication and integration of the sensor, leaving smaller footprints overall. More importantly, it allows for higher and more precise spatial resolution of the sensor. Monitoring both parameters from a targeted cluster or different parts of cell cultures would then be possible, which might prove highly advantageous for nonuniform cell cultures. A device capable of measuring both parameters has only been previously reported using a single ion-sensitive field-effect transistor (ISFET).17 The device operation involved an indirect O2 measurement by measuring the OH– as byproducts of O2 reduction. A palladium electrode was included around the ISFET gate to drive the O2 reduction electrochemically. The ISFET sensing gate could then monitor and differentiate pH changes from cell-induced acidification as well as the pH increase from the O2 reduction reaction. However, the device operation requires regeneration of the palladium electrode surface (by applying highly positive potential bias). It has therefore been reported that the device is prone to crosstalk from other (electro-oxidative) processes. Also, the device sensitivity is compromised by the linear OH– generation and the detection of pH change in the logarithmic scale. Better O2 sensitivity can then be achieved from the linear scaling of the amperometric signal to O2 concentration. To our knowledge, there have been no further reports on a single device capable of direct O2 sensing as well as potentiometric pH sensing. In this study, we present the characterization of the RuOx electrode in sensing both pH and O2 levels. We also explore techniques in applying the same sensor to extract meaningful ECAR and OCR values to infer the cell metabolism of hPSC-CMs cell culture.
Materials and Methods
Electrodes and Setup
The RuOx modification was done on a sputtered Pt electrode (circular, 2.4 mm in diameter, 200 nm thick) on glass chips, as previously reported.16 The glass chips were first cleaned by 5 min sonication in isopropanol. The Pt electrode was then electrochemically cleaned by applying cyclic voltammetry (CV, five cycles with a scan rate (SR) of 200 mV/s in 0.5 M H2SO4 between −1 and 2 V (vs Ag/AgCl), ending in 2 V; followed by 20 cycles with SR 100 mV/s in 0.5 M H2SO4 between −0.2 and 1.2 V, ending in 1.2 V). The potential sweeps were performed using a Bio-Logic SP300 bipotentiostat. The chip was then rinsed with deionized (DI) water, blown dry with N2, and used as an RuOx substrate, as previously described.16,18 In short, the Ru(OH)3 precursor was precipitated from 5 mM RuCl3 (Sigma-Aldrich) solution, by adding 5 mM NaOH (Sigma-Aldrich) solution dropwise. The precursor was then rinsed and resuspended in DI water. The resuspension was dropped on the clean Pt substrate and left to dry at room temperature. The chips with Ru(OH)3 precursor were baked in a preheated oven at 350 °C for 4 h and left in the oven to cool to room temperature (usually overnight). The resulting RuO2 nanorods were confirmed by scanning electron microscopy (SEM) imaging (FEI Sirion HR-SEM).
The characterization experiments were performed using a liquid junction Ag/AgCl (saturated KCl) reference electrode (CH Instruments). The measurements conducted in an incubator used a Ag/AgCl electrode as an on-chip quasi-reference electrode. This Ag/AgCl electrode was fabricated by anodic chloridization of a sputtered Ag electrode in 1 M KCl solution for 1 h (at 13 μA/mm2) or until measured potential exceeded 0.5 V. The glass chip was used with an in-house fabricated Teflon chip holder equipped with pogo pins for connection. The setup was placed inside a Faraday cage during all characterization measurements.
To minimize biofouling, the electrodes were covered with Nafion 117 solution (Sigma-Aldrich) for characterization tests and cell measurements. The Nafion solution (30 μL) was dropped on the electrode (in the Teflon setup) and was left to dry in air at room temperature for at least 15 min. The covered electrodes were then rinsed thoroughly with DI water.
pH and O2 Sensing Characterization
The pH sensing performance of the RuOx electrodes has been reported elsewhere.16 The electrodes used in this study were tested for their sensitivity with the Nafion coating following the same protocol and pH buffers. Their pH sensing performance in biological cell medium was also tested, by performing calibration in fresh CM-TDI medium. The medium pH was changed by adding different amounts of 1 mM lactic acid.
Characterization of O2 sensing was done by performing CV (SR = 100 mV/s) and chronoamperometry (with −0.400 V applied bias) in phosphate-buffered saline (PBS) with different aeration. The solution’s aeration was controlled by bubbling the PBS for 15 min with a different mixture ratio of instrumental air and argon gas (altogether 200 sccm); the flow of both gases was controlled independently by a Brooks mass flow meter type 5850TR, with a homemade controller. A calibration experiment using biological cell medium with 0.25% bovine serum albumin (BSA) was done the same way, only with a lower gas flow (altogether 100 sccm) bubbling for 5 min, followed by flowing the gas mixture on top of the cell medium for 10 min. Bubbling time longer than 5 min was not possible due to the high protein content, as it resulted in rigid bubbles that poured out of the vial after 5 min. Less accurate control of O2 concentration was achieved in this experiment. All measurements were carried out using the same Bio-Logic SP300 bipotentiostat at 21 ± 1 °C. All potentials were measured against liquid junction Ag/AgCl (saturated KCl).
Cell Culture and Measurement
The hPSC-CMs used were derived from the double-reporter mRubyII α-actinin/green fluorescence protein NKX2.5 (DRRAGN) cell line, as reported by Ribeiro et al.19 Differentiation to cardiomyocytes was done as described previously.20 Briefly, hPSCs were seeded at a density of 25 000 cells/cm2 on Matrigel-coated six-well plates in Essential 8 medium (Thermo Fisher) (as described in ref (21)) on day −1. On day 0, mesodermal differentiation was initiated by addition of a Wnt activator CHIR99021 (1.5 μmol/L, Axon Medchem 1386), Activin-A (20 ng/mL, Miltenyi 130-115-010), and BMP4 (20 ng/mL, R&D systems 314-BP/CF) in BPEL medium. On day 3, the Wnt was inactivated by adding XAV939 (5 μmol/L, R&D Systems 3748) in BPEL. In addition, Matrigel (Corning, 1:200) was added to promote adhesion of cells. Cell cultures were refreshed on days 7 and 10 with BPEL after the start of differentiation until differentiation was completed (day 13). From there, hPSC-CMs were maintained in CM-TDI maturation medium with 5 μM T3 hormone, 1 μM dexamethasone, 100 ng/mL IGF-I (TDI), and 15 mM glucose20 throughout the experiment. This differentiation protocol typically yields 70–80% cardiomyocytes,19 and the unpurified mix population of the cells was used. The cells were then dissociated using 10× TrypLE Select (Thermo Fisher). The released cells were counted in a hemocytometer and resuspended in CM-TDI medium.
The Transwell inserts (Corning Transwell, 12 mm diameter, polyester membranes with 0.4 μm pores) were coated with Matrigel (Corning, at 8.3 μg/cm2) before seeding. The hPSC-CMs were seeded on the Transwell inserts at cell densities of 300 000 and 600 000 cells/well. During measurement, glycolytic group cells were incubated in CM-TDI medium (refreshed at the start of measurement). The oxidative group was incubated in CM-TDI medium, however, with 10 mM galactose and 4.5 mM glucose instead.
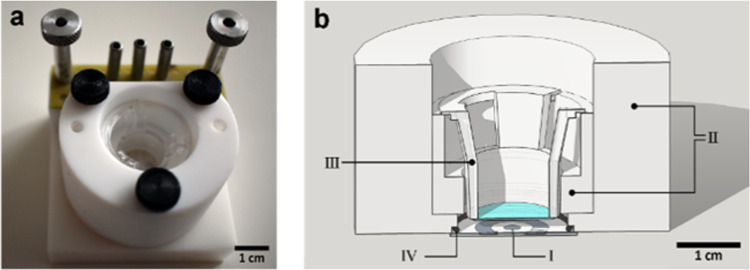
The glass chip and Teflon chip holder were autoclaved and kept under sterile conditions before the experiments. After the sterile setup was built (Figure 1a), the electrodes were coated with Nafion, followed by a quick rinse with 70% ethanol and three rinses with PBS. CM-TDI medium (700 μL) was added to the setup and left to equilibrate in the incubator for at least 1 h. Blank measurements in the absence of the cells were then performed. O2 concentration was probed by performing chronoamperometry at −0.650 V vs quasi-Ag/AgCl for 2 s. More negative bias was applied than the tested onset potential of O2 reduction in pH 7.4 (of −0.400 V). This was done to make sure that the measurement was mass-transport-limited, even with the peak shift in the eventually acidified media. This way, the current from O2 reduction measured at the different points in time (and therefore different pH) can be fairly compared.
Figure 1.
Images of the setup used. (a) Photograph of the setup (glass chip, Teflon chip holder, pogo pins connector, and Transwell insert). (b) Cross-sectional drawing of the setup. Teflon holder (II) was made to suspend the membrane of Transwell insert (III) 3 mm above the glass chip (I), with O-ring (IV) to seal the electrochemical cell. The cells were cultured on the top (apical) side of the membrane.
Right before the tests, a visual check of the hPSC-CMs culture in the Transwell insert was performed using an EVOS (EVOS M5000 Imaging System) to make sure the cells were contracting. The Transwell insert (with 200 μL CM-TDI medium) was then introduced into the setup. It was made sure that no air bubble was trapped between the membrane and the chip (see the cross section of the full setup in Figure 1b). The setup was covered with Parafilm and put into the incubator to start the measurement. Electrochemical techniques were performed using a portable EmStatMUX8. Chronoamperometry of the two setups was performed one after the other, while the open-circuit potential of the two setups was measured sequentially using a multiplexer. The cells were inspected visually every 12 h. If no beating activity was seen, the measurement was terminated or restarted with fresh medium. A notable pH change was usually observed after 1 day of incubating the cells in the setup. Therefore pH measurements from day 2 are presented in this paper.
OCR was calculated from the difference in O2 reduction current (at t = 2 s) at each measurement point from the respective blank measurement measured before the cells were introduced. Change in O2 concentration was calculated back from each electrode’s calibration curve performed in the CM-TDI medium before the cell experiment. ECAR was calculated every 5 min. The change in pH value in this time frame was calculated from each electrode’s calibration curve. pH values as measured by the RuOx sensors were calculated back from the pH value measured using a Mettler-Toledo SevenMulti pH meter at the end of the experiment, and slopes were obtained from calibration of the same electrode before the experiment.
Results and Discussion
Fabrication Results
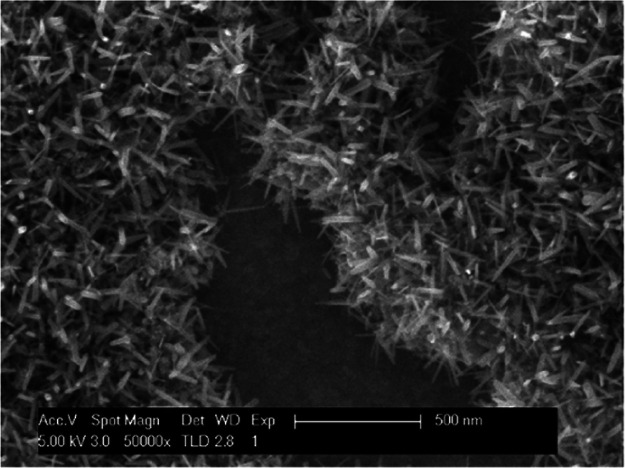
Figure 2 shows the typical SEM image of the annealed RuOx nanorods on a platinum electrode. The amorphous Ru(OH)3 precursor grew into rods of 15–25 nm width and 115–150 nm length. The SEM image shows that the rods grew mostly on the precursor, leaving patches of platinum uncovered by nanorods. Typically, more than 75% of the electrode’s geometric area is covered by RuO2 nanorods. Considering the elevated pH sensitivity (−59 mV/pH) of the electrode16 compared with the pH sensitivity of a bare Pt electrode of −34 mV/pH (Figure S1), it can be assumed that there is sufficient coverage of RuO2 nanorods on the electrode.
Figure 2.
SEM image of the annealed RuOx nanorods.
pH Sensing Characteristics
As mentioned, the general pH sensing characteristics of the RuOx electrode have been reported elsewhere.16 Its applicability in this specific setting was further studied by testing the effect of exposure to a complex cell medium. Figure 3a shows that the application of Nafion did not change the sensitivity of the RuOx electrode. The same electrode was then exposed to the used CM-TDI medium for 65 h in an incubator. Its calibration afterward showed a slight decrease in sensitivity; however, its response remained highly linear.
Figure 3.
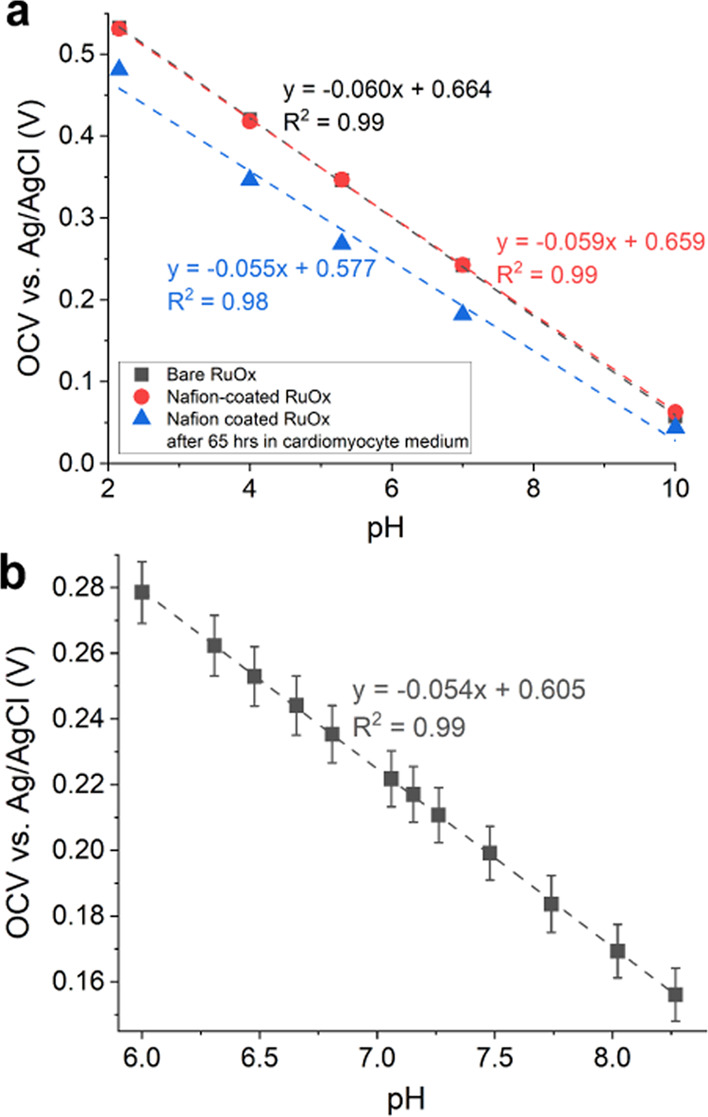
(a) Nafion-coated RuOx showing nearly identical pH response to that of bare RuOx. Prolonged exposure to (used) cardiomyocyte medium (CM-TDI) decreased the pH sensitivity by about 5 mV/pH, however, still with high linearity. (b) pH calibration of Nafion-coated RuOx performed in fresh CM-TDI medium showing similar pH sensitivity, with excellent linearity.
Figure 3b shows the calibration curve (N = 3) of the same electrode performed in fresh CM-TDI medium. The pH value was changed by adding different amounts of 10 mM lactic acid, and the solution’s actual pH was read by a pH meter. All three calibration curves showed a highly linear response (R2 > 0.99), with a narrow range in its slopes (Table S1). These findings suggest that the RuOx electrodes are suitable to use in prolonged measurements in complex cell medium. Particularly, its sensitivity is not expected to drift significantly. However, greater variability was observed in the intercept values of the calibration curves, as was the case for the AgCl electrodes (Figure S2). Therefore, while the change in pH values could be extracted rather accurately from the open-circuit potential, end-point readouts of the actual pH values were necessary to ensure accurate pH determination.
O2 Sensing Characteristics
Dissolved O2 can be readily reduced on an electrode surface, following the reaction given in eq 1.22 In a mass-transport-limited system, the resulting reductive current is therefore linearly correlated to the O2 concentration in the solution.
| 1 |
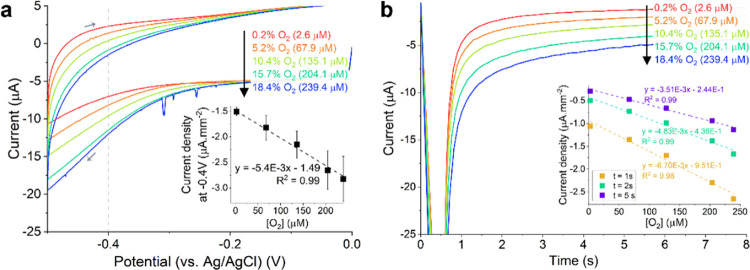
CVs recorded on the RuOx electrode in PBS showed a reductive current that grew linearly with the O2 concentration with an onset potential of around −0.400 V vs liquid junction Ag/AgCl (Figure 4a). The relatively high variation between four tested electrodes (Figure 4a, inset) implied the necessity to calibrate the electrodes individually. The more straightforward chronoamperometry technique could also capture the same current. When −0.400 V potential bias was applied on the RuOx electrode, a reductive current was recorded. The amplitude of this current was linearly correlated (R2 > 0.99) to the O2 concentration in the electrolyte (Figure 4b) from 2 s on. This linearity implies that a potential bias as short as 2 s would be sufficient to perform the O2 measurement. Short measurement time (combined with low bias potential) might prove necessary to minimize the measurement effect on cells that can be altered by electric fields, e.g., cardiomyocytes.23,24
Figure 4.
(a) CV (SR = 100 mV/s) recorded on RuOx electrode in PBS with different aeration. The gray arrows denote the scan direction. The inset plots the reductive current measured at −0.400 V normalized to the electrode’s geometric surface area against O2 concentration, which shows a highly linear correlation. The error bars show one standard deviation among four different electrodes. (b) Recorded current from chronoamperometry measurements recorded on RuOx electrode at −0.400 V in PBS with different aeration. The inset plots current at a different point in time normalized to the electrode’s geometric surface area against O2 concentration.
Similar CV measurements were also performed in CM-TDI medium (Figure S3). While a similar reductive current was observed, its onset occurred at a more negative potential of −0.450 V. This can be explained by the higher pH of the CM-TDI medium. Under atmospheric air, the pH of the said medium can reach up to 8.4. A potential shift of −50 mV could then be explained by this difference of up to 1 pH unit. The RuOx’s O2 sensitivity also showed a slight reduction when measuring in complex cell medium (−3.3 nA/(μM mm2) instead of −5.4 nA/(μM mm2) in PBS).
All in all, the RuOx electrode showed excellent O2 sensing characteristics that are suitable for cell metabolism studies. On top of minimizing the effect of the applied electric field on the cells, the shorter measurement time also leads to less O2 consumed during sensing. At 18.4% O2 concentration, 2 s of amperometry delivered 20 μC of charge. This is equivalent to 52 pmol of O2 being consumed during the measurement, leading to a decrease by ∼52 nM O2 concentration in the 900 μL medium. While it may seem negligible compared to the expected total O2 concentration in the cell medium (up to 200 μM6,25), the O2 measurement should not be performed too often to avoid significant depletion of the medium’s O2 compared to the metabolism of the cells under study.
Measurements with hPSC-CMs
As proof of concept, RuOx electrodes were used in experiments to capture the metabolism of cardiomyocytes. The hPSC-CMs, differentiated in high-glucose medium, were cultured in the medium with different glucose levels with the intention to obtain cultures with different types of metabolism. A colony of hPSC-CMs was cultured in the glucose-rich medium (leading to glycolytic hPSC-CMs), and the other was cultured in the low-glucose, galactose-rich medium (leading to hPSC-CMs with an oxidative metabolic phenotype).15 The glycolytic hPSC-CMs were expected to mainly perform glycolysis and produce lactate, acidifying its surroundings with little O2 consumption. The oxidative hPSC-CMs were expected to increase their oxidative phosphorylation activity, thus showing an increase in O2 consumption and a reduction in lactate release.
Figure S4 shows no significant difference in cell morphology between the two hPSC-CMs groups after 2 days of incubation in the different cell media. However, maturation and the ability of these hPSC-CMs to switch metabolisms have yet to be studied and confirmed by other means than visual observation. Therefore, in this study, the pH value was measured independently at the end of the experiment with a pH meter and the pH indicator (phenol red) color was documented to capture the real difference in acidification rate. Regrettably, no independent means was available to confirm the difference in O2 uptake. Therefore, no absolute O2 concentration can be determined. Instead, OCR was calculated from the change in O2 concentration, calculated from the respective RuOx sensor’s O2 calibration slope.
The metabolism study of hPSC-CMs was performed using two sensor chips in two different setups. A colony of hPSC-CMs was added to a setup with glucose-rich CM-TDI medium, and a colony was added to galactose-rich CM-TDI medium. The RuOx electrode was employed to study both O2 consumption rate and medium acidification. O2 concentration was measured every 9 ± 3 h, and the pH was continuously measured between O2 measurements. The results are presented and discussed separately below.
pH Sensing
The pH of the cell medium was measured continuously for around 6 h at a time and was only stopped for brief O2 measurements and microscopy check of the hPSC-CMs activity. Throughout the study, two different cell seeding densities (268 000 and 535 000 cells/cm2) were studied. It was found that only with higher cell densities a notable change in pH indicator color was observed at the end of day 2 (see Figures S6 and S7). For this reason, measurements of wells with higher seeding cell densities are reported and discussed below.
Measurement in Buffering Media
Figure 5a shows the calculated pH values, measured during day 2 of the experiment, of the two hPSC-CMs groups. It can be seen that apart from the initial slope, the pH of both groups stabilized and followed a similar trend. Every measurement was started after an optical check of the cells, performed outside of the incubator. The initial slope (the first ∼150 min) seemed to be heavily influenced by the change in temperature/air composition taking place during the optical check. This slope varied between the channels and from measurement to measurement. While there is possibly information regarding real acidification contained in these initial slopes, accurate interpretation is precarious. Therefore, acidification analyses were focused on the latter part of each measurement (at t > 150 min).
Figure 5.
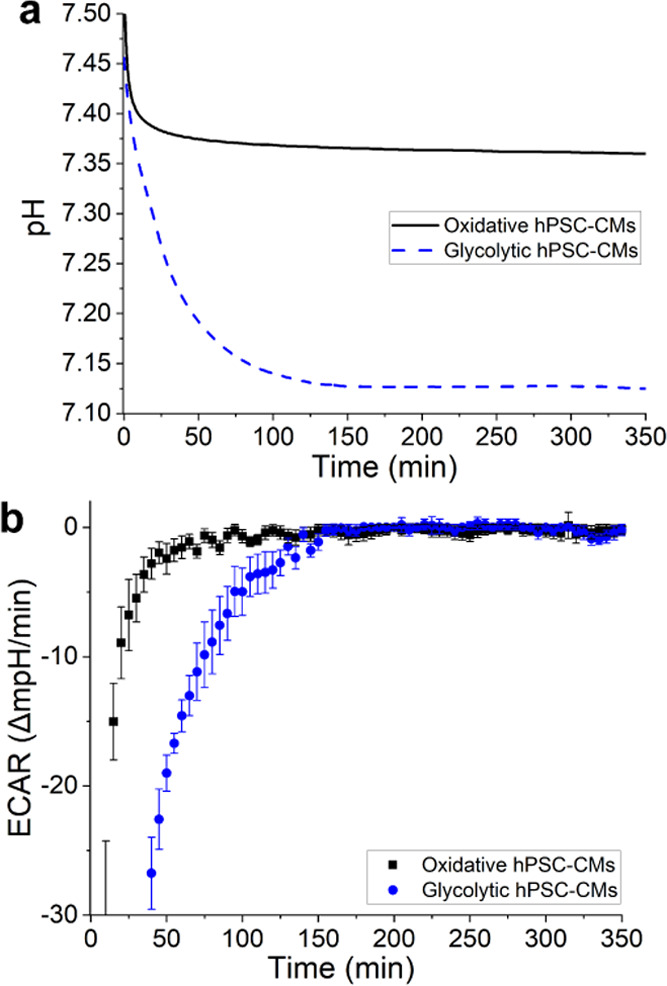
(a) Calculated pH change throughout day 2 in the presence of hPSC-CMs (535 000 cells/cm2) undergoing different metabolisms. (b) The same data calculated into ECAR of the different hPSC-CMs groups. The ECAR was calculated in 5 min interval; the error bars plot one standard deviation of the 5 min measurement window.
When the pH change is plotted over time (Figure 5b), it is apparent that barely any change was picked up by either sensor after 150 min. Nonetheless, a slight but discernible pH change was apparent from the measurement using the pH meter as well as the color of pH indicator (Figure S7). This suggests that while the extracellular acidification took place at different rates in the two groups, the difference was too small for the sensors to pick up. The slight difference in open-circuit potential measured over time could have been obscured by the sensor’s drift or other parameter changes (e.g., temperature drift). Given that the resulting media pH change is an interplay between the released protons from the cell metabolism and the number of protons taken up by the pH buffer (in this case, the carbonate buffer), the pH change rate can be exaggerated by lowering the buffering capacity of the media.
Measurement in Low-Buffering Media
While it is common practice to perform ECAR measurement in low- or non-buffering cell media,7,15 a fair comparison of ECARs among reported works is hard to achieve. First, the different works used different (variations of) media with different buffering capacities that are often not specified. Furthermore, ECAR measurements are often performed under atmospheric air for a shorter period (up to 150 min).7 Since our study took 48 h, it was critical to preserve the viability of the cells for this period by retaining some of the buffering bicarbonate in the media. After some experimentations, half of the original buffering capacity (∼3.5 mmol/L) was found to be the minimum capacity to keep the cells viable and active for 48 h. Since there are no reports on ECARs of hPSC-CMs measured using comparable media to our knowledge, the results are discussed only in comparison to other results in this study.
Overall, the calculated pH change in this low-buffering media (Figure 6a) showed a more significant difference between the two groups than that in Figure 5a. This implies more prominent acidification, which is also confirmed by the measured final pH as well as the color of the pH indicator (Figure S8). However, the calculated ECARs themselves (Figure 6b) showed a dissimilarity only for a part of the measured period (60 min < t < 220 min). For around 3 h of the 6 h measurement, the ECARs of the glycolytic cells showed significantly lower values, indicating a faster acidification rate, before leveling off back to the same values as the oxidative group. While these results might be convincing together with the calculated pH values and the visual confirmation, on its own, such results are not conclusive. Different measurements often showed that the calculated ECARs of the two groups only differed significantly from each other for a fraction of the measurement time, even in low-buffering media. This outcome could be explained by the findings of Mookerjee et al.9 in studying contributions of the different cell metabolisms in proton production. The study showed that oxidative respiration could result in proton release up to the same order as that released from glycolysis. Therefore, without prior knowledge of the cells’ metabolism makeup in the different substrates, it would be unreliable to quantify cells’ metabolism rate (glycolytic rate as well as respiration rate) from ECAR data alone.
Figure 6.
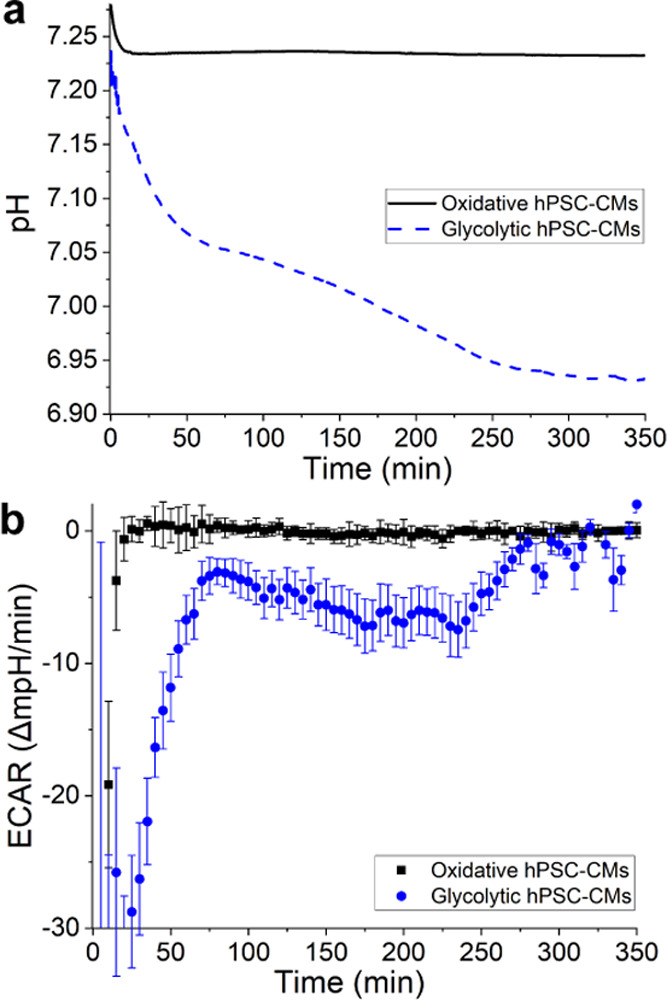
(a) pH change throughout day 2 in the presence of hPSC-CMs (535 000 cells/cm2) in low-buffering CM-TDI medium. (b) Calculated ECARs of the hPSC-CMs. The ECARs were calculated in 5 min interval; the error bars plot one standard deviation of the 5 min measurement.
O2 Sensing
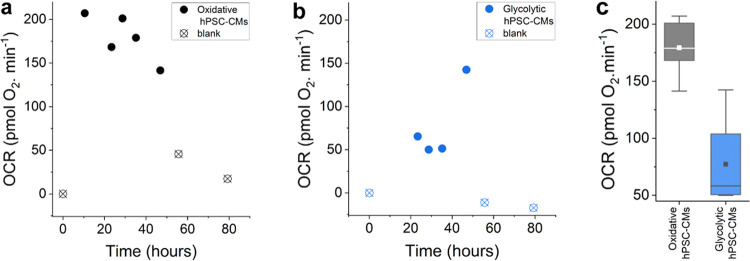
The chronoamperometry currents measured in the presence of the oxidative hPSC-CMs showed more significant deviation from its blank, compared to the measurements of the glycolytic hPSC-CMs. From these currents, the OCRs of the two different cell colonies were calculated (Figure 7a,b). Taking into account the setup geometry, it was expected that O2 diffusion (coming mostly from the top opening) was sufficient to replenish the O2 concentration in the medium around the cells. It was calculated that the O2 flux at the bottom of a medium column of height 2 mm under typical incubator condition26 is still higher than the expected OCR of cardiomyocytes14,25 at our cell density. In our study, the 200 μL CM-TDI medium formed an ∼1.7 mm high column on top of our cells. Assuming the OCR stays constant, the system can be expected to reach some form of equilibrium. Therefore, each measurement point can be regarded as an independent measurement point, where the change in O2 concentration (with respect to the blank measurement) reflects the cells’ OCR at the given point in time.
Figure 7.
OCRs of hPSC-CMs (535 000 cells/cm2) calculated from O2 measurements (a) in galactose-rich medium and (b) in glucose-rich medium. Solid points (●) show OCRs calculated from measurements in the presence of hPSC-CMs, and the blanks (⊗) in empty setups. (c) Overall, the OCRs of the two different hPSC-CMs groups are significantly different from each other, with the average OCR of the oxidative hPSC-CMs being 2.3 times higher than that of the glycolytic hPSC-CMs. The boxplots whiskers show the ranges within 1.5 of the interquartile range; the lines inside the box denote the medians, and the solid boxes (■) inside the boxplots denote the means of the OCR values.
The calculated OCR values (Figure 7c) show that the oxidative hPSC-CMs significantly took up more O2 than their glycolytic counterpart. Over the tested 48 h, the glycolytic hPSC-CMs took up 77.3 pmol of O2 per minute on average and the oxidative 179.3 pmol of O2 per minute. When normalized to the seeding density, the glycolytic hPSC-CMs were calculated to consume 2.1 ± 1.2 amol O2/(cell s), which was less than half of that of the oxidative hPSC-CMs (4.8 ± 0.7 amol O2/(cell s)). Figure 7a also shows a trend of decreasing OCR of the oxidative hPSC-CMs. This can be correlated with the observed reduced hPSC-CMs’ activity observed visually at the end of the 48 h experiment. The hPSC-CMs activity usually increased again once the cell media was refreshed, implying that cell waste buildup or depletion of cell nutrients might cause this gradual reduction in activity.
A similar explanation might apply to the measurement at t = 48 h of the glycolytic cell group (Figure 7b). The measured O2 concentration showed an apparent decrease in O2 concentration at that point, suggesting an unexpected increase in the cells’ OCR. A depleted glucose level (together with cell stress) after 2 days of incubation can theoretically cause a switch in metabolism. The O2 levels in the empty setups were still sampled after the hPSC-CMs were removed. The measured O2 levels recovered relatively close to that of the initial blank level.
This observation implied that the RuOx sensors were still operating as expected; nonetheless, further studies on the experiments’ reproducibility and repeatability are necessary. The calculated OCR values are also about 10-fold lower than other reports of hPSC-CMs’ OCRs.14 Since cell counts and viability were not monitored/quantified throughout the experiment, further studies are also necessary to confirm the OCR trend as well as its cell-normalized value.
Overall, this experiment showcased the potential usage of the RuOx electrode as an O2 sensor in a study of cell metabolism. We show that the RuOx electrode can be used to compare the OCRs of two cell colonies in identical setups. Together with the cells’ ECARs, captured from monitoring the pH of the cell media, the data recorded using the RuOx electrode can be used to infer the cell colony’s main metabolism.
Conclusions
In this work, we present an on-chip RuOx electrode, capable of performing both pH and O2 sensing. The techniques and considerations in applying said electrode to study cell metabolism are also presented. We showed OCRs and ECARs calculated from data collected using the RuOx electrode over 48 h of two hPSC-CM colonies in different substrates. The hPSC-CM colony cultured in glucose-rich medium showed higher ECARs compared to that of the hPSC-CM colony cultured in galactose-rich medium. The opposite applied to the OCRs, hPSC-CM colony cultured in glucose-rich medium showed lower OCRs than that of the hPSC-CM colony cultured in galactose-rich medium. Observations of both parameters implied that the hPSC-CMs cultured in glucose-rich medium underwent mainly glycolysis and those cultured in a low glucose concentration underwent mainly oxidative phosphorylation.
At the current sensor size, the amperometric O2 sensing should not be performed more frequently than once every hour. Considering the lowest OCRs we measured, performing the amperometric O2 sensing once every hour would contribute to as much as 1% of the cells’ OCR. The miniaturization of the electrode would enable better time resolution of the O2 sampling. Smaller volumes would also result in stronger and quicker medium acidification. Nonetheless, we have shown that the RuOx electrode can be used for cell metabolism study even in its current format. Considering its low cost and robust quality, the electrode can serve as a versatile and powerful tool in in vitro cell metabolism studies, especially in comparative settings.
Acknowledgments
The authors thank Elsbeth Bossink and Mathieu Odijk for their valuable scientific input in O2 sensing. They also thank Casper Maas for his research into buffers in cell media. The authors are also deeply grateful to Johan Bomer for his technical input and assistance in instrumentations, to Hans de Boer for his work in the fabrication of chip holder, and to Simone ten Den for assistance in and discussions regarding the cells.
Supporting Information Available
The Supporting Information is available free of charge at https://pubs.acs.org/doi/10.1021/acssensors.0c02282.
pH response of bare Pt (Figure S1); Cl– sensitivity of AgCl electrode (Figure S2); O2 sensing calibration in CM-TDI medium (Figure S3); microscopy images of hPSC-CMs (Figure S4); calculated ECAR from blank pH measurement (Figure S5); images at the end of ECAR measurement, in buffering cell medium (Figures S6 and S7); image at the end of ECAR measurement, in low-buffering cell medium (Figure S8); and pH calibration summary in CM-TDI medium (Table S1) (PDF)
This research was funded by the European Research Council (ERC) under the European Union’s Horizon 2020 research and innovation programme (grant agreement no. 669768, VESCEL project).
The authors declare no competing financial interest.
Supplementary Material
References
- Malinski T.; Taha Z. Nitric Oxide Release from a Single Cell Measured in Situ by a Porphyrinic-Based Microsensor. Nature 1992, 358, 676–678. 10.1038/358676a0. [DOI] [PubMed] [Google Scholar]
- Cuomo A. S. E.; Seaton D. D.; McCarthy D. J.; Martinez I.; Bonder M. J.; Garcia-Bernardo J.; Amatya S.; Madrigal P.; Isaacson A.; Buettner F.; et al. Single-Cell RNA-Sequencing of Differentiating IPS Cells Reveals Dynamic Genetic Effects on Gene Expression. Nat. Commun. 2020, 11, 810 10.1038/s41467-020-14457-z. [DOI] [PMC free article] [PubMed] [Google Scholar]
- Shiku H. Electrochemical Biosensing System for Single Cells, Cellular Aggregates and Microenvironments. Anal. Sci. 2019, 35, 29–38. 10.2116/analsci.18SDR01. [DOI] [PubMed] [Google Scholar]
- Sung J. H.; Wang Y. I.; Narasimhan Sriram N.; Jackson M.; Long C.; Hickman J. J.; Shuler M. L. Recent Advances in Body-on-a-Chip Systems. Anal. Chem. 2019, 91, 330–351. 10.1021/acs.analchem.8b05293. [DOI] [PMC free article] [PubMed] [Google Scholar]
- van der Meer A. D.; van den Berg A. Organs-on-Chips: Breaking the in Vitro Impasse. Integr. Biol. 2012, 4, 461–470. 10.1039/c2ib00176d. [DOI] [PubMed] [Google Scholar]
- Kieninger J.; Weltin A.; Flamm H.; Urban G. A. Microsensor Systems for Cell Metabolism-from 2D Culture to Organ-on-Chip. Lab Chip 2018, 18, 1274–1291. 10.1039/C7LC00942A. [DOI] [PubMed] [Google Scholar]
- Brischwein M.; Wiest J.. Microphysiometry. In Label-Free Monitoring of Cells Invitro;Wegener J. Eds.; Springer International Publishing, 2019; Vol. 2, pp 163–188. [Google Scholar]
- Wu M.; Neilson A.; Swift A. L.; Moran R.; Tamagnine J.; Parslow D.; Armistead S.; Lemire K.; Orrell J.; Teich J.; et al. Multiparameter Metabolic Analysis Reveals a Close Link between Attenuated Mitochondrial Bioenergetic Function and Enhanced Glycolysis Dependency in Human Tumor Cells. Am. J. Physiol.: Cell Physiol. 2007, 292, C125–C136. 10.1152/ajpcell.00247.2006. [DOI] [PubMed] [Google Scholar]
- Mookerjee S. A.; Goncalves R. L. S.; Gerencser A. A.; Nicholls D. G.; Brand M. D. The Contributions of Respiration and Glycolysis to Extracellular Acid Production. Biochim. Biophys. Acta, Bioenerg. 2015, 1847, 171–181. 10.1016/j.bbabio.2014.10.005. [DOI] [PubMed] [Google Scholar]
- Malandraki-Miller S.; Lopez C. A.; Al-Siddiqi H.; Carr C. A. Changing Metabolism in Differentiating Cardiac Progenitor Cells—Can Stem Cells Become Metabolically Flexible Cardiomyocytes?. Front. Cardiovasc. Med. 2018, 5, 119 10.3389/fcvm.2018.00119. [DOI] [PMC free article] [PubMed] [Google Scholar]
- Jang D. H.; Greenwood J. C.; Spyres M. B.; Eckmann D. M. Measurement of Mitochondrial Respiration and Motility in Acute Care. J. Intensive Care Med. 2017, 32, 86–94. 10.1177/0885066616658449. [DOI] [PMC free article] [PubMed] [Google Scholar]
- Ulmer B. M.; Stoehr A.; Schulze M. L.; Patel S.; Gucek M.; Mannhardt I.; Funcke S.; Murphy E.; Eschenhagen T.; Hansen A. Contractile Work Contributes to Maturation of Energy Metabolism in HiPSC-Derived Cardiomyocytes. Stem Cell Rep. 2018, 10, 834–847. 10.1016/j.stemcr.2018.01.039. [DOI] [PMC free article] [PubMed] [Google Scholar]
- Denning C.; Borgdorff V.; Crutchley J.; Firth K. S. A.; George V.; Kalra S.; Kondrashov A.; Hoang M. D.; Mosqueira D.; Patel A.; et al. Cardiomyocytes from Human Pluripotent Stem Cells: From Laboratory Curiosity to Industrial Biomedical Platform. Biochim. Biophys. Acta, Mol. Cell Res. 2016, 1863, 1728–1748. 10.1016/j.bbamcr.2015.10.014. [DOI] [PMC free article] [PubMed] [Google Scholar]
- Yang X.; Rodriguez M. L.; Leonard A.; Sun L.; Fischer K. A.; Wang Y.; Ritterhoff J.; Zhao L.; Kolwicz S. C.; Pabon L.; et al. Fatty Acids Enhance the Maturation of Cardiomyocytes Derived from Human Pluripotent Stem Cells. Stem Cell Rep. 2019, 13, 657–668. 10.1016/j.stemcr.2019.08.013. [DOI] [PMC free article] [PubMed] [Google Scholar]
- Rana P.; Anson B.; Engle S.; Will Y. Characterization of Human-Induced Pluripotent Stem Cell–Derived Cardiomyocytes: Bioenergetics and Utilization in Safety Screening. Toxicol. Sci. 2012, 130, 117–131. 10.1093/toxsci/kfs233. [DOI] [PubMed] [Google Scholar]
- Tanumihardja E.; Olthuis W.; van den Berg A. Ruthenium Oxide Nanorods as Potentiometric PH Sensor for Organs-On-Chip Purposes. Sensors 2018, 18, 2901 10.3390/s18092901. [DOI] [PMC free article] [PubMed] [Google Scholar]
- Lehmann M.; Baumann W.; Brischwein M.; Gahle H.-J.; Freund I.; Ehret R.; Drechsler S.; Palzer H.; Kleintges M.; Sieben U.; et al. Simultaneous Measurement of Cellular Respiration and Acidification with a Single CMOS ISFET. Biosens. Bioelectron. 2001, 16, 195–203. 10.1016/S0956-5663(01)00123-3. [DOI] [PubMed] [Google Scholar]
- Chen Z. G.; Pei F.; Pei Y. T.; De Hosson J. T. M. A Versatile Route for the Synthesis of Single Crystalline Oxide Nanorods: Growth Behavior and Field Emission Characteristics. Cryst. Growth Des. 2010, 10, 2585–2590. 10.1021/cg901558n. [DOI] [Google Scholar]
- Ribeiro M. C.; Slaats R. H.; Schwach V.; Rivera-Arbelaez J. M.; Tertoolen L. G. J.; van Meer B. J.; Molenaar R.; Mummery C. L.; Claessens M. M. A. E.; Passier R. A Cardiomyocyte Show of Force: A Fluorescent Alpha-Actinin Reporter Line Sheds Light on Human Cardiomyocyte Contractility versus Substrate Stiffness. J. Mol. Cell. Cardiol. 2020, 141, 54–64. 10.1016/j.yjmcc.2020.03.008. [DOI] [PubMed] [Google Scholar]
- Birket M. J.; Ribeiro M. C.; Kosmidis G.; Ward D.; Leitoguinho A. R.; van de Pol V.; Dambrot C.; Devalla H. D.; Davis R. P.; Mastroberardino P. G.; et al. Contractile Defect Caused by Mutation in MYBPC3 Revealed under Conditions Optimized for Human PSC-Cardiomyocyte Function. Cell Rep. 2015, 13, 733–745. 10.1016/j.celrep.2015.09.025. [DOI] [PMC free article] [PubMed] [Google Scholar]
- Ng E. S.; Davis R.; Stanley E. G.; Elefanty A. G. A Protocol Describing the Use of a Recombinant Protein-Based, Animal Product-Free Medium (APEL) for Human Embryonic Stem Cell Differentiation as Spin Embryoid Bodies. Nat. Protoc. 2008, 3, 768–776. 10.1038/nprot.2008.42. [DOI] [PubMed] [Google Scholar]
- Si F.; Zhang Y.; Yan L.; Zhu J.; Xiao M.; Liu C.; Xing W.; Zhang J.. Electrochemical Oxygen Reduction Reaction. In Rotating Electrode Methods and Oxygen Reduction Electrocatalysts; Elsevier, 2014, pp 133–170. [Google Scholar]
- Xia Y.; Buja L. M.; Scarpulla R. C.; McMillin J. B. Electrical Stimulation of Neonatal Cardiomyocytes Results in the Sequential Activation of Nuclear Genes Governing Mitochondrial Proliferation and Differentiation. Proc. Natl. Acad. Sci. U.S.A. 1997, 94, 11399–11404. 10.1073/pnas.94.21.11399. [DOI] [PMC free article] [PubMed] [Google Scholar]
- Tandon N.; Cannizzaro C.; Chao P. H. G.; Maidhof R.; Marsano A.; Au H. T. H.; Radisic M.; Vunjak-Novakovic G. Electrical Stimulation Systems for Cardiac Tissue Engineering. Nat. Protoc. 2009, 4, 155–173. 10.1038/nprot.2008.183. [DOI] [PMC free article] [PubMed] [Google Scholar]
- Wagner B. A.; Venkataraman S.; Buettner G. R. The Rate of Oxygen Utilization by Cells. Free Radical Biol. Med. 2011, 51, 700–712. 10.1016/j.freeradbiomed.2011.05.024. [DOI] [PMC free article] [PubMed] [Google Scholar]
- Place T. L.; Domann F. E.; Case A. J. Limitations of Oxygen Delivery to Cells in Culture: An Underappreciated Problem in Basic and Translational Research. Free Radical Biol. Med. 2017, 113, 311–322. 10.1016/j.freeradbiomed.2017.10.003. [DOI] [PMC free article] [PubMed] [Google Scholar]
Associated Data
This section collects any data citations, data availability statements, or supplementary materials included in this article.


