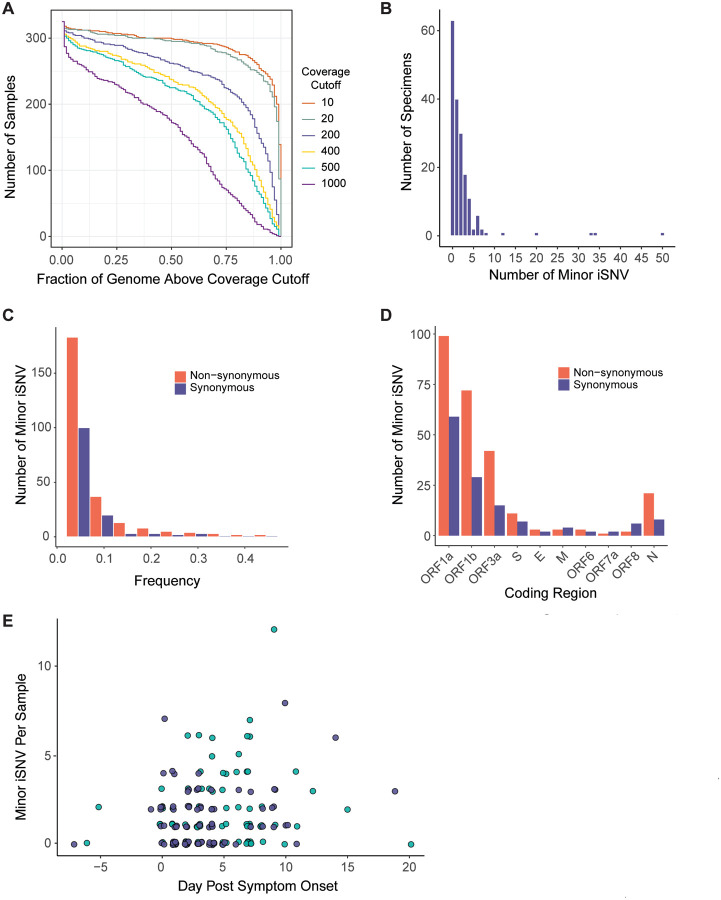
Figure 3.
SARS-CoV-2 intrahost single nucleotide variant (iSNV) diversity. (A) Sequencing coverage for clinical samples. The number of clinical samples (y-axis) is shown by the fraction of the genome above a given read depth threshold (x-axis). The different lines show the data evaluated with six read depth thresholds. (B) Histogram of the number of specimens (y-axis) by the number of minor iSNV per sample (x-axis), n = 178. (C) Number of minor iSNV by frequency with a bin width of 0.05. Non-synonymous iSNV are shown in orange and synonymous iSNV are shown in violet. (D) Number of minor iSNV by coding region. Non-synonymous iSNV are shown in orange and synonymous iSNV are shown in violet. (E) Scatterplot of the number of minor iSNV per sample (y-axis) by the day post symptom onset (x-axis). Hospitalized patients are shown in teal and employees shown in violet. The four samples with > 15 iSNV shown in (B) are excluded from the plot for visualization.

