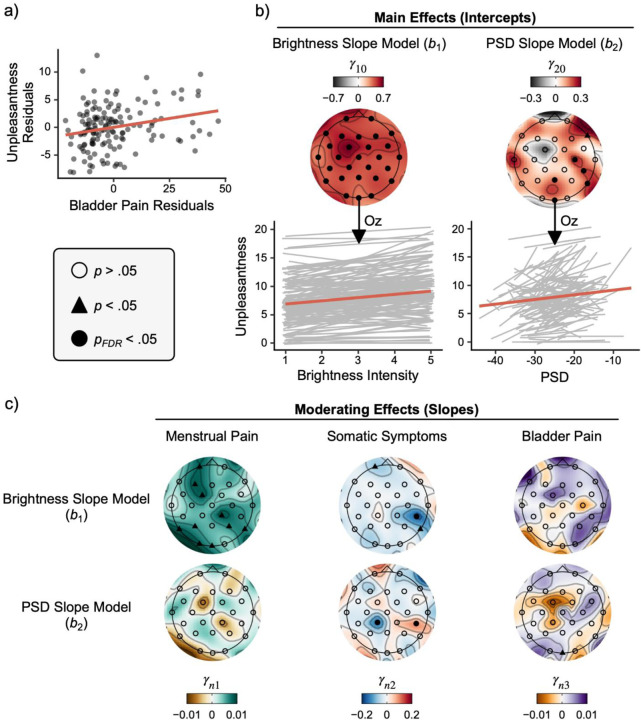
Figure 4. The relationships between visual unpleasantness and brightness intensity/cortical excitation were moderated by menstrual pain, somatic symptoms and bladder pain.
a) Partial regression scatter plots depict the positive relationship between bladder pain and participants’ mean unpleasantness ratings averaged across brightness intensities accounting for menstrual pain and somatic symptoms. b) Topographic plots of regression slopes testing the intercepts from the brightness and PSD models. Oz was our a priori electrode of interest. Raw (grey) and averaged (red) slopes across all participants plotted below demonstrate that increases in brightness intensity and 25Hz PSD resulted in concomitant increases in participant unpleasantness ratings when accounting for one another. c) Scalp topographies of moderating slopes from second level multilevel modeling results. Given that positive relationships were observed between unpleasantness ratings and brightness/PSD in b, positive slopes here depict an increasing positive relationship between moderating variables, while negative slopes depict an increasing negative relationship. Menstrual pain ratings moderated the positive relationship between unpleasantness ratings and brightness, but not 25 Hz PSD at Oz (a priori chosen) and several other exploratory electrode sites. Somatic symptoms did not moderate these relationships at Oz; however, somatic symptoms moderated brightness and PSD slopes at a right posterior site (CP6; pFDR < .05 corrected), despite conflicting directions of moderation. In contrast, bladder pain moderated the positive relationship between unpleasantness and PSD, but not brightness. Level two regression parameter notation n denotes both the brightness (n=1) and PSD (n=2) slope models. PSD = power spectral density; FDR = false discovery rate.

