Abstract
LILRB4 is expressed on AML M4/M5 cells and negatively regulates immune cell activation via T cell suppression. Its expression and role in CMML and MDS are unknown. We investigated LILRB4 expression in 19 CMML and 27 MDS patients and correlated it with response to subsequent HMA therapy. LILRB4 RNA expression was increased in CMML patients when compared to MDS patients and healthy controls (q<0.1) and slightly increased in patients who responded to HMAs (q>0.1). Pathway analysis revealed upregulation of PD-1 signaling, CTLA-4 signaling, and inflammatory response, and gene correlates were positively associated with CTLA-4 expression. Given current modest results with immunotherapy in myeloid malignancies, further investigation of LILRB4 as an immune checkpoint inhibitor target is needed. With the positive correlation between LILRB4 and CTLA-4 expression, combining anti-LILRB4 and anti-CTLA-4 agents may be a novel therapeutic approach in myeloid malignancies that warrants larger studies.
Keywords: myelodysplastic syndromes, chronic myelomonocytic leukemia, LILRB4, hypomethylating agents
Introduction
The leukocyte immunoglobulin-like receptor subfamily B (LILRB) is a group of transmembrane glycoproteins that bind extracellular ligands and intracellular immunoreceptor tyrosine-based inhibitor motifs (ITIMs). Interaction of LILRBs with ligands, such as human leukocyte antigen G (HLA-G), has been proposed to serve as immune checkpoints, with the ability to act on a larger variety of immune cell types than the standard immune checkpoint proteins programmed cell death protein 1 (PD-1), its ligand programmed death-ligand 1 (PD-L1), and cytotoxic T-lymphocyte-associated protein 4 (CTLA-4)1. LILRB stimulation by HLA-G inhibits immune activation, thus indirectly promoting tumor development.
Expression of LILRB4, also known as immunoglobulin-like transcript 3 (ILT3), has been reported on dendritic cells, monocytes, macrophages, progenitor mast cells, endothelial cells, and osteoclasts2. Both membrane-bound and soluble LILRB4 were found to mediate cancer cell escape from immune suppression by the induction of CD8+ T suppressor cell differentiation and impairment of T cell responses in humanized mouse experiments3 and the inhibition of T cell proliferation in mixed leukocyte cultures4. In patients with non-small cell lung cancer, LILRB4 expression was discovered on myeloid-derived suppressor cells (MDSCs), and increased LILRB4 expression and circulating MDSCs were associated with shorter survival times5.
LILRB4 is also expressed on all M4 and M5 monocytic/monoblastic acute myeloid leukemia (AML) cells, with frequent co-expression with immature cell markers, such as CD34 and CD1176. Recently, a group of researchers discovered that LILRB4 expression negatively correlated with survival of patients with AML, and LILRB4 expression by AML cells suppressed T cells, with LILRB4 inhibition decreasing leukemic infiltration into internal organs7. However, its expression and role in chronic myelomonocytic leukemia (CMML) and myelodysplastic syndrome (MDS) are unknown. We consequently investigated LILRB4 expression in patients with CMML and MDS and correlated it with response to hypomethylating agent (HMA) therapy.
Methods
Patients and Samples
We evaluated bone marrow (BM) samples from previously-untreated patients with CMML or MDS who were assessed at the University of Texas MD Anderson Cancer Center (MDACC) between 2008 to 2014. Informed consent was obtained according to protocols approved by the MDACC institutional review board in accordance with the Declaration of Helsinki. Diagnosis was confirmed by BM exam using the revised 2016 World Health Organization (WHO) criteria8 in the hematopathology laboratory at MDACC. CMML patients were classified using the 2016 WHO criteria, and MDS patients were risk-stratified by the International Prognostic Scoring System (IPSS)9. Response was assessed by the International Working Group 2006 criteria10.
Six cell lines (HL60, MDS-L, MOLM13, SKM1, TF1, and U937) were evaluated for LILRB4 expression. We obtained HMA-sensitive HL60 and U937 from the American Type Culture Collection (ATCC, Manassas, VA), both HMA-sensitive and HMA-resistant MOLM13 and SKM1 from FUJIFILM Healthcare Laboratory Co. (Tokyo, Japan), and HMA-sensitive MDS-L and TF1 as a gift from Dr. D. Starczynowski. For the establishment of HMA-resistant HL60, MDS-L, TF1, and U937, we cultured cells in RPMI 1640 medium supplemented with 10% fetal bovine serum (MilliporeSigma, St. Louis, MO) with the addition of 10 ng/mL IL-3 (Stemcell Technologies, Vancouver, Canada) to MDS-L and TF1 cultures. Cells were maintained at 37°C and 5% CO2. To enrich for HMA-resistant cells, cell cultures were continuously treated with increasing concentrations of decitabine from 1 to 10 nM with response measured by trypan blue cell counting dependent viability assays. The decitabine-resistant cell line was developed when the IC50 of decitabine was 3 times that of the parental HMA-sensitive cell line. DNA fingerprinting by short tandem repeat analysis was performed in both the HMA-sensitive and HMA-resistant cell lines to ensure that the newly-developed HMA-resistant line was not contaminated. The HMA-resistant cell lines were maintained in the same supplemented RPMI 1640 medium with the addition of 10 nM decitabine.
Isolation of BM CD34+ Cells
BM aspirates were obtained from CMML and MDS patients referred to the Department of Leukemia at MDACC under approved protocols. BM samples from healthy individuals were obtained from AllCells (Emeryville, CA). CD34+ cells were isolated using the CD34 MicroBead Kit (Miltenyi Biotec, Bergisch Gladback, Germany).
RNA-Sequencing (RNA-Seq) Analysis
RNA from sorted BM CD34+ cells and cell lines from hematologic malignancies (n=6) was isolated using TRIzol Reagent (Thermo Fisher Scientific, Walthan, MA) before RNA amplification and RNA-Seq library construction. Fastq files were mapped to the human genome (build GRCh38) in tophat2 using the default options11. Differential gene expression analysis was conducted using DESeq2 in R version 3.4.212. The Wald test in DESeq2 was used for all comparisons except for the comparison between IPSS risk groups: for this one, the likelihood ratio test was used to test whether there is any difference in expression among all risk groups. Gene expression was normalized for plotting using the variance-stabilizing transformation implemented in the DESeq2 package. Gene co-expression was evaluated using Spearman correlation. Pathway enrichment analysis was performed using gene set enrichment analysis, with the fgsea library in R and the hallmark and canonical pathways databases from MSigDB13. Genes were ranked according to their Spearman correlation with the gene of interest, and this ranking was used as the input to fgsea. 10,000 gene permutations were used to calculate statistical significance, and a false discovery corrected p-value (i.e. the q-value) of 0.05 was required for statistical significance of a gene set.
Baseline patient characteristics were compared between CMML and MDS patients using Fisher’s exact test for data with 2 categories, the chi-squared test for multi-category data, or a two-sample t test to compare continuous variables.
Results
Patients
Forty-six untreated patients with CMML (n=19) and MDS (n=27) were included in this analysis. Baseline patient characteristics are shown in Table 1. By the WHO 2016 sub-classification for CMML, there were 8 CMML-0, 5 CMML-1, and 6 CMML-2 patients, and MDS patients were comprised of 1 MDS with ringed sideroblasts (MDS-RS), 2 MDS with multilineage dysplasia (MDS-MLD), 1 MDS with isolated del(5q), 20 MDS with excess blasts (MDS-EB), and 3 unclassified MDS (MDS-U). Risk stratification by IPSS performed for both CMML and MDS patients for the basis of comparison is also included in Table 1.
Table 1.
Patient Characteristics at Baseline.
| CMML (n=19) | MDS (n=27) | p | |
|---|---|---|---|
| Gender | |||
| Male | 14 (73.7%) | 18 (66.7%) | 0.74 |
| Female | 5 (26.3%) | 9 (33.3%) | |
| Median Age (Range) [years] | 73 (47–87) | 68 (42–87) | 0.27 |
| Median Laboratory Values | |||
| White Blood Cell (Range) [x109/L] | 11.3 (2.1–67) | 2.2 (0.6–11.5) | 0.001 |
| Hemoglobin (Range) [g/dL] | 10.8 (5.3–13.3) | 10.1 (7.6–14.6) | 0.25 |
| Platelets (Range) [x109/L] | 96 (17–201) | 62 (11–331) | 0.76 |
| Peripheral Myeloid Blast Percentage (Range) | 0 (0–17) | 0 (0–15) | 0.56 |
| Bone Marrow Blast Percentage (Range) | 5 (1–17) | 8 (1–18) | 0.12 |
| Cytogenetics | |||
| Diploid | 13 (68.4%) | 10 (37.0%) | 0.078 |
| −5/5q | 1 (5.3%) | 9 (33.3%) | |
| −7/7q | 0 | 8 (29.6%) | |
| −20q | 0 | 1 (3.7%) | |
| -Y | 0 | 1 (3.7%) | |
| Complex | 1 (5.3%) | 11 (40.7%) | 0.008 |
| Mutations [n/number tested] | |||
| ASXL1 | 6/19 (31.6%) | 2/16 (12.5%) | 0.24 |
| DNMT3A | 0/19 | 3/16 (18.8%) | 0.086 |
| IDH1/2 | 0/19 | 1/16 (6.3%) | 0.46 |
| NRAS | 4/19 (21.1%) | 0/16 | 0.11 |
| RUNX1 | 1/19 (5.3%) | 5/16 (31.3%) | 0.073 |
| SRSF2 | 6/19 (31.6%) | 2/16 (12.5%) | 0.24 |
| TET2 | 11/19 (57.9%) | 3/16 (18.8%) | 0.036 |
| TP53 | 2/19 (10.5%) | 5/16 (31.3%) | 0.21 |
| IPSS | |||
| Low-Risk | 9 (46.4%) | 2 (7.4%) | 0.008 |
| Intermediate-1-Risk | 4 (21.1%) | 8 (29.6%) | |
| Intermediate-2-Risk | 6 (31.6%) | 12 (44.4%) | |
| High-Risk | 0 | 5 (26.3%) |
A total of 12 CMML patients and all 27 MDS patients received HMA therapy. The treatment summary and response to HMAs are detailed in Table 2.
Table 2.
Hypomethylating Agent Therapy and Response.
| CMML (n=12) | MDS (n=27) | p | |
|---|---|---|---|
| Hypomethylating Agent | |||
| Single-Agent Azacitidine | 4 (33.3%) | 13 (48.1%) | 0.091 |
| Single-Agent Decitabine | 5 (41.7%) | 3 (11.1%) | |
| Azacitidine in Combination | 2 (16.7%) | 10 (37.0%) | |
| Decitabine in Combination | 1 (6.3%) | 0 | |
| Other | 0 | 1 (3.7%) | |
| Response | |||
| Complete Remission (CR) | 3 (25.0%) | 11 (40.7%) | 0.12 |
| Marrow CR (mCR) | 2 (16.7%) | 0 | |
| Hematological Improvement (HI) | 1 (6.3%) | 5 (18.5%) | |
| Overall Response Rate (ORR) | 6 (50.0%) | 16 (59.3%) | 0.73 |
LILRB4 Expression
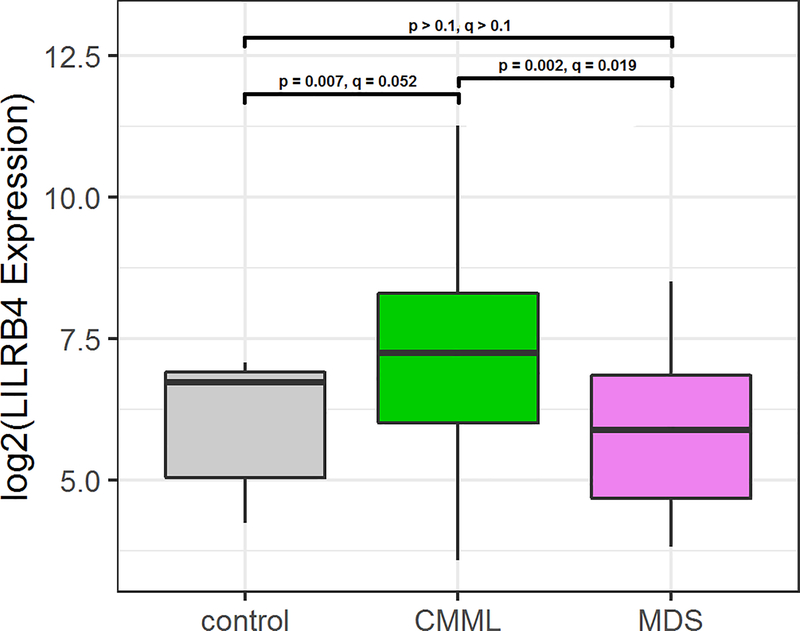
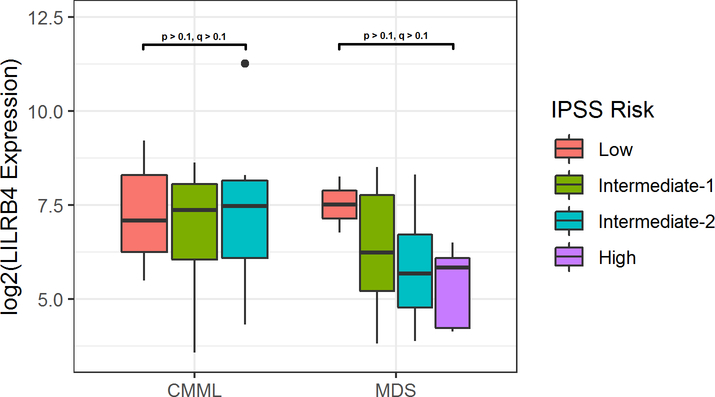
RNA expression of LILRB4 was increased in CMML patients when compared to MDS patients and healthy controls (q < 0.1, p < 0.01), as shown in Figure 1. No statistically significant differences were observed in LILRB4 expression based on risk groups, although MDS patients showed a trend of decreased expression with increased risk (Figure 2). No differences in expression based on monocyte differential percentage or mutational data were observed.
Figure 1.
LILRB4 Expression in Healthy Controls, Untreated CMML Patients, and Untreated MDS Patients.
Figure 2.
LILRB4 Expression in CMML and MDS Patients Based on IPSS Risk Group.
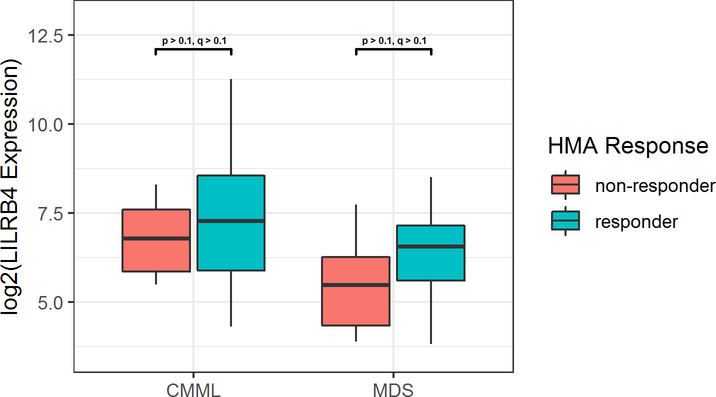
Figure 3 illustrates RNA expression of LILRB4 based on response to HMA treatment. In both patients with CMML or MDS, LILRB4 expression was slightly increased in HMA responders prior to therapy compared to HMA non-responders, though not statistically significant (q > 0.1). No change in patient LILRB4 RNA expression was detected in pre- and post-HMA therapy samples.
Figure 3.
LILRB4 Expression in CMML and MDS Patients Based on Subsequent Response to HMA Therapy.
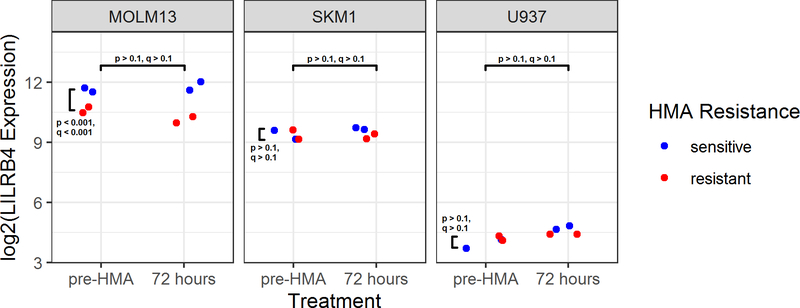
In Figure 4, LILRB4 RNA expression in MDS/AML cell lines is depicted. LILRB4 was expressed in MOLM13, SKM1, and U937 with no detection of LILRB4 RNA in HL60, MDS-L, or TF-1. When comparing response to HMAs, LILRB4 expression is increased in HMA-sensitive MOLM13 when compared to HMA-resistant MOLM13 (q < 0.01), but no significant change in expression was detected in SKM1 and U937.
Figure 4.
LILRB4 Expression in Cell Lines.
Pathway Analysis
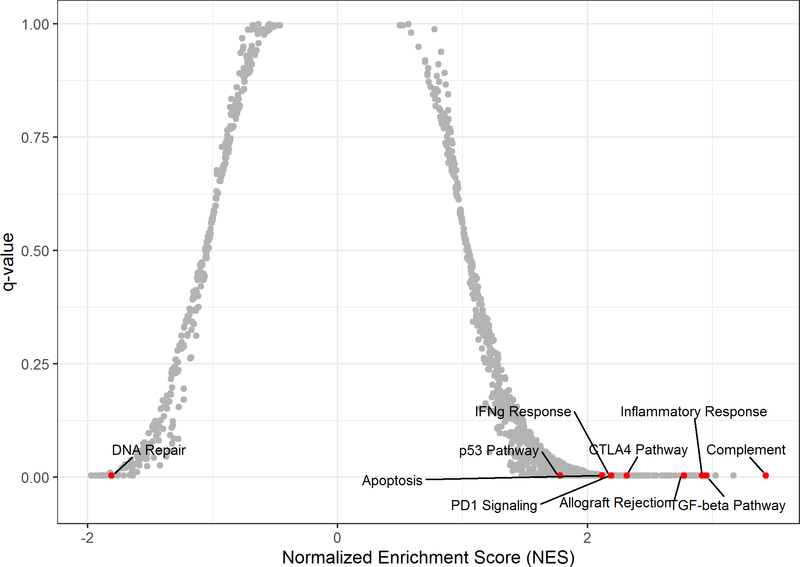
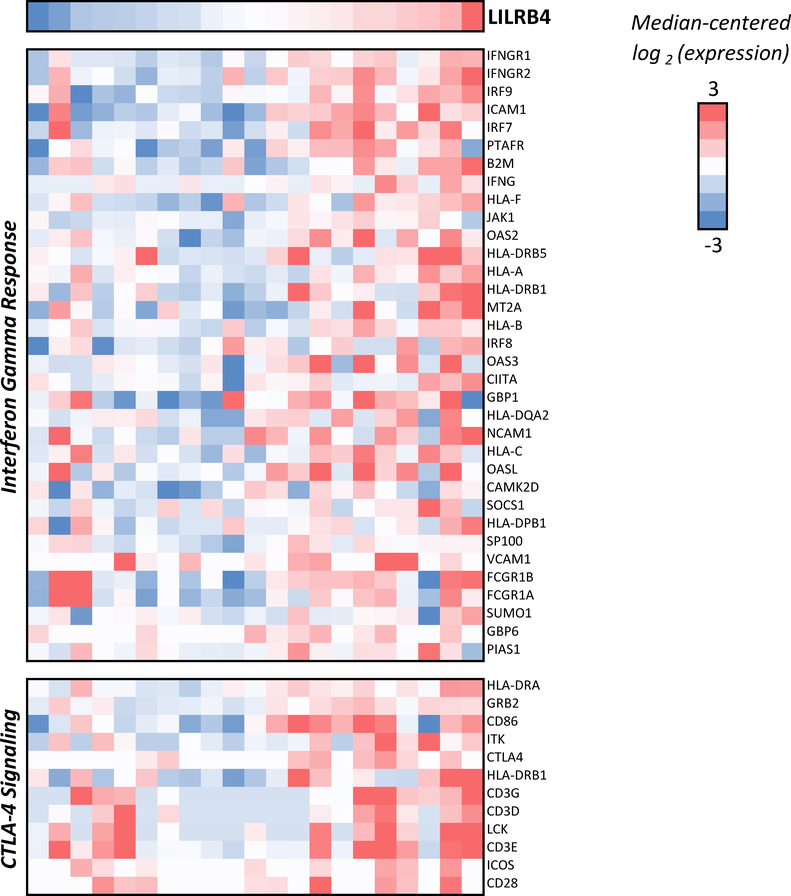
Gene set enrichment analysis revealed upregulation of several pathways that correlated with higher LILRB4 expression in CMML patients (Figure 5), including PD-1 signaling (q=0.004), CTLA-4 signaling (q=0.004, Figure 6), interferon gamma response (q=0.004, Figure 5), and inflammatory response (q=0.004). With the exception of CTLA-4 signaling, all of these are also positively correlated with LILRB4 expression in MDS patients (q < 0.05). Gene correlates indicated a positive association with CTLA-4 expression among CMML patients (rho = 0.43, p=0.05, q > 0.1), but no correlation was observed with PD-1 and PD-L1 expression.
Figure 5.
Pathways Associated with LILRB4 Expression in CMML Patients. Positive NES values indicate positive association of pathway with increased LILRB4 expression.
Figure 6.
Interferon Gamma Response and CTLA-4 Signaling Genes Positively Correlated with LILRB4 Expression in CMML Patients.
Discussion
The expression and role of LILRB4 in CMML and MDS is unknown. This study suggests a statistically significant increase in expression of LILRB4 in CMML patients. Analysis of 6 cell lines revealed some LILRB4 expression in 3: MOLM13 (MDS transformed to AML M5), SKM1 (MDS transformed to AML M5), and U937 (histiocytic lymphoma with pro-monocytic features). Based on the description of LILRB4 expression on monocytes14 and AML with monocytic differentiation6, our findings in patient samples and cell lines is concordant with that described in literature. Regarding response to HMA therapy, LILRB4 showed increased expression in HMA-sensitive CMML patients prior to treatment, though this was not statistically significant. A significant increase in LILRB4 expression was seen in HMA-sensitive MOLM13, but this was not observed in SKM1 or U937. Thus, the potential utility of LILRB4 as a predictive biomarker to determine sensitivity to HMAs in monocytic myeloid malignancies remains unknown. However, no difference was observed in LILRB4 levels before and after HMA treatment, leading to the assumption that LILRB4 may be an unsuitable prognostic biomarker.
Though immune checkpoint inhibitors have been successful in some forms of cancer, particularly solid tumors, it has not shown benefit in myeloid malignancies15, as seen by several completed clinical trials16,17. There are numerous ongoing clinical trials evaluating the role of anti-PD-1, anti-PD-L1, and anti-CTLA-4 monoclonal antibodies in myeloid neoplasms, particularly MDS and AML18,19. Mounting evidence supports the role of LILRB4 in patients with AML7, particularly monocytic AML, with the development of novel therapies, such as chimeric antigen receptor-modified T-cells20, targeting LILRB4 in this patient population. Given upregulation of PD-1, CTLA-4, and inflammatory response pathways, as well as increased CTLA-4 expression, LILRB4 may be a suitable target for immunotherapy in CMML patients. The utility of LILRB4 as an immune checkpoint inhibitor target should be further investigated.
We acknowledge that our study certainly has several limitations. First, the patient and sample numbers included in this study are small, thus limiting the statistical power to generate strong correlations. Only a subset of included patients have both pre- and post-HMA therapy samples available, consequently limiting the ability to fully evaluate changes in LILRB4 expression before and after HMAs. In addition, further functional studies are needed to confirm the association of LILRB4 expression with response to HMAs in CMML patients. Finally, larger studies are required to evaluate the role and prognostic significance of LILRB4 as a biomarker for HMA response in CMML.
Despite these limitations, our study is consistent with prior studies describing LILRB4 expression in monocytes and AML M4 and M5 cells. To the best of our knowledge, this is the first study to not only evaluate expression of LILRB4 in patients with CMML and MDS, but also assess LILRB4 expression based on response to HMAs. Given the upregulation of immune checkpoint and inflammatory pathways with increased LILRB4 expression and the positive correlation with CTLA-4 expression in CMML patients, future studies evaluating LILRB4 as a therapeutic target alone or in combination with anti-CTLA-4 monoclonal antibodies or novel immune therapies for CMML are warranted.
References
- 1.Carosella ED, Rouas-Freiss N, Tronik-Le Roux D, Moreau P, LeMaoult J. HLA-G: An Immune Checkpoint Molecule. Adv Immunol. 2015;127:33–144. [DOI] [PubMed] [Google Scholar]
- 2.Kang X, Kim J, Deng M, et al. Inhibitory leukocyte immunoglobulin-like receptors: Immune checkpoint proteins and tumor sustaining factors. Cell Cycle. 2016;15(1):25–40. [DOI] [PMC free article] [PubMed] [Google Scholar]
- 3.Suciu-Foca N, Feirt N, Zhang QY, et al. Soluble Ig-like transcript 3 inhibits tumor allograft rejection in humanized SCID mice and T cell responses in cancer patients. J Immunol. 2007;178(11):7432–7441. [DOI] [PubMed] [Google Scholar]
- 4.Kim-Schulze S, Scotto L, Vlad G, et al. Recombinant Ig-like transcript 3-Fc modulates T cell responses via induction of Th anergy and differentiation of CD8+ T suppressor cells. J Immunol. 2006;176(5):2790–2798. [DOI] [PubMed] [Google Scholar]
- 5.de Goeje PL, Bezemer K, Heuvers ME, et al. Immunoglobulin-like transcript 3 is expressed by myeloid-derived suppressor cells and correlates with survival in patients with non-small cell lung cancer. Oncoimmunology. 2015;4(7):e1014242. [DOI] [PMC free article] [PubMed] [Google Scholar]
- 6.Dobrowolska H, Gill KZ, Serban G, et al. Expression of immune inhibitory receptor ILT3 in acute myeloid leukemia with monocytic differentiation. Cytometry B Clin Cytom. 2013;84(1):21–29. [DOI] [PubMed] [Google Scholar]
- 7.Deng M, Gui X, Kim J, et al. LILRB4 signalling in leukaemia cells mediates T cell suppression and tumour infiltration. Nature. 2018;562(7728):605–609. [DOI] [PMC free article] [PubMed] [Google Scholar]
- 8.Arber DA, Orazi A, Hasserjian R, et al. The 2016 revision to the World Health Organization classification of myeloid neoplasms and acute leukemia. Blood. 2016;127(20):2391–2405. [DOI] [PubMed] [Google Scholar]
- 9.Greenberg P, Cox C, LeBeau MM, et al. International scoring system for evaluating prognosis in myelodysplastic syndromes. Blood. 1997;89(6):2079–2088. [PubMed] [Google Scholar]
- 10.Cheson BD, Greenberg PL, Bennett JM, et al. Clinical application and proposal for modification of the International Working Group (IWG) response criteria in myelodysplasia. Blood. 2006;108(2):419–425. [DOI] [PubMed] [Google Scholar]
- 11.Kim D, Pertea G, Trapnell C, Pimentel H, Kelley R, Salzberg SL. TopHat2: accurate alignment of transcriptomes in the presence of insertions, deletions and gene fusions. Genome Biol. 2013;14(4):R36. [DOI] [PMC free article] [PubMed] [Google Scholar]
- 12.Love MI, Huber W, Anders S. Moderated estimation of fold change and dispersion for RNA-seq data with DESeq2. Genome Biol. 2014;15(12):550. [DOI] [PMC free article] [PubMed] [Google Scholar]
- 13.Subramanian A, Tamayo P, Mootha VK, et al. Gene set enrichment analysis: a knowledge-based approach for interpreting genome-wide expression profiles. Proc Natl Acad Sci U S A. 2005;102(43):15545–15550. [DOI] [PMC free article] [PubMed] [Google Scholar]
- 14.Cella M, Dohring C, Samaridis J, et al. A novel inhibitory receptor (ILT3) expressed on monocytes, macrophages, and dendritic cells involved in antigen processing. J Exp Med. 1997;185(10):1743–1751. [DOI] [PMC free article] [PubMed] [Google Scholar]
- 15.Curran EK, Godfrey J, Kline J. Mechanisms of Immune Tolerance in Leukemia and Lymphoma. Trends Immunol. 2017;38(7):513–525. [DOI] [PMC free article] [PubMed] [Google Scholar]
- 16.Daver N, Basu S, Garcia-Manero G, et al. Phase IB/II Study of Nivolumab in Combination with Azacytidine (AZA) in Patients (pts) with Relapsed Acute Myeloid Leukemia (AML). Blood. 2016;128(22):763–763.27354720 [Google Scholar]
- 17.Zeidan AM, Knaus HA, Robinson TM, et al. A Multi-center Phase I Trial of Ipilimumab in Patients with Myelodysplastic Syndromes following Hypomethylating Agent Failure. Clinical cancer research : an official journal of the American Association for Cancer Research. 2018;24(15):3519–3527. [DOI] [PMC free article] [PubMed] [Google Scholar]
- 18.Stahl M, Goldberg AD. Immune Checkpoint Inhibitors in Acute Myeloid Leukemia: Novel Combinations and Therapeutic Targets. Curr Oncol Rep. 2019;21(4):37. [DOI] [PubMed] [Google Scholar]
- 19.Liu Y, Bewersdorf JP, Stahl M, Zeidan AM. Immunotherapy in acute myeloid leukemia and myelodysplastic syndromes: The dawn of a new era? Blood Rev. 2019;34:67–83. [DOI] [PubMed] [Google Scholar]
- 20.John S, Chen H, Deng M, et al. A Novel Anti-LILRB4 CAR-T Cell for the Treatment of Monocytic AML. Mol Ther. 2018;26(10):2487–2495. [DOI] [PMC free article] [PubMed] [Google Scholar]


