

Abstract
Finding a vaccine or cure for the coronavirus disease (COVID-19) responsible for the worldwide pandemic and its economic, medical, and psychological burdens is one of the most pressing issues presently facing the global community. One of the current treatment protocols involves the antibiotic azithromycin (AZM) alone or in combination with other compounds. Obtaining additional insight into the charge-transfer (CT) chemistry of this antibiotic could help researchers and clinicians to improve such treatment protocols. Toward this aim, we investigated the CT interactions between AZM and three π-acceptors: picric acid (PA), chloranilic acid (CLA), and chloranil (CHL) in MeOH solvent. AZM formed colored products at a 1:1 stoichiometry with the acceptors through intermolecular hydrogen bonding. An n → π* interaction was also proposed for the AZM-CHL CT product. The synthesized CT products had markedly different morphologies from the free reactants, exhibiting a semi-crystalline structure composed of spherical particles with diameters ranging from 50 to 90 nm.
Keywords: Charge–transfer, Azithromycin, Picric acid, Chloranilic acid, Chloranil
Graphical abstract

1. Introduction
The concept of charge-transfer (CT) or donor-acceptor interactions was first introduced by Robert Mulliken in 1969 based on his studies of Lewis acid-base chemistry. Thereafter, Roy Foster widely discussed and disseminated the concept of CT interactions [[1], [2], [3], [4], [5], [6]]. A great deal of research has been dedicated to CT interactions due to their wide range of applications in the fields of chemistry, biology, physics, biochemistry, medicine, pharmacology, material science, and industrial technology [[7], [8], [9], [10], [11], [12], [13], [14], [15], [16]]. Specifically, in the pharmacology and biochemistry fields, CT interactions contribute to the study of antimicrobial, antitumorigenic, and anti-inflammatory agents, binding mechanisms of pharmaceutical receptors, the thermodynamics and pharmacodynamics of clinical candidate compounds, DNA binding, enzymatic reactions, drug delivery, and quantitively characterizing pharmaceuticals [[17], [18], [19], [20], [21], [22], [23], [24], [25], [26], [27], [28], [29], [30], [31], [32], [33], [34], [35]]. In the fields of material engineering and technology, CT interactions facilitate the development and optimization of solar energy storage devices, organic solar cells, organic semiconductors, electrical conductors, biosensors, optoelectronics, non-linear optical materials, optical communication, photocatalysts, dendrimers, and several other magnetic, optical, and electrical technologies [[36], [37], [38], [39], [40], [41], [42], [43], [44], [45], [46], [47], [48], [49], [50], [51], [52], [53], [54], [55], [56], [57], [58], [59], [60], [61], [62], [63], [64], [65], [66], [67], [68], [69], [70], [71], [72], [73], [74], [75]].This long list of diverse applications has motivated extensive research efforts focusing on the physical and chemical properties of CT interactions including their spectral, photophysical, kinetic, thermodynamic, and crystallographic properties in addition to the factors that affect the yield of these products such as solvent, temperature, and concentration [[76], [77], [78], [79], [80], [81], [82], [83], [84], [85], [86], [87], [88], [89], [90], [91], [92], [93], [94], [95], [96], [97], [98], [99], [100], [101], [102], [103], [104], [105], [106], [107], [108], [109], [110], [111], [112], [113], [114], [115], [116], [117], [118], [119], [120], [121], [122], [123], [124], [125], [126], [127], [128], [129]]. Azithromycin (AZM) (C38H72N2O12, 748.98 g mol−1, Fig. 1a ) is the donor used in this work. Due to the wide range of its physiological effects along with its high level of safety, AZM is used to treat many infectious diseases (viral and bacterial in the respiratory tract, genitourinary, and enteric regions) including but not limited to pneumonia, influenza, chlamydia, typhoid fever, and malaria [[130], [131], [132], [133]]. Recently, AZM has been incorporated into the treatment protocols for the severe acute respiratory syndrome coronavirus 2 (SARS-CoV-2) disease (COVID-19) responsible for the current worldwide pandemic. This syndrome originated in Wuhan, China in December 2019 and quickly spread around the globe [134], causing the World Health Organization (WHO) to declare the COVID-19 outbreak a pandemic in early March 2020 [135]. Now, the mostly pressing issue facing the worldwide community is finding a means to treat or prevent COVID-19 [136]. One of the treatment protocols reported in literature includes AZM in combination with hydroxychloroquine or chloroquine as a short-term course [[137], [138], [139], [140], [141], [142]]. The acceptors used in this study are picric acid (PA), chloranilic acid (CLA), and chloranil (CHL) (Fig. 1b). PA is a strong organic acid and the most frequently used acceptor investigated in CT interactions [23,32,44,53,105,116,117,125,[143], [144], [145], [146], [147], [148], [149], [150], [151], [152], [153], [154], [155], [156], [157], [158], [159], [160], [161], [162], [163]]. CLA and CHL are interesting from a biological perspective as benzoquinone derivatives. The CLA molecule has two chloro groups and two carbonyl groups, whereas the CHL molecule has four chloro groups and two carbonyl groups. These groups act as electron-withdrawing systems that decrease the electron density of the aromatic rings of CLA and CHL, thereby rendering them robust electron-accepting systems [35,149,[164], [165], [166], [167], [168]]. The purpose of this work was to investigate the CT interaction of AZM with three π-acceptors (PA, CLA, and CHL) in MeOH solvent.
Fig. 1a.

Structure of the AZM molecule.
Fig. 1b Structures of the π-acceptors used in this work.
2. Experimental
2.1. Chemicals and characterization techniques
All chemicals used in this work (donor, acceptors, solvents) were procured from international chemical sources: Fluka (Germany), BDH (United Kingdom), and Sigma-Aldrich (USA). AZM, PA, CLA, and CHL were obtained at the highest purity available (≥ 98%). Throughout all experiments, dust masks, eye shields, and gloves served as personal protective equipment. A Bruker High-Performance Digital FT-NMR Spectrometer (DRX-250) was used to collect the 1H and 13C NMR spectra at 400 MHz with dimethylsulfoxide (DMSO‑d 6) as the solvent and tetramethylsilane (TMS) as the internal reference. A Shimadzu Fourier Transform Infrared Spectrophotometer (IR Tracer-100) was used to collect the FT-IR spectra in transmission mode from 4000 to 400 cm−1. The HACH LANGE GmbH UV/VIS Spectrophotometer (DR6000 Benchtop) was used to record the UV–visible spectra and spectrophotometric measurements in absorption mode from 800 to 200 nm. Elemental analyses of C, H, and N (in %) were performed on a Perkin-Elmer CHN Microanalyzer (Model PE 2400 series II). A Malvern Panalytical X-ray Powder Diffractometer (X'Pert3 MRD) was used to collect the XRD spectra over the diffraction angle (2θ) 5° to 80° at a radiation wavelength (λ) of 0.154056 nm. High-magnification images and EDX data were collected using the JEOL Scanning Electron Microscope (SEM; JSM-639OLA) coupled with an Energy Dispersive X-ray Spectrometer (EDXRF; JED-2300) and the JEOL Transmission Electron Microscope (TEM; JEM-1200EX II).
2.2. Synthesis of the solid CT products
The AZM donor was mixed with each acceptor (PA, CLA, or CHL) separately at a molar ratio of 1:1 (donor to acceptor) in pure, analytical-grade MeOH solvent at room temperature. The three mixtures were heated to 60 °C, followed by intense stirring for 20 min during which colored precipitates formed in each reaction system. The volume of each system was reduced by half using a water bath, and the samples were then left at room temperature for 24 h to complete the precipitation process. The resulting colored precipitates were sceptered from the solvent by filtration using Whatman 42 grade filter paper, rinsed well with MeOH several times, and recrystallized in MeOH to increase the purity of the products. After being dried in a vacuum over anhydrous CaCl2, the final colored CT products shown in Fig. 2 were obtained. AZM formed a canary yellow-colored product with PA, a violet-colored product with CLA, and a brownish-red-colored product with CHL. 1H and 13C NMR, FT-IR spectroscopies and elemental analyses were carried out to characterize the acquired solid CT products.
Fig. 2.

Free AZM (white) and its solid CT products: AZM-PA complex (canary yellow), AZM-CLA complex (violet), and AZM-CHL complex (brownish-red).
2.3. Stoichiometry of the CT interaction
The stoichiometry of the CT interaction between the AZM donor and the acceptors (PA, CLA, and CHL) was determined using three methods: elemental analysis of the solid CT products, and the spectrophotometric titration method [169] and Job's continuous variation method [170] for the soluble CT products.
3. Results and discussion
3.1. Solid CT products
3.1.1. Elemental data
The elemental results (in %) for the synthesized solid CT products were:
AZM-PA product: C44H75N5O19 (978.08 g mol−1): Observed (calculated) for C, 54.20 (53.98); H, 7.82 (7.67); N, 6.98 (7.16).
AZM-CLA product: C44H74N2Cl2O16 (957.96 g mol−1): Observed (calculated) for C, 54.95 (55.12); H, 7.91 (7.72); N, 3.15 (2.92).
AZM-CHL product: C44H72N2Cl4O14 (994.86 g mol−1): Observed (calculated) for C, 53.29 (53.07); H, 7.08 (7.24); N, 3.10 (2.81).
The microanalytical results suggested that AZM interacted with all acceptors at a molar ratio of 1:1 to form a complex with the general formula: [(AZM)(acceptor)].
3.1.2. SEM-EDX data
The SEM-EDX technique was used to observe the elemental compositions of the solid products and to visualize their surface morphology and the shape of the microstructure. Fig. 3, Fig. 4, Fig. 5, Fig. 6 contain the SEM images and EDX spectra of the free AZM, PA, CLA, and the solid CLA product, respectively. Fig. S1, S2, and S3 contain the SEM images and EDX spectra of the free CHL, the solid PA product, and solid CHL product, respectively. The elemental compositions indicated by EDX analysis of the PA, CLA, and CHL products aligned with those obtained from the elemental analysis. The presence of oxygen and carbon elements was corroborated for all products and chlorine for the CLA and CHL products by their EDX spectra. The SEM images of the free reactants revealed that AZM consisted of small pieces with undefined shapes and features. The PA particles were cubic, the CLA particles had a crocodile skin-like structure, and the CHL particles clumped into polygonal agglomerates. The morphology of the free reactants changed upon complexation. In the PA and CHL products, the surface of the particles became smoother than the free reactants. The particles of the PA product were no longer cubic but instead formed into agglomerates. In the CLA product, the rough, crocodile skin-like surface that characterized the free CLA particles was replaced by small, smooth pieces of different shapes and sizes.
Fig. 3.

SEM images and EDX spectrum of free AZM.
Fig. 4.

SEM images and EDX spectrum of free PA molecule.
Fig. 5.

SEM images and EDX spectrum of free CLA molecule.
Fig. 6.

SEM images and EDX spectrum of CLA product.
3.1.3. TEM imaging and XRD results
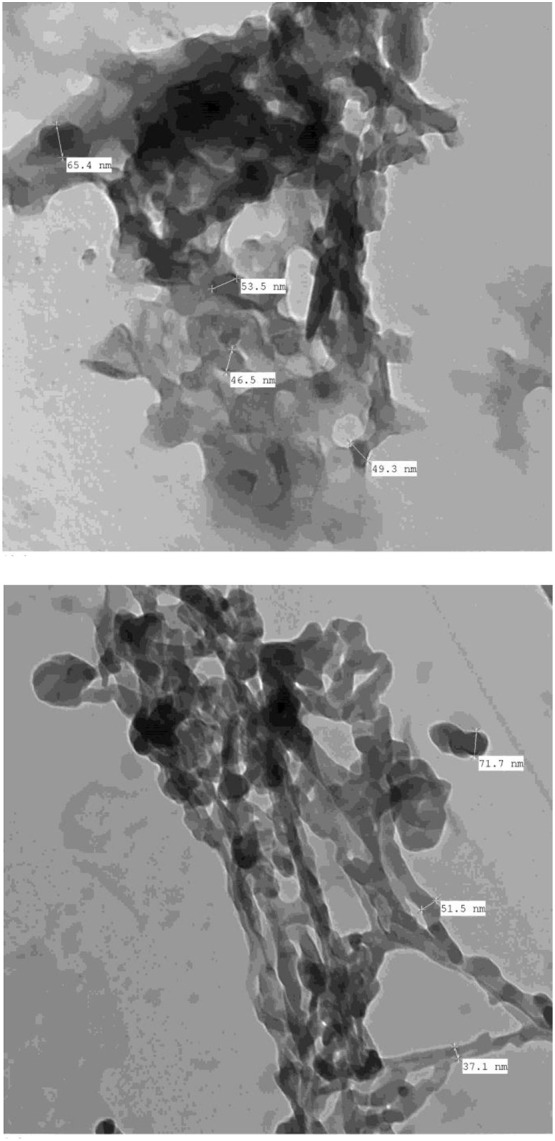
TEM was used to determine the size and shape of the particles from the solid CT products. The instrument used an accelerating voltage of 100 kV, and the TEM images were collected at 5000× − 30,000× magnification. Fig. 7, Fig. 8 contain the TEM images of the PA and CLA products, respectively, where Fig. S4 contains the TEM images of the CHL product. Most of the particles were spherical, 50–90 nm in size, and tended to aggregate into big clusters. Fig. S5 presents the XRD patterns of the solid products scanned from a Braggʼs diffraction angle (2θ) of 5° to 80°. The PA product generated a strong, sharp, intense Bragg diffraction line at angle 2θ 17.05° and a group of medium-strong intensity lines in the range of 18° to 30°. The CLA product gave one sharp, intense, very strong Bragg diffraction line located a 2θ of 15.295° and a medium-strong line at 22.325°. The CHL product displayed one strong, sharp, intense diffraction line at a 2θ of 15.164° and a group of medium intensity lines between 18° and 30°. These XRD profiles suggested that the solid CT products possess semi-crystalline structures.
Fig. 7.
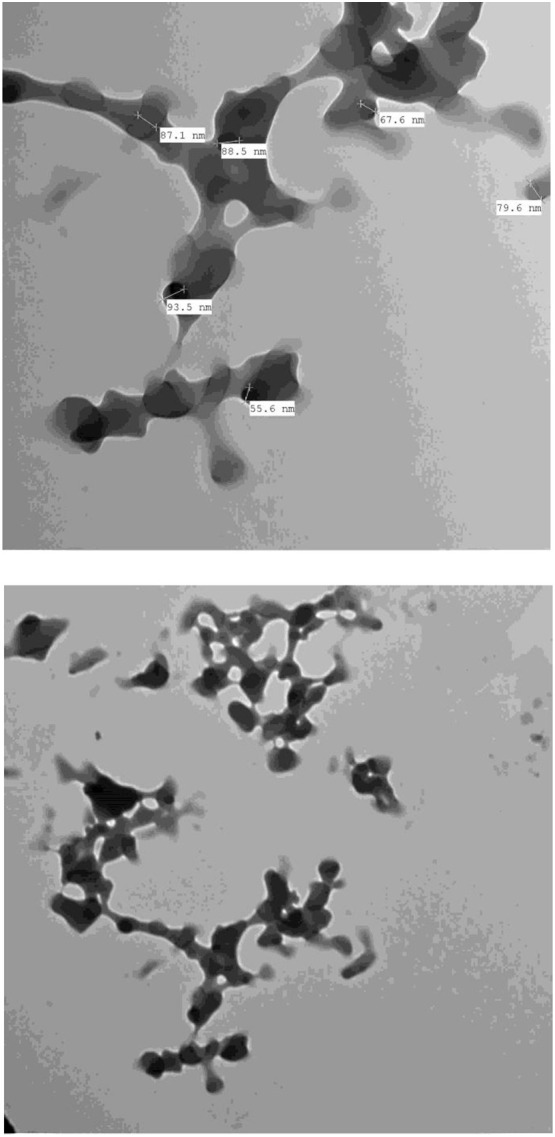
TEM images of PA product.
Fig. 8.
TEM images of CLA product.
3.1.4. FT-IR spectra
-
(A).
The donor and acceptors
The FT-IR spectra of the free reactants, AZM, PA, CLA, and CHL scanned from 4000 to 400 cm−1 are illustrated in Fig. 9 . In the IR spectrum of free AZM, the bands resonating at 984, 1040, 1088, and 1175 cm−1 were caused by the ν(C–C), ν(C–O), νs(C–N), and νas(C–N) vibrations, respectively [171]. The νs(C=O) vibrational mode caused a broad, weak band located at 1660 cm−1, while the νas(C=O) mode appeared as a sharp, medium-strong band at 1718 cm−1. The methylene (CH2) groups in the AZM molecule generated six vibrational bands at 2932, 2830, 1374, 1260, 794, and 560 cm−1 associated with the ν as(CH2), ν s(CH2), δsciss(CH2), δrock(CH2), δwag(CH2), and δtwist(CH2) vibrations, respectively [[172], [173], [174], [175]]. The methyl (CH3) groups gave four bands at 832, 1450, 2887, and 2972 cm−1 resulting from the δwag(CH3), δrock(CH3), ν s(CH3), and νas(CH3) vibrations, respectively. The three vibrational modes of the O–H bonds in the AZM molecule (stretching, in-plane bending, and out-of-plane bending vibrations) were observed at 3496–3238, 898, and 731 cm−1, respectively [176].
Fig. 9.

IR spectra of free AZM, PA, CLA, and CHL molecules.
The IR spectral data in (cm−1) for the free PA molecule were: 3100 ν(O–H), 2973 and 2875 νasym(C–H) and νsym(C–H), 1610 νasym(NO2), 1522 ν(C=C), 1425 δdef(C–H), 1333 νsym(NO2), 1253 ν(C–O), 1146 and 1077 δ(C–H) in-plane bending, 772 δscissor(NO2), 700 δwag(NO2), and 521 δrock (NO2). The IR spectral data for the free CLA molecule were: 3231 ν(O–H), 1664 νasym(C=O), 1623 νsym(C=O), 1360 ν(C=C), 1258 ν(C–O), 1206 and 1167 ν(C–C), 977 and 743 ν(C–Cl), 840 δ(O–H) in-plane bending, and 684 ν(O–H) out-of-plane bending. The IR spectral data for the free CHL molecule were: 1679 ν(C=O), 1558 ν(C=C), 1235 and 1103 ν(C–C), and 900 and 701 ν(C–Cl).
-
(B).
The CT solid products
The FT-IR spectra of the PA, CLA, and CHL products scanned from 4000 to 400 cm−1 are presented in Fig. S6. The interaction between the AZM donor and the PA acceptor yielded a CT product that produced the following IR bands (cm−1): 3511, 3375, 3150 ν(O–H), 2974, 2935, 2876 νasym(C–H) and ν sym(C–H), 2703 (–N…H–O), 1721 νasym(C=O), 1615 ν asym(NO2), 1558 ν(C=C), 1450 δrock(CH3), 1362 δscissor(CH2), 1313 νsym(NO2), 1274 ν(C–O), 1167 νasym(C–N), 1108 δ(C–H) in-plane bending, 1049 ν sym(C–N), 1000 ν(C–O), 951 ν(C–C), 909 δ(O–H) in-plane bending, 791 δscissor(NO2), 706 δwag(NO2), 633 δtwist(CH2), and 575 δrock(NO2).
The CT product arising from AZM and CLA produced IR bands at: 3331 ν(O–H), 2969, 2930, 2891, 2832 νasym(C–H) and νsym(C–H), 2695 (-N…H-O), 1727 νasym(C=O), 1629 νsym(C=O), 1522 ν(C=C), 1453 δdef(C–H), 1375 δscissor(CH2), 1267 ν(C–O), 1164 νasym(C–N), 1056 νsym(C–N), 997 and 716 ν(C–Cl), 900 δ(O–H) in-plane bending, 824 δwag(CH3), 629 ν(O–H) out-of-plane bending, and 570 δtwist(CH2).
The IR spectral assignments for the AZM and CHL product were: 3294 ν(O–H), 2971, 2932, 2883, 2834 νasym(C–H) and νsym(C–H), 2688 (–O–H…O=C), 1729 νasym(C=O), 1661 νs(C=O), 1540 ν(C=C), 1456 δrock(CH3), 1377 δscissor(CH2), 1279 δrock(CH2), 1162 νasym(C–N), 1055 νsym(C–N), 996 ν(C–O), 878 and 732 ν(C–Cl), 820 δwag(CH3), and 569 δtwist(CH2).
All of the principle IR bands that characterized the free AZM molecule and acceptors were observed in the corresponding CT solid products. Several of these bands shifted in position and decreased in intensity as a result of the complexation. A new weak, broad band was observed in each product's IR spectrum between 2400 and 2800 cm−1. This band was centered at 2703, 2695, and 2688 cm−1 in the PA, CLA, and CHL products, respectively, and was caused by intermolecular hydrogen bonding in the CT product [[177], [178], [179], [180], [181], [182], [183], [184], [185]]. The intermolecular hydrogen bonding also broadened the band originating from the stretching vibration of the O–H bond. This broad band was centered at 3375, 3331, and 3294 cm−1 in the PA, CLA, and CHL products, respectively. In the CLA product, the ν(C–Cl) bands appeared at 997 and 716 cm−1. In the CHL product, the ν(C–Cl) bands were observed at 878 and 732 cm−1. In the free CLA and CHL molecules, those bands registered at 977 and 743 cm−1 and at 900 and 701 cm−1, respectively. The nitro group vibrational modes δrock(NO2), δwag(NO2), δscissor(NO2), νsym(NO2), and νasym(NO2) shifted from 521, 700, 772, 1333, and 1610 cm−1 in the free PA molecule to 575, 706, 791, 1313, and 1615 cm−1 in its CT product, respectively. The CT complexation between AZM and the acceptors increased the electron density around the acceptor moiety, which induced shifting in the C–Cl and NO2 vibrations of the CT product.
3.1.5. NMR spectra
Fig. S7 contains the structure of the free AZM molecule along with the atom numbers from the NMR interpretation. The proton and carbon NMR spectra (1H and 13C) for the free AZM molecule and PA, CLA products are depicted in Fig. 10, Fig. 11, Fig. 12 , respectively, where Fig. S8 contains the 1H and 13C spectra for the CHL product. The observed 1H NMR spectra of the free AZM molecule and the CT products contained the following chemical shifts (δ) for the different types of proton configurations (in ppm):
-
i).
Free AZM:
Fig. 10.

1H and 13C NMR spectra of the free AZM molecule.
Fig. 11.

1H and 13C NMR spectra of the PA product.
Fig. 12.

1H and 13C NMR spectra of the CLA product.
δ = 0.58 (t, 3H, (C 2 -CH2CH 3)), 0.67 (d, 3H, (C 8 -CH 3)), 0.79 (d, 3H, (C 5 -CH 3)), 0.82 (s, 3H, (C 3 -CH 3)), 0.89 (d, 3H, (C 12 -CH 3)), 0.94 (d, 3H, (C 14 -CH 3)), 1.01 (d, 3H, (C 6'' -CH 3)), 1.27 (s, 3H, (C 4' -CH 3)), 1.30 (s, 3H, (C 10 -CH 3)), 1.56 (d, 3H, (C 6' -CH 3)), 1.60 (m, 2H, (C 2 -CH 2CH3)), 1.71 (d, 2H, (C 3' -CH 2)), 2.01 (m, 1H, (C 8 -CH)), 2.26 (dd, 2H, (C 5'' -CH 2)), 2.45 (d, 2H, (C 9 -CH 2)), 2.67 (m, 1H, (C 12 -CH)), 2.99 (s, 6H, (C 4'' -N(CH 3)2), 3.20 (s, 3H, (N 6 -CH 3), 3.47 (m, 1H, (C 4'' -CH)), 3.77 (m, 1H, (C 5 -CH)), 3.81 (m, 1H, (C 14 -CH)), 3.96 (d, 2H, (C 7 -CH 2)), 4.02 (d, 1H, (C 5' -CH)), 4.33 (s, 5H, 5OH), 4.55 (dd, 1H, (C 3'' -CH)), 4.60 (s, 3H, (C 4' -CH 3)), 4.67 (m, 1H, (C 6'' -CH)), 4.77 (d, 1H, (C 4 -CH)), 4.85 (d, 1H, (C 11 -CH)), 4.96 (dd, 1H, (C 13 -CH)), 5.02 (m, 1H, (C 6' -CH)), 5.22 (d, 1H, (C 2'' -CH)), 5.55 (t, 1H, (C 2' -CH)), 5.61 (t, 1H, (C 2 -CH)).
-
ii).
PA product:
δ = 0.78 (t, 3H, (C 2 -CH2CH 3)), 0.82 (d, 3H, (C 8 -CH 3)), 0.91 (d, 3H, (C 5 -CH 3)), 0.97 (s, 3H, (C 3 -CH 3)), 1.01 (d, 3H, (C 12 -CH 3)), 1.04 (d, 3H, (C 14 -CH 3)), 1.09 (d, 3H, (C 6'' -CH 3)), 1.26 (s, 3H, (C 4' -CH 3)), 1.30 (s, 3H, (C 10 -CH 3)), 1.55 (d, 3H, (C 6' -CH 3)), 1.81 (m, 2H, (C 2 -CH 2CH3)), 1.95 (d, 2H, (C 3' -CH 2)), 2.01 (m, 1H, (C 8 -CH)), 2.26 (dd, 2H, (C 5'' -CH 2)), 2.51 (d, 2H, (C 9 -CH 2)), 2.57 (m, 1H, (C 12 -CH)), 2.68 (s, 6H, (C 4'' -N(CH 3)2), 2.91 (s, 3H, (N 6 -CH 3), 3.23 (m, 1H, (C 4'' -CH)), 3.44 (m, 1H, (C 5 -CH)), 3.51 (m, 1H, (C 14 -CH)), 3.72 (d, 2H, (C 7 -CH 2)), 4.01 (d, 1H, (C 5' -CH)), 4.20 (s, 5H, 5OH), 4.41 (dd, 1H, (C 3'' -CH)), 4.60 (s, 3H, (C 4' -CH 3)), 4.67 (m, 1H, (C 6'' -CH)), 4.77 (d, 1H, (C 4 -CH)), 4.87 (d, 1H, (C 11 -CH)), 4.96 (dd, 1H, (C 13 -CH)), 5.02 (m, 1H, (C 6' -CH)), 5.37 (d, 1H, (C 2'' -CH)), 5.55 (t, 1H, (C 2' -CH)), 5.60 (t, 1H, (C 2 -CH)), 7.22 (s, 2H, picric acid), 8.59 (s, 1H, Picric acid OH).
-
iii).
CLA product:
δ = 0.82 (t, 3H, (C 2 -CH2CH 3)), 0.86 (d, 3H, (C 8 -CH 3)), 0.98 (d, 3H, (C 5 -CH 3)), 1.00 (s, 3H, (C 3 -CH 3)), 1.01 (d, 3H, (C 12 -CH 3)), 1.04 (d, 3H, (C 14 -CH 3)), 1.10 (d, 3H, (C 6'' -CH 3)), 1.26 (s, 3H, (C 4' -CH 3)), 1.30 (s, 3H, (C 10 -CH 3)), 1.45 (d, 3H, (C 6' -CH 3)), 1.55 (m, 2H, (C 2 -CH 2CH3)), 1.69 (d, 2H, (C 3' -CH 2)), 2.01 (m, 1H, (C 8 -CH)), 2.26 (dd, 2H, (C 5'' -CH 2)), 2.51 (d, 2H, (C 9 -CH 2)), 2.57 (m, 1H, (C 12 -CH)), 2.74 (s, 6H, (C 4'' -N(CH 3)2), 3.05 (s, 3H, (N 6 -CH 3), 3.24 (m, 1H, (C 4'' -CH)), 3.46 (m, 1H, (C 5 -CH)), 3.51 (m, 1H, (C 14 -CH)), 3.78 (d, 2H, (C 7 -CH 2)), 4.01 (d, 1H, (C 5' -CH)), 4.11 (s, 5H, 5OH), 4.48 (dd, 1H, (C 3'' -CH)), 4.60 (s, 3H, (C 4' -CH 3)), 4.67 (m, 1H, (C 6'' -CH)), 4.77 (d, 1H, (C 4 -CH)), 4.81 (d, 1H, (C 11 -CH)), 4.91 (dd, 1H, (C 13 -CH)), 5.09 (m, 1H, (C 6' -CH)), 5.37 (d, 1H, (C 2'' -CH)), 5.55 (t, 1H, (C 2' -CH)), 5.90 (t, 1H, (C 2 -CH)), 9.84 (s, 1H, nonhydrogen bonded OH), 10.08 (s, 1H, hydrogen bonded OH).
-
iv).
CHL product:
δ = 0.80 (t, 3H, (C 2 -CH2CH 3)), 0.85 (d, 3H, (C 8 -CH 3)), 0.91 (d, 3H, (C 5 -CH 3)), 0.97 (s, 3H, (C 3 -CH 3)), 1.01 (d, 3H, (C 12 -CH 3)), 1.03 (d, 3H, (C 14 -CH 3)), 1.09 (d, 3H, (C 6'' -CH 3)), 1.25 (s, 3H, (C 4' -CH 3)), 1.30 (s, 3H, (C 10 -CH 3)), 1.56 (d, 3H, (C 6' -CH 3)), 1.81 (m, 2H, (C 2 -CH 2CH3)), 1.94 (d, 2H, (C 3' -CH 2)), 2.01 (m, 1H, (C 8 -CH)), 2.27 (dd, 2H, (C 5'' -CH 2)), 2.51 (d, 2H, (C 9 -CH 2)), 2.51 (m, 1H, (C 12 -CH)), 2.60 (s, 6H, (C 4'' -N(CH 3)2), 2.72 (s, 3H, (N 6 -CH 3), 2.94 (m, 1H, (C 4'' -CH)), 3.17 (m, 1H, (C 5 -CH)), 3.31 (m, 1H, (C 14 -CH)), 3.77 (d, 2H, (C 7 -CH 2)), 4.01 (d, 1H, (C 5' -CH)), 4.20 (s, 5H, 5OH), 4.49 (dd, 1H, (C 3'' -CH)), 4.50 (s, 3H, (C 4' -CH 3)), 4.61 (m, 1H, (C 6'' -CH)), 4.77 (d, 1H, (C 4 -CH)), 4.83 (d, 1H, (C 11 -CH)), 4.90 (dd, 1H, (C 13 -CH)), 5.02 (m, 1H, (C 6' -CH)), 5.37 (d, 1H, (C 2'' -CH)), 5.55 (t, 1H, (C 2' -CH)), 5.60 (t, 1H, (C 2 -CH)).
The observed 13C NMR spectra of the free AZM molecule and the CT products contained the following chemical shifts (δ) for the different types of carbon moieties (in ppm):
-
i).
Free AZM:
δ = 9.36 (C 12 -CH3), 11.42 (C 2 -CH2 CH3), 11.70 (C 5 -CH3), 15.23 (C 15 -CH3), 18.04 (C 6' -CH3), 18.81 (C 3 -CH3), 21.28 (C 8 -CH3), 21.49 (C 6'' -CH3), 21.63 (C 2 -CH2CH3), 22.41 (C 4' -CH3), 25.55 (C 10 -CH3), 28.60 (C 5'' -CH2), 30.37 (C 8 -CH), 34.98 (C 3' -CH2), 36.48 (C 9 -CH), 38.48 (C 12 -CH), 40.62 (C 3'' -N(2CH3)), 42.01(N 6-CH3), 45.17 (C 14 -CH), 49.29 (C 4' -OCH3), 56.40 (C 7 -CH2), 62.56 (C 5 -CH), 65.29 (C 6' -CH), 65.40 (C 4'' -CH), 69.74 (C 6'' -CH), 70.91 (C 3'' -CH), 72.11 (C 3 –C), 73.29 (C 4' –C), 74.01 (C 10 –C), 77.76 (C 2 -CH), 77.82 (C 5' -CH), 79.71 (C 13 –C), 80.23 (C 4 -CH), 85.50 (C 11 –C), 94.89 (C 2' -CH), 102.00 (C 2'' -CH), 177.66 (C 15 -C=O).
-
ii).
PA product:
δ = 7.57 (C 12 -CH3), 9.33 (C 2 -CH2 CH3), 11.40 (C 5 -CH3), 15.21 (C 15 -CH3), 17.59 (C 6' -CH3), 18.81 (C 3 -CH3), 21.28 (C 8 -CH3), 21.45 (C 6'' -CH3), 21.61 (C 2 -CH2CH3), 22.39 (C 4' -CH3), 25.55 (C 10 -CH3), 28.60 (C 5'' -CH2), 30.30 (C 8 -CH), 34.98 (C 3' -CH2), 36.36 (C 9 -CH), 38.48 (C 12 -CH), 40.59 (C 3'' -N(2CH3)), 42.03 (N 6-CH3), 45.18 (C 14 -CH), 49.27 (C 4' -OCH3), 56.40 (C 7 -CH2), 62.56 (C 5 -CH), 65.30 (C 6' -CH), 66.97 (C 4'' -CH), 69.76 (C 6'' -CH), 70.91 (C 3'' -CH), 72.11 (C 3 –C), 73.28 (C 4' –C), 74.00 (C 10 –C), 77.77 (C 2 -CH), 77.83 (C 5' -CH), 79.71 (C 13 –C), 80.23 (C 4 -CH), 85.50 (C 11 –C), 94.90 (C 2' -CH), 102.00 (C 2'' -CH), 124.6, 125.6, 142.3, 161.2 (picric acid 4C), 177.6 (C 15 -C=O).
-
iii).
CLA product:
δ = 8.05 (C 12 -CH3), 9.39 (C 2 -CH2 CH3), 11.42 (C 5 -CH3), 15.17 (C 15 -CH3), 17.87 (C 6' -CH3), 18.77 (C 3 -CH3), 21.20 (C 8 -CH3), 21.49 (C 6'' -CH3), 21.54 (C 2 -CH2CH3), 22.24 (C 4' -CH3), 25.41 (C 10 -CH3), 26.20 (C 5'' -CH2), 30.97 (C 8 -CH), 34.93 (C 3' -CH2), 36.58 (C 9 -CH), 38.48 (C 12 -CH), 40.56 (C 3'' -N(2CH3)), 42.05 (N 6-CH3), 45.18 (C 14 -CH), 49.42 (C 4' -OCH3), 56.40 (C 7 -CH2), 62.56 (C 5 -CH), 65.46 (C 6' -CH), 66.76 (C 4'' -CH), 69.71 (C 6'' -CH), 70.91 (C 3'' -CH), 72.11 (C 3 –C), 73.26 (C 4' –C), 74.29 (C 10 –C), 77.73 (C 2 -CH), 77.82 (C 5' -CH), 79.71 (C 13 –C), 80.23 (C 4 -CH), 83.22 (C 11 –C), 94.84 (C 2' -CH), 101.77 (C 2'' -CH), 124.6, 125.6, 142.3, 161.2 (Chloranilic acid 4C), 161.2, 170.6 (Chloranilic acid 2C=O), 177.6 (C 15 -C=O).
-
iv).
CHL product:
δ = 7.57 (C 12 -CH3), 9.33 (C 2 -CH2 CH3), 11.40 (C 5 -CH3), 15.21 (C 15 -CH3), 17.79 (C 6' -CH3), 18.65 (C 3 -CH3), 21.06 (C 8 -CH3), 21.18 (C 6'' -CH3), 21.45 (C 2 -CH2CH3), 22.34 (C 4' -CH3), 25.13 (C 10 -CH3), 25.58 (C 5'' -CH2), 31.39 (C 8 -CH), 34.85 (C 3' -CH2), 36.65 (C 9 -CH), 38.48 (C 12 -CH), 40.57 (C 3'' -N(2CH3)), 42.09 (N 6-CH3), 45.17 (C 14 -CH), 49.26 (C 4' -OCH3), 49.50 (C 7 -CH2), 61.80 (C 5 -CH), 65.39 (C 6' -CH), 66.01 (C 4'' -CH), 69.38 (C 6'' -CH), 72.10 (C 3'' -CH), 72.90 (C 3 –C), 73.33 (C 4' –C), 74.25 (C 10 –C), 74.25 (C 2 -CH), 77.66 (C 5' -CH), 77.76 (C 13 –C), 83.21 (C 4 -CH), 91.81 (C 11 –C), 94.74 (C 2' -CH), 101.60 (C 2'' -CH), 154.6 (Chloranil C), 175.5 (Chloranil C O),177.6 (C 15 -C=O).
The free AZM molecule produced 33 protons in the range of δ = 0.58–5.61 ppm. This region was crowded with singlet, doublet, and triplet signals from -CH, -CH2, and -CH3 protons. AZM also produced 37 carbon resonances located in the δ = 9.36–177.66 ppm range. All of these proton and carbon resonances were also present in the 1H and 13C NMR spectra of the PA, CLA, and CHL products. The six protons of the tertiary amino group attached to carbon number C 4'' [N(CH3)2] of the AZM molecule exhibited considerable up-field shifts from 2.99 ppm for the free AZM molecule to 2.68 for its product with the PA acceptor, to 2.74 for its product with the CLA acceptor, and to 2.60 for its product with the CHL acceptor. This up-field shift suggested that the nitrogen atom in this group participated in the CT complexation with the acceptors. The free AZM molecule exhibited a singlet at 4.33 ppm due to the five protons from the (OH) groups. This signal was still observed in all of the products representing small shifts from the analogous signal in the free AZM spectrum. It was located at 4.2 ppm for the PA and CHL products, and at 4.11 for the CLA product. The characteristic signal from the OH proton that resonated at δ ~9.95 ppm in the spectrum of the free PA molecule up-field shifted to 8.59 ppm in the spectrum of the PA product upon complexation, suggesting that the OH group of PA participated in the formation of the CT product. The characteristic signal from the two OH protons that resonated at δ ~9.15 ppm in the spectrum of the free CLA molecule was observed in two different positions in the spectrum of the CLA product. The signal centered at 9.84 ppm was assigned to the non‑hydrogen-bonded OH of the CLA moiety, while the signal centered at 10.08 was attributed to the hydrogen-bonded OH. Several changes in the values of the 13C chemical shifts in the AZM molecule were observed after its complexation with the acceptors. In the 13C NMR spectra of the products, the 41, 43, and 39 resonant carbon signals in the spectra of the PA, CLA, and CHL products, respectively, were in agreement with the structures proposed for these products. Based on the foregoing elemental and spectral results, the structures of the CT products were formulated as illustrated in Fig. 13 .
Fig. 13.

Proposed structures of the synthesized CT products.
3.2. Soluble CT products
3.2.1. CT absorptions
The soluble PA, CLA, and CHL products were generated by mixing AZM solution in the MeOH solvent at a concentration of 5.0 × 10⁻⁴ M with each acceptor solution at the same concentration in MeOH solvent. Solutions of free AZM, free acceptors, and the resultant soluble CT products were scanned in the UV–visible region, as seen in Fig. 14 . Several conclusions were drawn from these data:
-
i).
The solution of free AZM is MeOH solvent is colorless, displaying no measurable absorption band in the UV–visible region and tailing in the visible region with no peak maximum.
-
ii).
All of the acceptors solubilized in MeOH absorbed in the visible region. The PA acceptor had a strong, wide absorption band ranging from 300 nm to 450 nm with a λmax at 353 nm. The CLA acceptor displayed a weak, wide absorption band ranging from 440 nm to 600 nm with a λmax at 523 nm. The CHL acceptor displayed a strong, wide absorption band ranging from 330 nm to 400 nm with a λmax at 360 nm.
-
iii).
The formation of a CT complex changed the electronic spectrum of the donor, acceptor, or both. These spectral changes included bathochromic shifts: increases in the intensity of the absorption band of the donor, acceptor, or both and hypsochromic shifts: the appearance of a new, intense, broad band in the UV–visible region where the uncomplexed donor or acceptor absorbs. The interactions between AZM and both PA and CLA were characterized by bathochromic shifts. While AZM didn't absorb in the visible region, the absorption band that characterized the free PA and CLA molecules considerably increased in intensity after complexation with the AZM molecule.
-
iv).
A hypsochromic shift was observed when AZM was complexed with CHL. The interaction between AZM and CHL resulted in the formation of a new, intense, very broad and strong band that appeared at a much longer wavelength than was present for the free CHL. This new band had a λmax of 412 nm.
Fig. 14.

Electronic absorption spectra of the AZM donor (5.0 × 10⁻⁴ M), the acceptors (PA, CLA and CHL) (5.0 × 10⁻⁴ M), and the resulting soluble CT complex in MeOH solvent.
3.2.2. Stoichiometry
The composition of AZM and the acceptors in solution was determined using the spectrophotometric titration method and Job's continuous variation method, and the obtained plots are given in Fig. 15a, 15b . Both methods suggested that the AZM molecule interacted with the PA, CLA, and CHL acceptors at a 1:1 ratio. Therefore, the general composition of the products was [(AZM)(acceptor)].
Fig. 15a.

Stoichiometry of the interaction between AZM and the acceptors determined by the spectrophoometric titration method.
Fig. 15b Stoichiometry of the interaction between AZM and the acceptors determined by the Job's continuous variation method.
3.2.3. Spectroscopic parameters
Several spectroscopic parameters were evaluated for the PA, CLA, and CHL products using the 1:1 Benesi–Hildebrand plots at 298 K (Fig. 16 ), and equations described elsewhere [[186], [187], [188], [189], [190], [191], [192], [193], [194], [195]]. These parameters are the transition dipole moment (μ), the formation constant (K CT), the standard free energy (ΔG°), the energy of interaction (E CT), the oscillator strength (f), the molar extinction coefficient (ε max), the ionization potential (I P), and the resonance energy (R N). Table 1 lists the spectroscopic parameters of the PA, CLA, and CHL products. All ΔG° values were negative, indicating that the interactions between the acceptors and AZM were exothermic, spontaneous, and reasonably stable [196]. Generally, the three products had high K CT and ε max values. The high K CT suggested that the complex was strongly bound and highly stable [197]. The complex with the PA acceptor showed the highest values of ε max and K CT (Fig. 17 ).
Fig. 16.

The 1:1 Benesi-Hildebrand plots of the PA, CLA, and CHL products.
Table 1.
Spectroscopic parameters of the PA, CLA, and CHL CT products in MeOH at 298 K.
| Parameter | Products |
||
|---|---|---|---|
| PA | CLA | CHL | |
| λmax (nm) | 353 | 523 | 412 |
| Dipole moment; μ (Debye) | 3.02 | 1.22 | 2.74 |
| Oscillator strength; f | 1.216 | 0.134 | 0.858 |
| Ionization potential; Ip (eV) | 10.09 | 8.69 | 9.47 |
| Energy of interaction; ECT (eV) | 3.52 | 2.38 | 3.02 |
| Resonance energy; RN | 0.999 | 0.635 | 0.853 |
| Extinction coefficient; εmax (L mol−1 cm−1) | 2.82E6 | 0.31E6 | 1.99E6 |
| Free energy change; ∆G° (kJ mol−1) | −3.71E4 | −3.70E4 | -3.39E4 |
| Formation constant; KCT (L mol−1) | 3.17E6 | 3.04E6 | 0.89E6 |
| Correlation coefficient; r | 0.94425 | 0.97670 | 0.95888 |
Fig. 17.

Values of the formation constant (KCT), and the molar extinction coefficient (εmax) for the PA, CLA and CHL products.
4. Conclusions
Obtaining a vaccine or cure for COVID-19 is the most pressing worldwide concern in 2020. One of the treatment protocols for COVID-19 uses AZM alone or in conjugation with other compounds. Providing additional insight into the CT chemistry of AZM by examining its interactions with several π-acceptors may help researchers and physicians to improve the treatment protocols for COVID-19. This work investigated the formation of three CT products arising from the complexation of AZM with the π-acceptors PA, CLA, and CHL in MeOH solvent. The structures and morphologies of the synthesized CT products were fully characterized using several spectroscopic and physicochemical approaches. AZM formed colored products at 1:1 stoichiometry with the investigated acceptors. The characteristic shifts in the FT-IR and 1H NMR spectra suggested that the CT interaction between AZM and the acceptors occurred through intermolecular hydrogen bonding. An n → π* interaction was also proposed for the AZM-CHL CT complex. The morphologies of the free reactants were markedly different than the synthesized CT products with semi-crystalline structures composed of spherical particles with diameters ranging from 50 to 90 nm.
Author contributions
A.M.A.A. and M.S.H. designed and observed the proposal and contributed to data analysis and interpretation. M.S.H. and A.M.A. performed the experiments. A.M.A.A. and H.A.S. surveyed the database and performed the spectral analysis. A.M.A.A. and M.S.H. provided conceptual advice and wrote the paper. All authors discussed the results and implications and commented on the manuscript at all stages.
Declaration of Competing Interest
The authors declare that no conflict of interest.
Acknowledgments
This work was supported by Taif University Researchers Supporting Project Number (TURSP-2020/02), Taif University, Taif, Saudi Arabia.
Footnotes
Supplementary data to this article can be found online at https://doi.org/10.1016/j.molliq.2020.115121.
Appendix A. Supplementary data
Supplementary material
References
- 1.Mulliken R.S., Person W.B. Wiley; New York: 1969. Molecular Complexes. [Google Scholar]
- 2.Mulliken R.S. J. Am. Chem. Soc. 1950;72:600. [Google Scholar]
- 3.Foster R. Academic Press; London: 1969. Organic Charge-Transfer Complexes. [Google Scholar]
- 4.Madrakian T., Heidari S. Chin. Chem. Lett. 2014;25:1375. [Google Scholar]
- 5.Mulliken R.S. J. Phys. Chem. 1952;56:801. [Google Scholar]
- 6.Das S.K., Krishnamorthy G., Dofra S.K. Can. J. Chem. 2000;78:191. [Google Scholar]
- 7.Shakya S., Khan I.M. J. Hazard. Mater. 2021;403:123537. doi: 10.1016/j.jhazmat.2020.123537. [DOI] [PubMed] [Google Scholar]
- 8.Al-Attas A.S., Habeeb M.M., Al-Raimi D.S. J. Mol. Liq. 2009;148(2–3):58. [Google Scholar]
- 9.Seliger J., Zagar V., Gotoh K., Ishida H., Konnai A., Amino D., Asaji T. Phys. Chem. Chem. Phys. 2009;11(13):2281. doi: 10.1039/b818318j. [DOI] [PubMed] [Google Scholar]
- 10.Asaji T., Yoshimura Y., Amino D. Hyperfine Interact. 2007;179(1–3):1. [Google Scholar]
- 11.Gaballa A.S., Wagner C., Teleb S.M., Nour E.M., Elmosallamy M.A.F., Kaluderovic G.N., Schmidt H., Steinborn D. J. Mol. Struct. 2008;876(1–3):301. [Google Scholar]
- 12.Murata T., Morita Y., Yakiyama Y., Fukui K., Yarnochi H., Saito G., Nakasuji K. J. Am. Chem. Soc. 2007;129(35):10837. doi: 10.1021/ja072607m. [DOI] [PubMed] [Google Scholar]
- 13.Suzuki H., Mori H., Yamaura J.I., Matsuda M., Tajima H., Mochida T. Chem. Lett. 2007;36(3):402. [Google Scholar]
- 14.Horiuchi S., Ishii F., Kumai R., Okimoto Y., Tachibana H., Nagaosa H., Tokura Y. Nat. Mater. 2005;4:163. doi: 10.1038/nmat1298. [DOI] [PubMed] [Google Scholar]
- 15.Horiuchi S., Kumai R., Tokura Y. J. Am. Chem. Soc. 2005;127:5010. doi: 10.1021/ja042212s. [DOI] [PubMed] [Google Scholar]
- 16.Amano M., Yamamura Y., Sumita M., Yasazuka S., Kawaji H., Atake T., Saito K. J. Chem. Phys. 2009;130 doi: 10.1063/1.3058589. [DOI] [PubMed] [Google Scholar]
- 17.Khan I.M., Islam M., Shakya S., Alam K., Alam N., Shahid M. Bioorg. Chem. 2020;99:103779. doi: 10.1016/j.bioorg.2020.103779. [DOI] [PubMed] [Google Scholar]
- 18.Khan I.M., Shakya S., Akhtar R., Alam K., Islam M., Alam N. Bioorg. Chem. 2020;100:103872. doi: 10.1016/j.bioorg.2020.103872. [DOI] [PubMed] [Google Scholar]
- 19.Niranjani S., Venkatachalam K. J. Mol. Struct. 2020;1219:128564. [Google Scholar]
- 20.Mahipal V., Venkatesh N., Naveen B., Suresh G., Manaiah V., Parthasarathy T. Chem. Data Collect. 2020;28:100474. [Google Scholar]
- 21.Karmakar A., Bandyopadhyay P., Banerjee S., Mandal N.C., Singh B. J. Mol. Liq. 2020;299:112217. [Google Scholar]
- 22.Kavitha R., Nirmala S., Nithyabalaji R., Sribalan R. J. Mol. Struct. 2020;1204:127508. [Google Scholar]
- 23.Mohamed M.E., Frag E.Y.Z., Hathoot A.A., Shalaby E.A. Spectrochim. Acta A. 2018;189:357. doi: 10.1016/j.saa.2017.08.027. [DOI] [PubMed] [Google Scholar]
- 24.Shehab O.R., AlRabiah H., Abdel-Aziz H.A., Mostafa G.A.E. J. Mol. Liq. 2018;257:42. [Google Scholar]
- 25.Mohamed G.G., Hamed M.M., Zaki N.G., Abdou M.M., Mohamed M.E., Abdallah A.M. Spectrochim. Acta A. 2017;182:143. doi: 10.1016/j.saa.2017.03.068. [DOI] [PubMed] [Google Scholar]
- 26.Adegoke O.A., Babalola C.P., Kotila O.A., Obuebhor O. Arab. J. Chem. 2017;10(Supplement 2):S3848. [Google Scholar]
- 27.Sawsan A.A., Nahla S.N., Manal F.M., Shimaa A., Naglaa E. Arab. J. Chem. 2017;10(Supplement 2):S1855. [Google Scholar]
- 28.Ismail N.B.S., Narayana B. JTUSCI. 2017;11(5):710. [Google Scholar]
- 29.Adegoke O.A., Thomas O.E., Emmanuel S.N. JTUSCI. 2016;10(5):651. [Google Scholar]
- 30.Abdulrahman S.A.M., Devi O.Z., Basavaiah K., Vinay K.B. JTUSCI. 2016;10(1):80. [Google Scholar]
- 31.Rahman N., Sameen S., Kashif M. J. Mol. Liq. 2016;222:944. [Google Scholar]
- 32.Belal T.S., El-Kafrawy D.S., Mahrous M.S., Abdel-Khalek M.M., Abo-Gharam A.H. Spectrochim. Acta A. 2016;155:47. doi: 10.1016/j.saa.2015.11.008. [DOI] [PubMed] [Google Scholar]
- 33.Gouda A.A., Kasssem M. Arab. J. Chem. 2016;9(Supplement 2):S1712. [Google Scholar]
- 34.Alzoman N.Z., Alshehri J.M., Darwish I.A., Khalil N.Y., Abdel-Rahman H.M. Saudi Pharm. J. 2015;23(1):75. doi: 10.1016/j.jsps.2014.06.003. [DOI] [PMC free article] [PubMed] [Google Scholar]
- 35.Elqudaby H.M., Mohamed G.G., El-Din G.M.G. Spectrochim. Acta A. 2014;129:84. doi: 10.1016/j.saa.2014.02.110. [DOI] [PubMed] [Google Scholar]
- 36.Parra G.G., Pavanelli A.L.S., Franco L.P., Máximo L.N.C., da Silva R.S., Borissevitch I. J. Photochem. Photobiol. A. 2020;398:112580. [Google Scholar]
- 37.Li J., Zhang X., Nie J., Zhu X. J. Photochem. Photobiol. A. 2020;402:112803. [Google Scholar]
- 38.Lee S., Hong J., Jung S., Ku K., Kwon G., Seong W.M., Kim H., Yoon G., Kang I., Hong K., Jang H.W., Kang K. Energy Storage Mater. 2019;20:462. [Google Scholar]
- 39.Wang Q., Bian X., Suo Z., Han Y., Li H. J. Lumin. 2019;213:530. [Google Scholar]
- 40.Rusalov M.V., Volchkov V.V., Ivanov V.L., Ya M., Melnikov F.E. Gostev, Nadtochenko V.A., Vedernikov A.I., Gromov S.P., Alfimov M.V. J. Photochem. Photobiol. A. 2019;372:89. [Google Scholar]
- 41.Almalki A.S.A., Alhadhrami A., Adam A.M.A., Grabchev I., Almeataq M., Al-Humaidi J.Y., Sharshar T., Refat M.S. J. Photochem. Photobiol. A. 2018;361:76. [Google Scholar]
- 42.Almalki A.S.A., Alhadhrami A., Obaid R.J., Alsharif M.A., Adam A.M.A., Grabchev I., Refat M.S. J. Mol. Liq. 2018;261:565. [Google Scholar]
- 43.Datta A.S., Chattaraj S. Bagchi, Chakrabortty A., Lahiri S.C. Spectrochim. Acta A. 2015;146:119. doi: 10.1016/j.saa.2015.02.064. [DOI] [PubMed] [Google Scholar]
- 44.Adam A.M.A., Refat M.S., Saad H.A. C.R. Chim. 2015;18:914. [Google Scholar]
- 45.Saravanabhavan M., Sathya K., Puranik V.G., Sekar M. Spectrochim. Acta A. 2014;118:399. doi: 10.1016/j.saa.2013.08.115. [DOI] [PubMed] [Google Scholar]
- 46.Murugesan V., Saravanabhavan M., Sekar M. J. Photochem. Photobiol. B. 2014;140:20. doi: 10.1016/j.jphotobiol.2014.07.003. [DOI] [PubMed] [Google Scholar]
- 47.Kanci Bozoğlan B., Tunç S., Duman O. J. Lumin. 2014;155:198. [Google Scholar]
- 48.Singh N., Khan I.M., Ahmad A., Javed S. J. Mol. Struct. 2014;1065-1066:74. [Google Scholar]
- 49.Khan I.M., Ahmad A., Ullah M.F. Spectrochim. Acta A. 2013;102:82. doi: 10.1016/j.saa.2012.10.027. [DOI] [PubMed] [Google Scholar]
- 50.Khan I.M., Ahmad A., Kumar S. J. Mol. Struct. 2013;1035:38. [Google Scholar]
- 51.Sharma K., Sharma S.P., Lahiri S.C. Spectrochim. Acta A. 2012;92:212. doi: 10.1016/j.saa.2012.02.072. [DOI] [PubMed] [Google Scholar]
- 52.Kuila D.K., Lahiri S.C. J. Sol. Chem. 2012;41:36. [Google Scholar]
- 53.Khan I.M., Ahmad A., Ullah M.F. J. Photochem. Photobiol. B. 2011;103:42. doi: 10.1016/j.jphotobiol.2011.01.010. [DOI] [PubMed] [Google Scholar]
- 54.Khan I.M., Ahmad A., Aatif M. J. Photochem. Phtobiol. B: Biol. 2011;105:6. doi: 10.1016/j.jphotobiol.2011.06.004. [DOI] [PubMed] [Google Scholar]
- 55.Rabie U.W., Abou-El-Wafa M.H., Mohamed R.A. J. Mol. Struct. 2007;871:6. [Google Scholar]
- 56.Liang Y., Xing W., Liu L., Sun Y., Xu W., Zhu D. Org. Electron. 2020;78:105608. [Google Scholar]
- 57.Hashem H.A., Refat M.S. Surf. Rev. Lett. 2006;13:439. [Google Scholar]
- 58.Roy D.K., Saha A., Mukherjee A.K. Spectrochim. Acta A. 2005;61:2017. doi: 10.1016/j.saa.2004.08.001. [DOI] [PubMed] [Google Scholar]
- 59.Gupta R.K., Sing R.A. J. Appl. Sci. 2005;5:28. [Google Scholar]
- 60.Kidwai M., Saxena S., Rastogi S., Venkataramaman R. Curr. Med. Chem. Anti-Infective Agents. 2004;2:269. [Google Scholar]
- 61.Tracz A. Pol. J. Chem. 2002;76:457. [Google Scholar]
- 62.Dozal A., Keyzer H., Kim H.K., Way W.W. Int. J. Antimicrob. Agents. 2000;14:261. doi: 10.1016/s0924-8579(99)00163-6. [DOI] [PubMed] [Google Scholar]
- 63.Roy T., Dutta K., Nayek M.K., Mukherjee A.K., Banerjee M., Seal B.K., Chem J. Soc. Perkin Trans. 1999;2:2219. [Google Scholar]
- 64.Gutmann F., Johnson C., Keyzer H., Molnar J. Marcel Dekker Inc.; 1992. Charge Transfer Complexes in Biochemistry Systems. [Google Scholar]
- 65.Feng J., Zhong H., Xuebau B.D. Zir. Kexu. 1991;27(6):691. [Google Scholar]
- 66.Chen W., Huang B., Ni S., Xiong Y., Rogach A.L., Wan Y., Shen D., Yuan Y., Chen J., Lo M., Cao C., Zhu Z., Wang Y., Wang P., Liao L., Lee C. Adv. Funct. Mater. 2019:1903112. [Google Scholar]
- 67.Medjanik K., Elmers H., Schönhense G., Pouget J., Valenti R., Lang M. Phys. Status Solidi B. 2019:1800745. [Google Scholar]
- 68.Han J., Yang D., Jin X., Jiang Y., Liu M., Duan P. Angew. Chem. Int. Ed. 2019;58:7013. doi: 10.1002/anie.201902090. [DOI] [PubMed] [Google Scholar]
- 69.Salzillo T., Crivillers N., Mas-Torrent M., Wurst K., Veciana J. Synth. Met. 2019;247:144. [Google Scholar]
- 70.Chen X., Wang H., Wang B., Wang Y., Jin X., Bai F. Org. Electron. 2019;68:35. [Google Scholar]
- 71.Kang G., He S., Cheng H., Ren X. J. Photochem. Photobiol. A. 2019;383:111979. [Google Scholar]
- 72.Meng L., Chen F., Bai F., Bai B., Wang H., Li M. J. Photochem. Photobiol. A. 2019;377:309. [Google Scholar]
- 73.Zhao Z., Duan Y., Pan Q., Gao Y., Wu Y., Geng Y., Zhao L., Zhang M., Su Z. J. Photochem. Photobiol. A. 2019;375:1. [Google Scholar]
- 74.Sun H., Khan A., Usman R., Wang M. J. Photochem. Photobiol. A. 2019;371:315. [Google Scholar]
- 75.Ghosh S., Pramanik B., Das D. ChemNanoMat. 2018;4:867. [Google Scholar]
- 76.Balraj C., Balaji S., Karthikeyan M. Spectrochim. Acta A. 2021;245:118931. doi: 10.1016/j.saa.2020.118931. [DOI] [PubMed] [Google Scholar]
- 77.Khan I.M., Alam K., Alam M.J. J. Mol. Liq. 2020;310:113213. [Google Scholar]
- 78.Altalhi T.A. J. Mol. Liq. 2020;300:112325. [Google Scholar]
- 79.Basha M.T., Alghanmi R.M., Soliman S.M., Alharby W.J. J. Mol. Liq. 2020;309:113210. [Google Scholar]
- 80.Koroteev P.S., Ilyukhin A.B., Babeshkin K.A., Efimov N.N. J. Mol. Struct. 2020;1207:127800. [Google Scholar]
- 81.El-Dissouky A., Khalil T.E., Elbadawy H.A., El-Sayed D.S., Attia A.A., Foro S. J. Mol. Struct. 2020;1200:127066. [Google Scholar]
- 82.Al-Saif F.A., El-Habeeb A.A., Refat M.S., Eldaroti H.H., Adam Abdel Majid A., Fetooh H., Saad H.A. J. Mol. Liq. 2019;293:111517. [Google Scholar]
- 83.Al-Saif F.A., El-Habeeb A.A., Refat M.S., Adam Abdel Majid A., Saad H.A., El-Shenawy A.I., Fetooh H. J. Mol. Liq. 2019;287:110981. [Google Scholar]
- 84.Venkatesh N., Naveen B., Venugopal A., Suresh G., Mahipal V., Manojkumar P., Parthasarathy T. J. Mol. Struct. 2019;1196:462. [Google Scholar]
- 85.Neupane U., Singh M., Pandey P., Rai R.N. J. Mol. Struct. 2019;1195:131. [Google Scholar]
- 86.Falek W., Benali-Cherif R., Golea L., Samai S., Benali-Cherif N., Bendeif E., Daoud I. J. Mol. Struct. 2019;1192:132. [Google Scholar]
- 87.Faizan M., Afroz Z., Alam M.J., Rodrigues V.H., Ahmed S., Ahmad A. J. Mol. Struct. 2019;1177:229. [Google Scholar]
- 88.Fathima K.S., Sathiyendran M., Anitha K. J. Mol. Struct. 2019;1176:238. [Google Scholar]
- 89.Soltani S., Magri P., Rogalski M., Kadri M. J. Mol. Struct. 2019;1175:105. [Google Scholar]
- 90.Man L., Li T., Wu X., Lu K., Yang L., Liu X., Yang Z., Zhou J., Ni C. J. Mol. Struct. 2019;1175:971. [Google Scholar]
- 91.Ganesh K., Balraj C., Satheshkumar A., Elango K.P. Arab. J. Chem. 2019;12:503. [Google Scholar]
- 92.Volchkov V.V., Khimich M.N., Rusalov M.V., Gostev F.E., Shelaev I.V., Nadtochenko V.A., Vedernikov A.I., Gromov S.P., Freidzon A. Ya, Alfimov M.V., Melnikov M. Ya. Photochem. Photobiol. Sci. 2019;18:232. doi: 10.1039/c8pp00328a. [DOI] [PubMed] [Google Scholar]
- 93.Fu Y., Xu Q., Li Q., Li M., Shi C., Du Z. ChemistryOpen. 2019;8:127. doi: 10.1002/open.201800251. [DOI] [PMC free article] [PubMed] [Google Scholar]
- 94.Jeevan A.K., Gopidas K.R. ChemistrySelect. 2019;4:506. [Google Scholar]
- 95.Afroz Z., Faizan M., Alam M.J., Rodrigues V.H.N., Ahmad S., Ahmad A. J. Mol. Struct. 2018;1171:438. [Google Scholar]
- 96.Karmakar A., Singh B. J. Mol. Struct. 2018;1164:404. [Google Scholar]
- 97.Miyan L., Zulkarnain A., Ahmad J. Mol. Liq. 2018;262:514. [Google Scholar]
- 98.Alghanmi R.M., Soliman S.M., Basha M.T., Habeeb M.M. J. Mol. Liq. 2018;256:433. [Google Scholar]
- 99.Alam K., Khan I.M. Org. Electron. 2018;63:7. [Google Scholar]
- 100.Khan I.M., Shakya S., Singh N. J. Mol. Liq. 2018;250:150. [Google Scholar]
- 101.Soltani S., Magri P., Rogalski M., Kadri M. Spectrochim. Acta A. 2018;205:170. doi: 10.1016/j.saa.2018.07.026. [DOI] [PubMed] [Google Scholar]
- 102.Chaudhuri T., Santra S., Jana S., Hajra A. Spectrochim. Acta A. 2018;204:403. doi: 10.1016/j.saa.2018.06.083. [DOI] [PubMed] [Google Scholar]
- 103.Al-Ahmary K.M., Habeeb M.M., Al-Obidan A.H. Spectrochim. Acta A. 2018;196:247. doi: 10.1016/j.saa.2018.02.025. [DOI] [PubMed] [Google Scholar]
- 104.Karmakar A., Singh B. J. Mol. Liq. 2017;247:425. [Google Scholar]
- 105.Karmakar A., Singh B. J. Mol. Liq. 2017;236:135. [Google Scholar]
- 106.Almalki A.S.A., Naglah A.M., Refat M.S., Hegab M.S., Adam A.M.A., Al-Omar M.A. J. Mol. Liq. 2017;233:292. [Google Scholar]
- 107.Miyan L., Qamar S., Ahmad A. J. Mol. Liq. 2017;225:713. [Google Scholar]
- 108.Al-Ahmary K.M., Soliman S.M., Mekheimer R.A., Habeeb M.M., Alenezi M.S. J. Mol. Liq. 2017;231:602. [Google Scholar]
- 109.Thirumurugan R., Anitha K. J. Mol. Struct. 2017;1146:273. [Google Scholar]
- 110.Zulkarnain I.M., Khan A., Ahmad L., Miyan M., Ahmad N., Azizc J. Mol. Struct. 2017;1141:687. [Google Scholar]
- 111.Ulagendran V., Balu P., Kannappan V., Kumar R., Jayakumar S. J. Mol. Struct. 2017;1141:213. [Google Scholar]
- 112.Gogoi P., Mohan U., Borpuzari M.P., Boruah A., Baruah S.K. J. Mol. Struct. 2017;1131:114. [Google Scholar]
- 113.Ghasemi F., Ghasemi K., Rezvani A.R., Shokrollahi A., Refahi M., García-Granda S., Mendoza-Meroño R. J. Mol. Struct. 2017;1131:30. [Google Scholar]
- 114.Singh N., Ahmad A. J. Mol. Struct. 2017;1127:257. [Google Scholar]
- 115.Özgün S., Asker E., Zeybek O. J. Mol. Struct. 2017;1127:31. [Google Scholar]
- 116.Karmakar A., Singh B. Spectrochim. Acta A. 2017;179:110. doi: 10.1016/j.saa.2017.01.047. [DOI] [PubMed] [Google Scholar]
- 117.Refat M.S., Adam A.M.A., El-Sayed M.Y. Arab. J. Chem. 2017;10:S3482. [Google Scholar]
- 118.Misra P., Badoga S., Chenna A., Dalai A.K., Adjaye J. Chem. Eng. J. 2017;325:176. [Google Scholar]
- 119.Zulkarnain L., Miyan A., Ahmad M.F., Alam H., Younus J. Photochem. Photobiol. B. 2017;174:195. doi: 10.1016/j.jphotobiol.2017.07.002. [DOI] [PubMed] [Google Scholar]
- 120.Adam A.M.A., Refat M.S., Hegab M.S., Saad H.A. J. Mol. Liq. 2016;224:311. doi: 10.1016/j.molliq.2022.119092. [DOI] [PMC free article] [PubMed] [Google Scholar]
- 121.Al-Ahmary K.M., Alenezi M.S., Habeeb M.M. J. Mol. Liq. 2016;220:166. [Google Scholar]
- 122.Singh N., Khan I.M., Ahmad A., Javed S. J. Mol. Liq. 2016;221:111. [Google Scholar]
- 123.Adam A.M.A., Refat M.S. J. Mol. Liq. 2016;219:377. [Google Scholar]
- 124.Miyan L., Ahmad A. J. Mol. Liq. 2016;219:614. [Google Scholar]
- 125.Adam A.M.A., Refat M.S., Saad H.A., Hegab M.S. J. Mol. Liq. 2016;216:192. doi: 10.1016/j.molliq.2022.119092. [DOI] [PMC free article] [PubMed] [Google Scholar]
- 126.El-Sheshtawy H.S., Ibrahim M.M., Aly M.R.E., El-Kemary M. J. Mol. Liq. 2016;213:82. [Google Scholar]
- 127.Berto S., Chiavazza E., Ribotta V., Daniele P.G., Barolo C., Giacomino A., Vione D., Malandrino M. Spectrochim. Acta A. 2015;149:75. doi: 10.1016/j.saa.2015.04.044. [DOI] [PubMed] [Google Scholar]
- 128.Singh N., Khan I.M., Ahmad A., Javed S. J. Mol. Liq. 2014;191:142. [Google Scholar]
- 129.Singh N., Ahmad A. J. Mol. Struct. 2014;1074:408. [Google Scholar]
- 130.Firth A., Prathapan P. Eur. J. Med. Chem. 2020;207:112739. doi: 10.1016/j.ejmech.2020.112739. [DOI] [PMC free article] [PubMed] [Google Scholar]
- 131.Zarogoulidis P., Papanas N., Kioumis I., Chatzaki E., Maltezos E., Zarogoulidis K. Eur. J. Clin. Pharmacol. 2012;68(5):479. doi: 10.1007/s00228-011-1161-x. [DOI] [PubMed] [Google Scholar]
- 132.Min J., Jang Y.J. Med. Inf. 2012;2012:649570. doi: 10.1155/2012/649570. [DOI] [PMC free article] [PubMed] [Google Scholar]
- 133.Grgičević I., Mikulandra I., Bukvić M., Banjanac M., Radovanović V., Habinovec I., Bertoša B., Novak P. Int. J. Antimicrob. Agents. 2020:106147. doi: 10.1016/j.ijantimicag.2020.106147. [DOI] [PubMed] [Google Scholar]
- 134.Zhu N., Zhang D., Wang W., Li X., Yang B., Song J., Zhao X., Huang B., Shi W., Lu R., Niu P., Zhan F., Ma X., Wang D., Xu W., Wu G., Gao G.F., Phil D., Tan W. N. Engl. J. Med. 2020;382:727. doi: 10.1056/NEJMoa2001017. [DOI] [PMC free article] [PubMed] [Google Scholar]
- 135.Organization WH . 2020. WHO Director-General's Opening Remarks at the Media Briefing on COVID-19, 11 March 2020, Geneva, Switzerland. [Google Scholar]
- 136.Ali I., Alharbi O.M.L. Sci. Total Environ. 2020;728:138861. doi: 10.1016/j.scitotenv.2020.138861. [DOI] [PMC free article] [PubMed] [Google Scholar]
- 137.Bakhshaliyev N., Uluganyan M., Enhos A., Karacop E., Ozdemir R. J. Electrocardiol. 2020;62:59. doi: 10.1016/j.jelectrocard.2020.08.008. [DOI] [PMC free article] [PubMed] [Google Scholar]
- 138.Gautret P., Lagier J., Parola P., Hoang V.T., Meddeb L., Mailhe M., Doudier B., Courjon J., Giordanengo V., Vieira V.E., Dupont H.T., Honoré S., Colson P., Chabrière E., La Scola B., Rolain J., Brouqui P., Raoult D. Int. J. Antimicrob. Agents. 2020;56:105949. doi: 10.1016/j.ijantimicag.2020.105949. [DOI] [PMC free article] [PubMed] [Google Scholar] [Retracted]
- 139.Pain A., Lauriola M., Romandini A., Scaglione F. Int. J. Antimicrob. Agents. 2020;56:106053. doi: 10.1016/j.ijantimicag.2020.106053. [DOI] [PMC free article] [PubMed] [Google Scholar]
- 140.Vouri S.M., Thai T.N., Winterstein A.G. Res. Soc. Adm. Pharm. 2020 doi: 10.1016/j.sapharm.2020.04.031. [DOI] [PMC free article] [PubMed] [Google Scholar]
- 141.Mitra R.L., Greenstein S.A., Epstein L.M. HeartRhythm Case Rep. 2020;6(5):244. doi: 10.1016/j.hrcr.2020.03.016. [DOI] [PMC free article] [PubMed] [Google Scholar]
- 142.Arshad S., Kilgore P., Chaudhry Z.S., Jacobsen G., Wang D.D., Huitsing K., Brar I., Alangaden G.J., Ramesh M.S., McKinnon J.E., O’Neill W., Zervos M. Int. J. Infect. Dis. 2020;97:396. doi: 10.1016/j.ijid.2020.06.099. [DOI] [PMC free article] [PubMed] [Google Scholar]
- 143.Wu Y., Luo S., Cao L., Jiang K., Wang L., Xie J., Wang Z. Anal. Chim. Acta. 2017;976:74. doi: 10.1016/j.aca.2017.04.022. [DOI] [PubMed] [Google Scholar]
- 144.Mutneja R., Singh R., Kaur V., Wagler J., Kroke E., Kansal S.K. Dyes Pigments. 2017;139:635. [Google Scholar]
- 145.Tian X., Qi X., Liu X., Zhang Q. Sensors Actuators B Chem. 2016;229:520. [Google Scholar]
- 146.Duraimurugan K., Balasaravanan R., Siva A. Sensors Actuators B Chem. 2016;231:302. [Google Scholar]
- 147.Refat M.S., Ismail L.A., Adam A.M.A. Spectrochim. Acta A. 2015;134:288. doi: 10.1016/j.saa.2014.06.107. [DOI] [PubMed] [Google Scholar]
- 148.El-Sayed M.Y., Refat M.S. Spectrochim. Acta A. 2015;137:1270. doi: 10.1016/j.saa.2014.09.032. [DOI] [PubMed] [Google Scholar]
- 149.Refat M.S., Saad H.A., Adam A.M.A. Spectrochim. Acta A. 2015;141:202. doi: 10.1016/j.saa.2015.01.029. [DOI] [PubMed] [Google Scholar]
- 150.Gaballa A.S., Amin A.S. Spectrochim. Acta A. 2015;145:302. doi: 10.1016/j.saa.2015.03.005. [DOI] [PubMed] [Google Scholar]
- 151.Refat M.S., Adam A.M.A., Saad H.A. J. Mol. Strut. 2015;1085:178. [Google Scholar]
- 152.Gupta A., Kang Y., Choi M., Park J.S. Sensors Actuators B Chem. 2015;209:225. [Google Scholar]
- 153.Al-Harbi L.M., El-Mossalamy E.H., Obaid A.Y., Al-Jedaani A.H. Spectrochim. Acta A. 2014;120:25. doi: 10.1016/j.saa.2013.09.047. [DOI] [PubMed] [Google Scholar]
- 154.Eldaroti H.H., Gadir S.A., Refat M.S., Adam A.M.A. J. Pharm. Anal. 2014;4(2):81. doi: 10.1016/j.jpha.2013.06.003. [DOI] [PMC free article] [PubMed] [Google Scholar]
- 155.Manikandan M., Mahalingam T., Hayakawa Y., Ravi G. Spectrochim. Acta A. 2013;101:178. doi: 10.1016/j.saa.2012.08.086. [DOI] [PubMed] [Google Scholar]
- 156.Adam A.M.A. Spectrochim. Acta A. 2013;104:1. doi: 10.1016/j.saa.2012.11.042. [DOI] [PubMed] [Google Scholar]
- 157.Bator G., Sobczyk L., Sawka-Dobrowolska W., Wuttke J., Pawlukojc A., Grech E., Nowicka-Scheibe J. Chem. Phys. 2013;410:55. doi: 10.1063/1.3613640. [DOI] [PubMed] [Google Scholar]
- 158.Adam A.M.A., Refat M.S., Saad H.A. J. Mol. Strut. 2013;1037:376. [Google Scholar]
- 159.Adam A.M.A. J. Mol. Struct. 2012;1030:26. [Google Scholar]
- 160.Refat M.S., Saad H.A., Adam A.M.A. Spectrochim. Acta A. 2011;79:672. doi: 10.1016/j.saa.2011.03.058. [DOI] [PubMed] [Google Scholar]
- 161.Singh N., Khan I.M., Ahmad A. Spectrochim. Acta A. 2010;75:1347. doi: 10.1016/j.saa.2009.12.085. [DOI] [PubMed] [Google Scholar]
- 162.Khan I.M., Ahmad A. Spectrochim. Acta A. 2010;77:437. doi: 10.1016/j.saa.2010.06.011. [DOI] [PubMed] [Google Scholar]
- 163.Khan I.M., Ahmad A., Oves M. Spectrochim. Acta A. 2010;77:1059. doi: 10.1016/j.saa.2010.08.073. [DOI] [PubMed] [Google Scholar]
- 164.Naglaha A.M., Al-Omar M.A., Ibrahim O.B., Refat M.S., Adam A.M.A., Saad H.A., El-Metwaly N.M. Russ. J. Gen. Chem. 2016;86(4):965. [Google Scholar]
- 165.Refat M.S., Saad H.A., Adam A.M.A., Al-Omar M.A., Naglah A.M. Acta Pharma. 2016;66:533. doi: 10.1515/acph-2016-0045. [DOI] [PubMed] [Google Scholar]
- 166.Adam A.M.A., Refat M.S. J. Mol. Liq. 2015;209:33. [Google Scholar]
- 167.Darwish I.A., Alshehri J.M., Alzoman N.Z., Khalil N.Y., Abdel-Rahman H.M. Spectrochim. Acta A. 2014;131:347. doi: 10.1016/j.saa.2014.04.099. [DOI] [PubMed] [Google Scholar]
- 168.Refat M.S. J. Mol. Struct. 2011;985:380. [Google Scholar]
- 169.Skoog D.A. third ed. Saunders; New York, USA: 1985. Principle of Instrumental Analysis. (Chapter 7) [Google Scholar]
- 170.Kumar K.S., Parthasarathy T. J. Solut. Chem. 2017;46:1364. [Google Scholar]
- 171.Sajan D., Binoy J., Pradeep B., Krishnan K.V., Kartha V.B., Joe I.H., Jayakumar V.S. Spectrochim. Acta A. 2004;60:173. doi: 10.1016/s1386-1425(03)00193-8. [DOI] [PubMed] [Google Scholar]
- 172.Sathyanarayana D.N. Second ed. New Age International (P) Limited Publishers; New Delhi: 2004. Vibrational Spectroscopy- Theory and Applications. [Google Scholar]
- 173.Sridevi C., Velraj G. J. Mol. Struct. 2012;1019:50. [Google Scholar]
- 174.Socrates G. Third ed. Wiley; New York: 2001. Infrared and Raman Characteristic Group Frequencies-Tables and Charts. [Google Scholar]
- 175.Varsanyi G. vol. 1 and 2. Academic Kiado; Budapest: 1973. Assignments for Vibrational Spectra of Seven Hundred Benzene Derivatives. [Google Scholar]
- 176.Silverstein R.M., Webster F.X. Sixth ed. Jon Wiley Sons Inc.; New York: 1963. Spectrometric Identification of Organic Compounds. [Google Scholar]
- 177.Ibrahim O.B., Manaaa E.A., AL-Majthoub M.M., Fallatah A.M., Adam A.M.A., Alatibi M.M., Al-Humaidi J.Y., Refat M.S. Spectrosc. Spectr. Anal. 2018;38(11):3622. [Google Scholar]
- 178.Adam A.M.A., Refat M.S., Saad H.A., Hegab M.S. J. Mol. Struct. 2015;1102:170. [Google Scholar]
- 179.Ding X., Li Y., Wang S., Li X., Huang W. J. Mol. Struct. 2014;1062:61. [Google Scholar]
- 180.Selvakumar E., Babu G. Anandha, Ramasamy P., Chandramohan A. Spectrochim. Acta A. 2014;122:436. doi: 10.1016/j.saa.2013.11.029. [DOI] [PubMed] [Google Scholar]
- 181.Adam A.M.A. Spectrochim. Acta A. 2014;127:107. doi: 10.1016/j.saa.2014.02.077. [DOI] [PubMed] [Google Scholar]
- 182.Ding X., Li Y., Wang S., Li X., Huang W. J. Mol. Struct. 2013;1051:124. [Google Scholar]
- 183.Eldaroti H.H., Gadir S.A., Refat M.S., Adam A.M.A. Spectrochim. Acta A. 2013;115:309. doi: 10.1016/j.saa.2013.06.046. [DOI] [PubMed] [Google Scholar]
- 184.Eldaroti H.H., Gadir S.A., Refat M.S., Adam A.M.A. Spectrochim. Acta A. 2013;109:259. doi: 10.1016/j.saa.2013.03.032. [DOI] [PubMed] [Google Scholar]
- 185.Frost R.L., Locos O.B., Ruan H., Kloprogge J.T. Vib. Spectrosc. 2001;27:1. [Google Scholar]
- 186.Benesi H.A., Hildebrand J.H. J. Am. Chem. Soc. 1949;71:2703. [Google Scholar]
- 187.Hindawey A.M., Nassar A.M.G., Issa R.M., Issa Y.M. Indian J. Chem. 1980;19A:27. [Google Scholar]
- 188.Issa Y.M., Hindawey A.M., El-Kholya A.E., Issa R.M. Gazz. Chim. Ital. 1981;111:27. [Google Scholar]
- 189.El-Sayed M., Agrawl S. Talanta. 1982;29:535. [Google Scholar]
- 190.Lever A.B.P. Second ed. Elsevier; Amsterdam: 1985. Inorganic Electronic Spectroscopy. [Google Scholar]
- 191.Tsubumora H., Lang R. J. Am. Chem. Soc. 1961;83:2085. [Google Scholar]
- 192.Aloisi G., Pignataro S. J. Chem. Soc. Faraday Trans. 1973;69:534. [Google Scholar]
- 193.Briegleb G. Z. Angew. Chem. 1960;72:401. [Google Scholar]
- 194.Briegleb G., Czekalla J. Z. Physikchem. (Frankfurt) 1960;24:237. [Google Scholar]
- 195.Martin A.N., Swarbrick J., Cammarata A. 3rd ed. Lee and Febiger; Philadelphia, PA: 1969. Physical Pharmacy; p. 344. [Google Scholar]
- 196.Pandeeswaran M., Elango K.P. Spectrochim. Acta A. 2006;65:1148. doi: 10.1016/j.saa.2005.12.037. [DOI] [PubMed] [Google Scholar]
- 197.Balraj C., Ganesh K., Elango K.P. J. Mol. Struct. 2011;998:110. [Google Scholar]
Associated Data
This section collects any data citations, data availability statements, or supplementary materials included in this article.
Supplementary Materials
Supplementary material