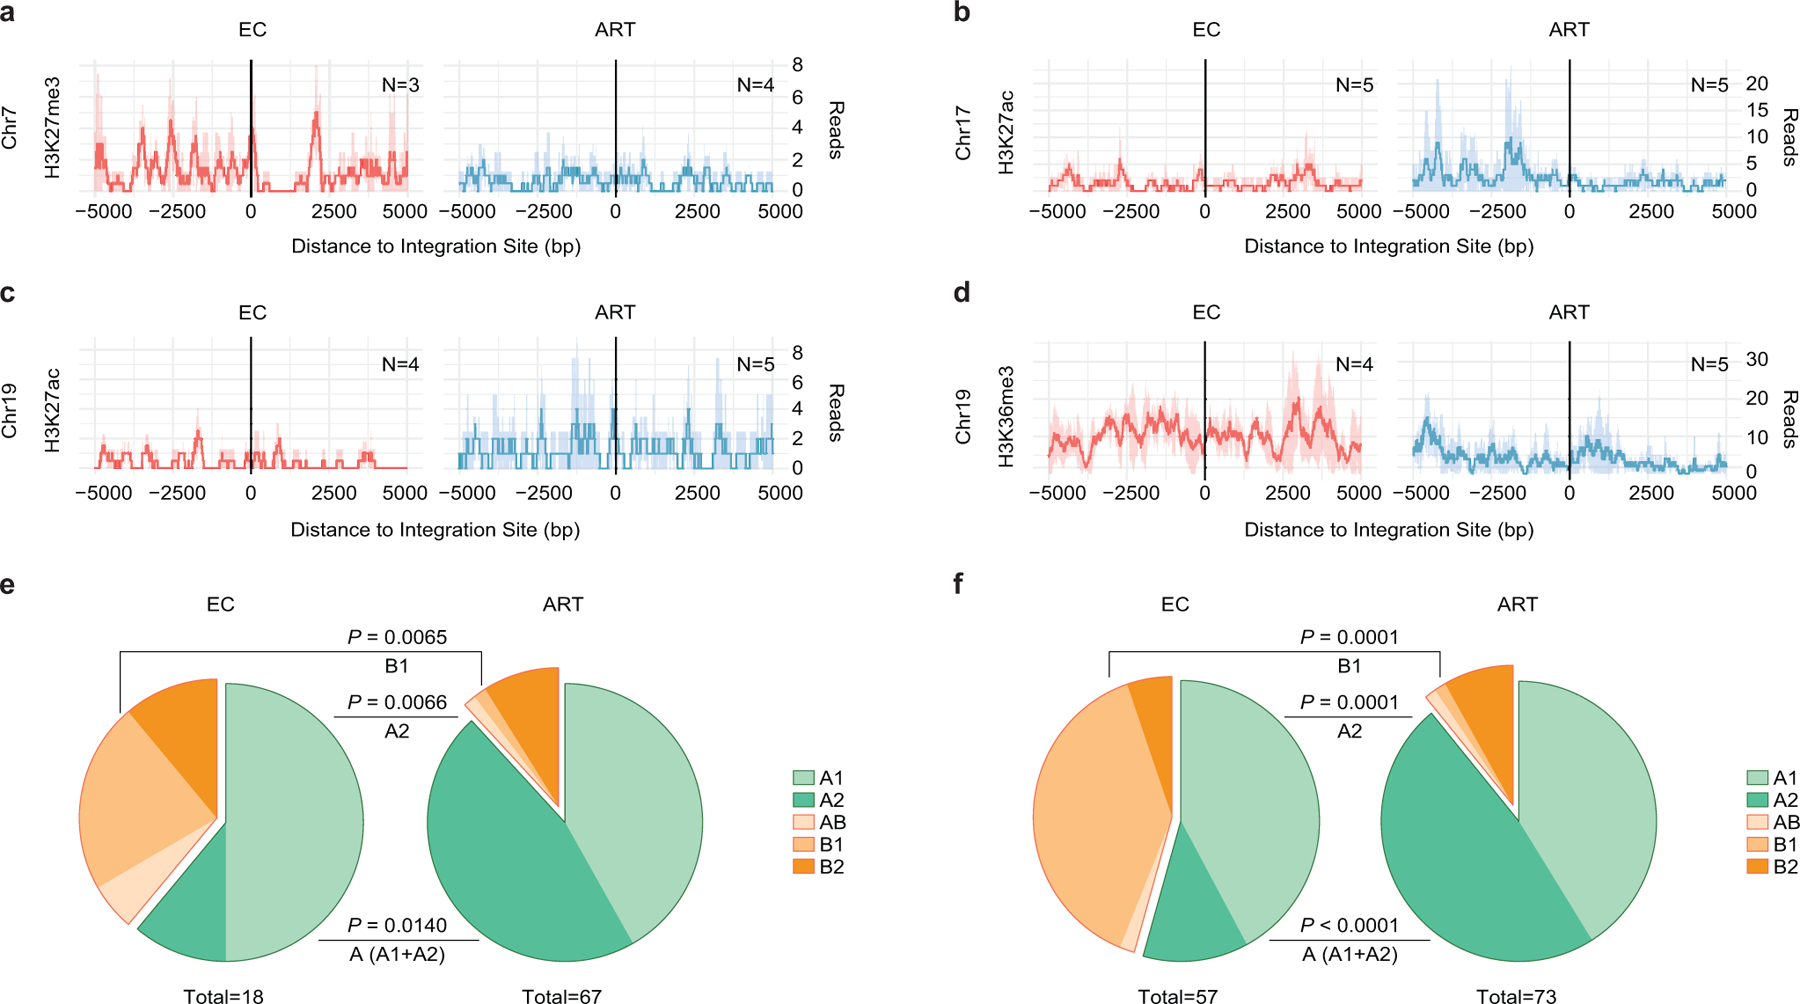
Extended Data Figure 6: Epigenetic features of chromosomal integration sites of intact proviruses from ECs.

(a-d): Numbers of DNA sequencing reads associated with activating (H3K27ac) or repressive (H3K27me3) histone protein modifications in proximity to integration sites from ECs and long-term ART-treated individuals; median and confidence intervals (defined by one standard deviation) of ChIP-Seq data from primary memory CD4+ T-cells included in the ROADMAP repository25 are shown. Negative distances indicate genomic regions upstream of the HIV 5’ LTR host-viral junction, while positive distances indicate regions downstream of the 3’ LTR viral-host junction. DNA sequencing reads associated with H3K36me3, an activating chromatin mark that is atypically enriched in KRAB-ZNF genes on Chromosome 19, are also shown28. (e-f): Proportions of intact proviral sequences located in structural compartments A and B (and associated sub-compartments) by counting clonal sequences once (e) or by counting clonal sequences individually (f), as determined based on alignment of chromosomal integration sites of intact proviruses to Hi-C-Seq data from Jurkat cells29. Chromosomal integration regions not covered in the Jurkat cell study were excluded from the analysis. Compartment B4 was not assessed in the source data29 for this analysis. Two-sided Fisher’s exact tests were used for statistical comparisons, nominal p-values are reported. (a-f): Sequences in genomic regions included in the blacklist for functional genomics analysis identified by the ENCODE and modENCODE consortia27 were excluded due to absence of reliable ChIP-Seq and Hi-C-Seq reads in such repetitive regions.
