

Abstract
Inflammation-limiting non-steroidal pain relievers magnify myocardial infarction (MI) incidences and increase re-admission events in heart failure (HF) patients. However, the molecular and cellular mechanism of this provocative adverse effect is unclear. Our goal was to determine whether carprofen (CAP) impedes splenic leukocyte-directed acute inflammation-resolving response in cardiac injury. After subacute CAP treatment, mice were subjected to permanent coronary ligation maintaining MI- and naïve-controls. Spleen and left ventricle (LV) leukocytes were quantitated using flow cytometry pre- and 24h post-MI. The inflammation resolution mediators were quantified using mass spectrometry while splenocardiac apoptosis and leukocyte phagocytosis were measured by immunofluorescence and ImageStream respectively. Subacute CAP treatment promoted strain and cardiac dysfunction before MI and coronary occlusion showed signs of acute HF in CAP and MI-controls. Subacute CAP-injected mice had pre-activated splenic neutrophils, an over activated ‘don’t eat me’ signal (CD47) with reduced total macrophages (F4/80+) and reparative macrophages (F4/80/Ly6Clo/CD206) compared with control in LV and spleen. Post-MI, CAP pre-activated neutrophils (Ly6G+) were intensified and reduced reparative neutrophils (Ly6G+/CD206+) and macrophages (F4/80/Ly6Clo) in LV was indicative of non-resolving inflammation compared with MI-control. Subacute CAP treatment deferred neutrophil phagocytosis functions in the spleen and LV and was more evident post-MI compared with MI-control. CAP pre-activated splenic neutrophils that tailored the macrophage phagocytosis thereby increased splenocardiac leukocyte death. CAP over amplified COX-1 and COX-2 compared with MI-control and failed to limit prostaglandins and thromboxane in post-MI setting. Further, CAP reduced cardiac-protective epoxyeicosatrienoic acids and over amplified pyrogenic inflammatory cytokines and reduced reparative cytokines, thereby non-resolving inflammation.
Keywords: Inflammation, leukocytes, myocardial infarction, resolution of inflammation
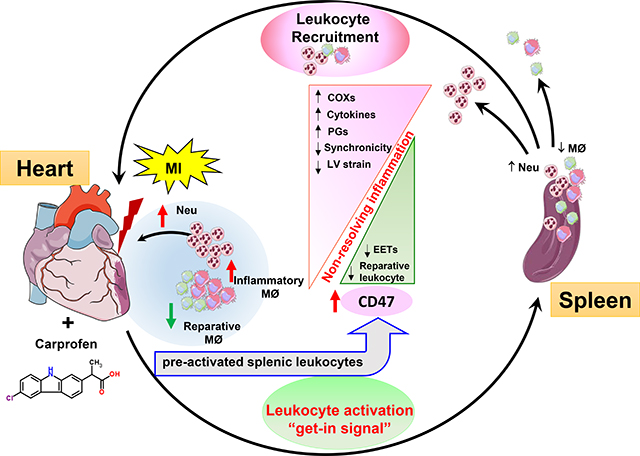
Summary sentence
Inflammation-limiting pain-relievers magnify myocardial infarction incidences, and therefore redefined the mechanism that subacute carprofen treatment in mice pre-activates splenic neutrophils with signs of non-resolving inflammation.
Graphical Abstract
Introduction
Activation of prostaglandin (PG) endoperoxide synthase, commonly known as cyclooxygenase (COX), to biosynthesize PGs is a natural process in response to cardinal signs of injury, infection or stress.[1, 2] Therefore, pain-killers, particularly non-steroidal anti-inflammatory drugs (NSAIDs), are most commonly used inflammation blockers worldwide. Overall, the traditional and selective COX-2 inhibitors are widely consumed pain-relievers in the U.S., with over 70 million prescriptions and more than 30 billion over-the-counter tablets per year.[3–5] However, recent clinical data indicates that painkillers have serious side effects such as MI, stroke, dyspepsia, renal and /or heart failure (HF) and hospital readmission due to discomfort in HF patients.[4, 6, 7] The mechanism(s) of cellular and molecular events that leads to the adverse effect(s) of NSAIDs are incomplete.
In response to cardiac injury such as MI, the splenic leukocytes are deployed to LV for myocardial damage clearance and to facilitate scar formation commonly perceived as an inflammatory response.[8] In this acute healing process, the resolving phase remains ignored and traditionally, resolving response was considered a passive event.[9, 10] The present study was designed to test whether subacute carprofen (CAP) treatment interferes with cellular and molecular events of the inflammation-resolution axis in acute decompensated HF after cardiac injury. Classically to limit inflammation, the COX-2-mediated pathway is usually targeted to block the synthesis of PGs, but the interaction of COX-inhibiting agents with orthodox cytochrome P450 epoxygenase (CYP) and lipoxygenase (LOX)-derived novel bioactive lipid mediators pathway that facilitate resolution of inflammation are ignored.[9, 11] As COX generates PGs, likewise, the LOX and CYP pathway respectively biosynthesize novel and orthodox lipid mediators using the common substrate such as essential fatty acids.[11] COX biosynthesizes families of prostanoids (prostaglandins and thromboxanes), LOX generates specialized pro-resolving mediators and CYP biosynthesizes EETs.[10–13] After subacute CAP treatment, we determined the inflammation-resolution nexus within 24 hours of cardiac injury to define the role of the splenocardiac axis in cardiac healing.
Subacute CAP treatment heightened the resistance to clearance (‘don’t eat me’ signal) and over activated neutrophils swarming with signs of non-resolving inflammation post-MI. After CAP treatment, neutrophil numbers were increased. Also, the phagocytic function was deferred, and lowered the reparative macrophages in acute cardiac injury, which thereby interrupted the cellular and molecular response. Despite claims that COX-2 inhibitors control inflammation, however prolonged treatment of CAP failed to limit post-MI elevated levels of PGs. In contrast, CAP triggered neutrophils with enhanced ‘don’t eat me’ signal (CD47), increased pyrogenic inflammatory cytokines-chemokines (TNF-α, IL-1β and CCL2) and lowered reparative markers (Mrc-1/CD206). Thus, subacute CAP treatment over activated COXs in LV with defective pre-activation of splenocardiac leukocytes, which is indicative of an inflammation-resolution deficit in post-MI cardiac injury.
Materials and Methods
Animal study compliance
All pre-clinical work conformed to the Guide for the Care and Use of Laboratory Animals published by the US National Institutes of Health (Revised 2015) and was approved by the Animal Care and Use Committee. For compliance of scientific rigor and reproducibility, the detailed methods are provided as online supplementary data.
Study design and CAP treatment protocol
Male C57BL/6J 8–12 weeks of mice were obtained from Jackson Laboratory (Bar Harbor, Maine) and were randomized into the four groups. Group-1 : naïve control (−CAP-no-MI), Group-2: MI-control subjected to coronary ligation surgery (−CAP-MI-d1), Group-3: two-week CAP (5 mg/kg/body weight) administered subcutaneously to naïve control (+CAP-no-MI), and Group-4: two-week CAP (5mg/Kg/BW) and then subjected to coronary ligation (+CAP-MI-d1) (Figure 1A).
Figure 1: Subacute carprofen (CAP) treatment intensified ‘don’t eat me’ signal and inflammatory response in the infarcted LV post-MI.

A. Study design illustrates subacute treatment of carprofen (CAP) to C57BL/6J mice with pre and post myocardial infarction (MI) time points to study inflammation-resolution nexus. B. LV base, mid-cavities and apex stained with 1% 2,3,5-triphenyltetrazolium chloride. mRNA expression of proinflammatory cytokines C. CD47 (don’t eat me signal) D. TNF-α, E. IL-1b, and F. –CAP and +CAP treated no-MI and post-MI groups. mRNA levels are normalized with hypoxanthine phosphoribosyltransferase 1 (HPRT-1). Values are means ± SEM; n= 5 mice/group *p < 0.05 vs −CAP-no-MI; $ p < 0.05 vs +CAP-no-MI groups (analyzed by two-way ANOVA). G. Table representing CAP effect and MI impact by two-way ANOVA. +CAP and –CAP treated pre-MI and post-MI groups. H. Representative hematoxylin and eosin (H&E) stained 40X left ventricle (LV) images accompanied with 1.25X images from –CAP and +CAP pre and post-MI groups. I. Figure illustrating ‘don’t eat me’ and ‘eat me’ signal. n=6 mice/group; scale bar = 50 μm.
Coronary artery ligation
After CAP both +CAP and control C57BL/6J mice were anaesthetized with a 2.0% isoflurane oxygen mix and injected with 0.015 mg/mL buprenorphine and then subjected ligation surgery as described previously.[14]
Transthoracic echocardiography
Heart function was measured using a Vevo 3100, (VisualSonics Inc.,) under anesthesia (1.5–2% isoflurane) as previously described.[14, 15]
LV function, strain and synchronicity analyses
For LV function, strain and synchronicity analyses, a long axis B-mode image was selected where the walls were clearly visible throughout diastole and systole. Vevo strain analysis allows to measure the speckle tracking-based segmentation of LV into 48 points on the traced LV wall that measures the fractional shortening, ejection fraction, global circumferential strain, global longitudinal strain and segmental synchronicity as described in previous reports.[14]
Necropsy
All four groups; naïve control (−CAP-no-MI), MI-control (–CAP-MI-control), subacute CAP-injected naïve control (+CAP-no-MI), subacute CAP-injected MI group (+CAP-MI-d1) of mice were anesthetized under 2% isofluorane and 100% oxygen in 1:1 ratio mix. Blood was collected from carotid artery 5 minutes post-heparin (4 IU/g: I.P) injection and mainly LV was harvested after perfusion with cardioplegic solution to arrest in diastole and processed for molecular, cellular, and histological analyses, as described previously.[16] [14]
Flow cytometry
Single mononuclear cells were isolated from spleen and LV of −CAP-no-MI, −CAP-MI-d1, +CAP-no-MI and +CAP-MI-d1 were analyzed by flow cytometry as reported previously (FACs strategy supplementary Figure 1).[16]
Neutrophils isolation from LV and spleen
The neutrophils (Ly6G+) in −CAP-no-MI, −CAP-MI-d1, +CAP-no-MI, +CAP-MI-d1 were isolated using magnetic beads, as previously described.[12]
Neutrophils functional (phagocytosis) assay using pHrodo-Red labeled E.Coli
Isolated neutrophils (~1 × 10⁵/m)l from spleen and LV of −CAP-no-MI, −CAP-MI-d1, +CAP-no-MI, +CAP-MI-d1 were incubated in RPMI 1640 with 10% FBS at 37°C with 5% CO2 for 30 min. Prior to the addition pHrodo E.coli bioparticle (Thermo Fisher Scientific, MA), images were taken on KEYENCE BZ-X700 using 40x objective. Cells were then incubated at 37°C with pHrodo E.coli bioparticles as per the manufacturer’s instructions and images were capture at 0, 15, 30 and 60 min to visualize internalization of bacteria by the neutrophils as red.
Inflammation-resolution lipid mediators by mass spectrometry
After necropsy, LV tissue from all four groups; −CAP-no-MI, –CAP-MI-control, +CAP-no-MI and +CAP-MI-d1 was homogenized in 1:9 ratio with 1X PBS (pH 7.4) and centrifuged at 10,000 rpm for 5 min at 4°C. The supernatant was collected, and protein was measured using Bradford kit (Biorad Inc.). PGs and inflammation-resolution markers of lipid mediators were measured using mass spectrometry.[16]
Real-time quantitative PCR for LV and spleen
For quantitative PCR, 2.5 μg total RNA was used to perform reverse transcription using SuperScript Vilo cDNA synthesis Kit (Thermo Fisher Scientific). Quantitative PCR for the Tnf-α (Mm00443258_m1), ccl2 (Mm00441242_m1), Il1b (Mm00434228_m1), ptgs1 (Mm00477214_m1), ptgs-2 (Mm00478374_m1), ephx2 (Mm01313813_m1), alox12 (Mm00545833_m1), alox15 (Mm00507789_m1) and alox5 (Mm01182747_m1) genes were performed using TaqMan probes,as done previously.[16] Gene expression was normalized with hypoxanthine phosphoribosyltransferase-1 (Hprt-1; Mm03024075_m1) as the housekeeping gene. The results were reported as 2^-ΔCT. All the experiments were performed in duplicate with n= 5–6 per group.
COX activity assay
COX-2 activity in the infarcted samples was measured using COX activity assay kit (Cayman# 760151) according to manufacturer’s instruction.
Confocal microscopy of spleen and LV tissue
Immunofluorescence of spleen and LV mid-cavity sections were done, as previously as described.[12]
LV and spleen Terminal deoxynucleotidyl transferase dUTP nick end labeling (TUNEL)
The cell apoptosis in LV and spleen was determined by TUNEL according to the manufacturer’s instructions (Promega, CA). Six micrographs were randomly selected and the numbers of healthy or apoptotic cells were counted.
Spleen and LV multispectral flow cytometry (ImageStream)
Mononuclear cell was isolated from LV and spleen as described in flow cytometry protocol. Surface staining for macrophages was done using F4/80-PERCPCy5.5 (Thermo Fisher Scientific), and neutrophils (Ly6G-pacific blue) (eBioscience, San Diego, CA), for 30 mins on 4°C in dark. Cells were then washed with 1X annexin binding buffer immediately. Afterwards, cells were resuspended in 100ul of 1X annexin binding buffer and 1μl annexin V was added to the sample for 15 min on room temperature. Samples were again washed with 1X annexin binding buffer and resuspended in 100μl containing 1μl of propidium iodide (PI). Lastly, samples were processed using ImageStream X and analyzed with IDEAS 6.2 software (Amnis®).
Statistical analysis
Data was represented as mean and SEM. Statistical analyses were performed using GraphPad prism 7. Two-way Analysis of variance (ANOVA) followed by Turkey’s post-hoc test was used for multiple comparisons of naïve and MI, CAP-treated and non-treated mice at 95% significant intervals. *p<0.05 vs −CAP-no-MI; $p<0.05 vs +CAP-no-MI.
Results
Subacute CAP treatment intensified inflammatory response post-MI
After 2 weeks of CAP treatment, the expression of genes encoding ‘don’t eat me’ signal (CD47) and inflammatory cytokines expression was measured in the LV and compared to +/−CAP naïve controls. Further, 24h post-MI, the +CAP infarcted LV was compared with MI-controls (Figure 1A; study design). Post-necropsy, 2,3,5-triphenyltetrazolium chloride stained pale-white infarcted area indicated successful occlusion-induced myocardial damage and identical cardiac injury (infarct area >45%) in +CAP compared with naïve-controls (Figure 1B; Table 1A). Post-MI, CAP intensified ‘don’t eat me’ signal marker (CD47; 100 fold) expression in the infarcted LV and spleen (15 fold) compared to MI-controls (Figure 1C; spleen data in supplementary figure 2A). CAP treatment in naïve-control (+CAP-no-MI-open column) itself shifted the milieu in LV towards favoring inflammation with an increase in inflammatory cytokines TNF-α (Figure 1D), IL-1β (Figure 1E), and CCL2 (Figure 1F) compared with –CAP naïve-control mice (−CAP-no-MI). Pre-MI, CAP treatment also intensified the proinflammatory cytokines after MI in the infarcted LV in acute healing with an increase of TNF-α (6.5 fold), IL-1β (35 fold), CCL2 (30 fold) (Figure 1D–F; +CAP-MI-d1-filled column) and decrease of MRC-1/CD206 (2 fold decrease; supplementary figure 2B), indicative of an expanded inflammatory response in comparison with MI-d1 control (−CAP-no-MI; supplementary figure 2B). The magnified CAP-mediated inflammatory effect was compared with non-CAP controls and differentiated by two-way analysis of variance post-MI (Figure 1G). Histological analysis in hematoxylin and eosin (H&E) stained LV revealed obvious MI-induced myocardium necrosis and pathological LV dilatation (Figure 1H) in +/−CAP-injected mice compared with naïve-controls (+/−CAP). Thus, subacute CAP treatment to mice magnified ‘don’t eat me’ signal (Figure 1I) and over amplified innate immune response after coronary artery occlusion in acute cardiac injury.
Table 1.
Gravimetric and echocardiography parameters before and after CAP treatment in cardiac pathology compared to controls.
| Table 1A Necropsy parameters | ||||
| Necropsy parameters | −CAP-no-MI | −CAP-MI-d1 | +CAP-no-MI | +CAP-MI-d1 |
| n = | 6 | 8 | 8 | 11 |
| Body weight (g) | 25.3±0.5 | 25.6±0.9 | 25.8±0.8 | 25.6±0.9 |
| LV (mg) | 83.0±1.7 | 103.5±5.0* | 86.6±3.4 | 92.3±3.1*$ |
| LV/BW (mg/g) | 3.3±0.1 | 4.1±0.2* | 3.4±0.1 | 3.6±0.1*$ |
| Right ventricle (mg) | 15.8±1.1 | 14.3±1.3 | 16.0±0.5 | 14.8±0.7 |
| RV mass/ BW | 0.6±0.1 | 0.6±0.1 | 0.6±0.1 | 0.6±0.0 |
| Spleen weight (mg) | 88.8±6.9 | 70.0±16.8 | 75.3±4.5* | 47.1±2.4*$ |
| Spleen/bw | 3.5±0.3 | 2.7±0.6* | 2.9±0.1* | 1.9±0.1*$ |
| Lung mass / body weight (mg/g) | 6.9±0.5 | 9.1±1.8 | 6.9±0.3 | 8.8±0.6* |
| Infarct area | ND | 43.7±1.6 | ND | 53.7±1.2$ |
| Tibia (mm) | 15.8±0.4 | 16.6±0.4 | 16.5±0.2 | 15.5±0.6 |
| Table 1B Echocardiographic parameters | ||||
| Necropsy parameters | −CAP-no-MI | −CAP-MI-d1 | +CAP-no-MI | +CAP-MI-d1 |
| n = | 8 | 8 | 8 | 8 |
| Heart rate (bpm) | 479±8 | 469±21 | 460±11 | 479±46 |
| EDD (mm) | 3.61±0.08 | 4.32±0.20* | 3.91±0.06 | 4.23±0.16*$ |
| ESD (mm) | 2.18±0.11 | 3.97±0.18* | 3.10±0.09* | 3.89±0.23*$ |
| Fractional Shortening % | 39.8±2.0 | 7.9±1.6* | 20.7±1.4* | 8.1±3.8*$ |
| ESV | 54.2±9.5 | 66.8±7.7 | 34.9±2.7* | 55.8±7.7*$ |
| EDV | 79.1±8.8 | 80.5±5.8 | 58.7±3.7* | 68.6±5.0*$ |
| Ejection fraction | 52.3±2.9 | 17.8±4.9* | 40.3±1.9* | 19.0±7.1*$ |
| IVSd (mm) | 0.73±0.03 | 0.59±0.068* | 0.78±0.04 | 0.81±0.02*$ |
| PWTd (mm) | 0.76±0.04 | 0.68±0.08 | 0.76±0.05 | 0.74±0.06 |
| GLS | −18.9±0.3 | −4.7±1.2* | −14.5±0.9* | −4.9±2.3*$ |
| GCS | −29.2±1.8 | −5.9±0.9* | −20.1±2.2* | −6.9±1.7*$ |
| Time to peak | 58.7±3.6 | 50.2±7.9 | 55.7±4.6 | 51.3±3.4 |
Values are mean±SEM. n indicates sample size; LV, Left ventricle; BW. Body weight; RV, Right ventricle; ND=not detected
p< 0.05 vs −CAP-no-MI
p<0.05 vs +CAP-no-MI groups.
Values are mean±SEM; n indicates sample size. bpm, beats per minute; EDD, end-diastolic dimension; ESD, end-systolic dimension; PWTd, Posterior wall thickness; d,diastole;mm, millimeter; GCS, global circumferential strain; GLS, global longitudinal strain
p< 0.05 vs −CAP-no-MI
p<0.05 vs +CAP-no-MI groups.
CAP treatment intensified ‘don’t eat me’ signal CD47 on neutrophils
After observing CAP-mediated intensification of CD47 in the infarcted LV and spleen, we then quantitated leukocytes to delineate which subtype of immune population was expressing CD47. The flow cytometry data revealed that CD47 expression was present on the neutrophils (CD45+/CD11b+/F4/80−/Ly6G+). CAP treatment increased CD47 population pre-MI in spleens compared with –CAP groups (0.01% vs 0.37%). Post-MI, CAP treatment further increased the Ly6G+/CD47+ (0.28% vs 0.94%) population in the spleen compared with –CAP (Figure 2A, left panel). In LV, the CAP-mediated CD47 changes were minimal pre-MI. However, the CD47 population was increased post-MI in +CAP mice (3.05%) compared with –CAP controls (1.82 %), indicating that CAP intensified ‘don’t eat me’ signal on neutrophils, which postponed the cellular and molecular response after cardiac injury that facilitated non-resolving inflammation (Figure 2A, right panel). Since SIRPα is a receptor for ‘don’t eat me’ (CD47) and MerTK is an effector for ‘eat me’ (MFG-E8) signal, we assessed the differential expression of SIRPα and MerTK on the splenic or LV macrophages by using a specialized CD45+/CD11b+/F4/80+/SIRP-α+/MerTK+ gating approach. MerTK subpopulation in splenic macrophages (F4/80+) remained unchanged in +/−CAP and +/−MI groups. However, CAP increased LV SIRP-α subpopulation in naïve-control compared with non-treated group pre-MI (Figure 2B, right panel). The LV macrophages revealed an increase in SIPRα in CAP treated both no-MI and MI-d1 groups, but there was no change in MerTK (Figure 2B, left panel). Next, gene encoding expression of ‘eat me’ (MFG-E8) and ‘don’t eat me’ SIRP-α revealed that MFG-E8 expression decreased in LV and spleen in +CAP-treated groups compared with –CAP groups, (Figure 2C and D) but increased in SIRP-α expression in +CAP-MI-d1 in both the LV and spleen (Figure 2E and F). To validate ‘eat me’ and ‘don’t eat me’ specificity markers on neutrophils, CD47 and MFG-E8 expression were measured in isolated neutrophils from LV and spleen with enhanced CD47 (Figure 2G and 2H) in +CAP-MI-d1, but MFG-E8 expression was diminished, (Figure 2I and 2J) which was suggestive of an amplified ‘don’t eat me’ signal and thereby non-resolving inflammation.
Figure 2: Subacute CAP treatment enhanced CD47 subpopulation on neutrophil in spleen and LV.

Representative flow cytometry (FACs) A. FACs contour plots representing Ly6G+/CD47+ subpopulation from +CAP and –CAP in no-MI and post-MI splenocytes. B. FACs contour plots representing Ly6G+/CD47+ subpopulation from +CAP and –CAP in no-MI and post-MI LV mononuclear cells. Bar graphs representing mRNA expression C. and D. MFG-E8 E. and F SIRP-α in LV and spleen in +CAP and –CAP pre and post-MI. mRNA levels are normalized with HPRT-1. Bar graphs representing mRNA expression in isolated neutrophils from LV and Spleen G. and H. CD47 H. and J MEF-G8 in +CAP and –CAP pre and post-MI. mRNA levels are normalized with GAPDH. n = 4 mice/group Data are means±SEM; *p< 0.05 −CAP vs+CAP
CAP treatment preactivated splenocardiac neutrophils and inflammatory macrophages
The spleen is a major reservoir of leukocytes and responsive to cardiac injury, given that the splenic leukocytes (neutrophils and monocytes) mobilize to the infarcted area to facilitate healing and myocardium repair.[8, 10] Likewise, during infection, splenic leukocytes (neutrophils and macrophages) enable microbe clearance.[17] The detailed flow cytometry analysis revealed impact of CAP treatment on leukocytes population in both spleen and LV pre-MI. After mononuclear cell isolation, the cell viability was assessed by using LIVE/DEAD™ F-fixable blue dead cell stain kit. Splenic viable leukocytes remained unchanged in CAP-treated mice in naïve-controls compared with non-treated naïve-controls (Figure 3A and B). The overall comparison of hematopoietic cells (CD45+) in +CAP and –CAP-treated spleens showed increased CD11b+ monocytes in CAP–injected groups, (Figure 3C and D) which indicated myeloid activation. CAP treatment increased Ly6G+ neutrophils pre-MI in spleens compared with –CAP groups (1.3±0.13% vs 0.07±0.01%) (Figure 3E and F). Splenic total macrophages (F4/80+) population remained unchanged in +CAP and –CAP (Figure 3G and H), however CAP treatment activated pro-inflammatory macrophages (F4/80+/Ly6Chi) in +CAP-injected mice without altering reparative (F4/80+/CD206+ and F4/80+/Ly6Clo) macrophages (Figure 3I through M). Unlike the spleen, the overall cell viability decreased in the LV (38.0±4.0% +CAP-no-MI vs 96.5±0.9%-CAP–no-MI- live population) (Figure 3N and O) with limited changes in CD11b+ monocytes (Figure 3P and Q). Similar to the spleen, CAP treatment activated LV-Ly6G+ neutrophils in +CAP (1.1±0.2%) groups compared with –CAP (0.2±0.4%) groups in LV, (Figure 3R and S) which indicated a pre-activation of inflammatory leukocytes. Unlike its spleen counterpart, the +CAP group displayed a decrease in CD11b+/F4/80+ macrophages (3.1±0.4%) compared with –CAP in LV (6±0.3%), which was indicative of impaired cardiac homeostasis (Figure 3T and U). The macrophage subpopulation in +CAP-injected mice displayed an increase in pro-inflammatory macrophages (F4/80+/Ly6Chi; 0.4±0.04%) compared to –CAP groups (0.08±0.01%) with a decrease F4/80+/Ly6Clo reparative macrophages (Figure 3T through Z). Thus, subacute CAP treatment pre-activated neutrophils in the spleen and decreased total and reparative macrophages in the LV and this indicated a splenocardiac immune dysregulation.
Figure 3: Subacute CAP treatment pre-activated neutrophils and Ly6Chi macrophages in spleen and LV.

Representative flow cytometry (FACs) contour and bar graphs for respective leukocyte population classified based on surface markers A. Contour plots displaying live and dead splenic population gated on UV fluorescence 5440/40 UV-A using LIVE/DEAD™ Fixable blue dead cell stain kit. B. Respective contour graphs in +CAP and –CAP pre-MI. C. contour and D. Respective bar graphs CD11b+ (monocytes); E and F Ly6G+ (neutrophils); G and H. F4/80+ (macrophages); I. and J. F4/80+/CD206+(reparative macrophages); K, L and M. F4/80+/Ly6Clo (reparative macrophages) and F4/80+/Ly6Chi (proinflammatory macrophages) from +CAP and –CAP pre-MI splenocytes. Representative flow cytometry (FACs) N. contour plots O. bar graphs displaying live and dead LV population gated on UV fluorescence 5440/40 UV-A using LIVE/DEAD™ Fixable Blue Dead Cell Stain Kit in +CAP and –CAP pre-MI groups. FACs contour plots and bar graphs representing P. and Q. CD11b+ (monocytes); R and S Ly6G+ (neutrophils); T and U. F4/80+ (macrophages); V. and W. F4/80+/ CD206+(reparative macrophages); X, Y and Z. F4/80+/Ly6Clo (reparative macrophages) and F4/80+/Ly6Chi (proinflammatory macrophages) from +CAP and –CAP pre-MI LV mononuclear cells. n = 4 mice/group Data are means ± SEM; *p< 0.05 −CAP vs +CAP.
CAP facilitated neutrophil swarming in the infarcted LV post-MI
Since cardiac injury initiates splenic leukocyte’s exit and entry to injured myocardium for clearance of dead cells, therefore, next we investigated leukocyte profiling following CAP treatment in the spleen and infarcted LV post-MI (24 h). The splenic depletion of leukocytes was noted using quantitative flow cytometry. We further quantified leukocytes post-MI to understand the impact of CAP-treatment. Like pre-MI, post-MI viable splenic cells remained unchanged in +CAP and –CAP groups (Figure 4A and B). Splenic CD11b+ monocyte was decrease in +CAP group (4±0.7%) compared with -CAP group (9±0.4%) post-MI (Figure 4C and D). As expected, post-MI, the spleen showed a decrease in Ly6G+ cells in the +CAP group compared with –CAP group (3.4±0.5% vs 6±0.04%) (Figure 4E and F) post-MI. Splenic macrophages (F4/80+) and their subpopulation of reparative macrophages (F4/80+/CD206+ and F4/80+/Ly6Chi/lo) were decreased in +CAP-injected mice compared with –CAP mice (Figure 4G–M) post-MI. Unlike the spleen, the LV revealed a decrease in viable leukocytes population in +CAP-MI-d1 (14±0.5%) compared with −CAP-MI-d1 (86±2.0%), (Figure 4N and O) without altering LV-CD11b+ population in +CAP-MI-d1 compared with −CAP-MI-d1 (Figure 4P and Q). CAP treatment significantly increased the amount of neutrophils (Ly6G+: 23±2%) compared with −CAP-MI-d1 which displayed 3.4±0.5% neutrophils, (Figure 4R and S) suggestive of neutrophils swarming post-MI. The LV +CAP-MI-d1 mice had a decreased number of total macrophage (CD11b+/F4/80+) cells (Figure 4T and U). Furthermore, the phenotypic classification of macrophages revealed a decrease in reparative (F4/80+/CD206+, F4/80+/Ly6Clo) in +CAP-MI-d1 with a simultaneous increase in proinflammatory F4/80+/Ly6Chi compared with −CAP-MI-d1 mice (Figure 4V through Z). Together, these findings suggested that subacute CAP treatment dysregulated splenic milieu and toxicated infarcted LV leukocytes, leading to an over-activation of neutrophils with a marked decrease of reparative macrophages in cardiac healing post-MI.
Figure 4: Subacute CAP treatment enhanced leukocytes death with neutrophil swarming in the infarcted LV post-MI.

Representative flow cytometry (FACs) A. contour plots B. bar graphs displaying live and dead splenic population gated on UV fluorescence 5440/40 UV-A using LIVE/DEAD™ Fixable Blue Dead Cell Stain Kit in +CAP and –CAP post-MI groups. FACs contour plots and bar graphs representing C. and D. CD11b+( monocytes); E and F Ly6G+ (neutrophils); G and H. F4/80+ (macrophages); I. and J. F4/80+/ CD206+(reparative macrophages); K, L and M. F4/80+/Ly6Clo (reparative macrophages) and F4/80+/Ly6Chi (proinflammatory macrophages) from +CAP and –CAP post-MI splenocytes. Representative flow cytometry (FACs) N. contour plots O. respective bar graphs displaying live and dead LV population gated on UV fluorescence 5440/40 UV-A using LIVE/DEAD™ Fixable Blue Dead Cell Stain Kit in +CAP and –CAP post-MI groups. FACs contour plots and bar graphs representing P. and Q. CD11b+ (monocytes); R and S Ly6G+ (neutrophils); T and U. F4/80+ (macrophages); V. and W. F4/80+/CD206+ (reparative macrophages); X, Y and Z. F4/80+/Ly6Clo (reparative macrophages) and F4/80+/Ly6Chi (proinflammatory macrophages) from +CAP and –CAP post-MI LV mononuclear cells. n = 4 mice/group Data are means ±SEM; *p< 0.05 –CAP vs +CAP.
CAP treatment defectively over-activated neutrophils thereby cardiac dysfunction and non-resolving inflammation
To determine whether the CAP-stimulated splenic and LV neutrophils were functionally active or defective in spleen and LV, we assessed isolated neutrophil’s ability to phagocytose E. coli (red) in-vitro. The ability of cultured neutrophils to phagocytose bacteria effectively determines the functional capacity. The isolated splenic and LV neutrophils from +CAP-injected mice were pre-activated because the phagocytic capacity was higher at the 60 min mark in naïve-control compared with −CAP group (Figure 5A–B). However at post-MI-d1, the +CAP treated mice splenic neutrophils bacterial phagocytic capacity was decreased compared with –CAP controls. Neutrophils isolated from the LV showed comparable results (Figure 5A–D). Thus, CAP activated neutrophils but impaired their phagocytic capacity, resulting in the failure to engulf E. coli. Thus, CAP-mediated reduction in phagocytic capacity is accountable for non-resolving inflammation post-MI (supplementary figure 3 and 4).
Figure 5: CAP defectively activated neutrophils and impaired cardiac function.

After –CAP and +CAP treatment, isolated neutrophils were incubated with pHrodo-Red labeled E.Coli to determine the phagocytosis pre-MI and post-MI in a time-dependent manner. Neutrophils phagocytosed pHrodo-Red labeled E.Coli as determined by increased red fluorescence in A. spleen B. LV at 60 min time point. Determination of phagocytosis quantitated by number of neutrophils that are pHrodo-Red positive in line graph at 0, 15, 30 and 60 min in C. spleen and D. LV. Data are expressed as means ±SEM; n = 4; *p< 0.05 –CAP vs +CAP. E. LV speckle tracking based on longitudinal B-mode echocardiographic images in +CAP and –CAP pre and post-MI. F. Representative short axis (M-Mode) image of LV in +CAP and –CAP pre and post-MI, indicating wall thinning post-MI in +CAP and –CAP groups. G. Representative longitudinal 3-dimensional strain in +CAP and –CAP pre and post-MI groups. H. LV longitudinal synchronicity images from in +CAP and –CAP pre- and post-MI groups suggesting dysynchrony post-MI due to CAP treatment. n=8 mice/group.
To determine cardiac function, echocardiography images were acquired before CAP treatment, post-CAP treatment and post-MI day 1 (24h), in both the non-CAP and MI-controls. Speckle, tracking-based, blinded analyses revealed that +CAP-MI-d1 mice had anterior base strains that were short (green vector) compared with –CAP-MI-control d1 mice, which was indicative of a CAP-mediated cardiac dysfunction (Figure 5E). Representative M-mode images confirm the loss of posterior wall thickness, indicative of anterolateral infarct and LV dysfunction. This resulted from coronary ligation with robust cardiac injury in +CAP and –CAP mice post-MI (Figure 5F). After CAP treatment but before MI, the cardiac strain differences were confirmed using longitudinal strain measurement; CAP reduced longitudinal strain compared with non-CAP naïve-control. After ischemic injury, CAP pretreatment amplified the strain towards a positive number, suggestive of an impaired strain compared with –CAP-MI-control mice (Figure 5G). CAP-mediated, longitudinal, strain dysfunction corresponds with speckle, tracking-based vector length because post-MI, the infarcted LV function mainly depends on remote anterior base strain and strength. Before MI, subacute CAP treatment led to subtle changes in LV synchronicity, which were amplified and prominent in CAP-MI-d1 mice compared with MI-d1 controls (Figure 5H). CAP-injected mice featured a reduced time-to-peak strain for major LV regions when compared with no-CAP controls (Table 1B). As shown in the synchronicity images, the anterior base (blue line) and posterior base (green line) compensated the LV function because of anterolateral infarction in the MI-d1-control. However, the anterior base region (blue line) was dysfunctional in +CAP-injected mice with movement in a positive direction (Figure 5H). Before MI, the partial dysfunction of strain and dyssynchrony of LV in CAP group was amplified post-MI (Table 1B). Thus, subacute CAP treatment showed: subtle cardiac dysfunction pre-MI, signs of pathological remodeling with an impaired strain reduced contractility of the remote area and regional dyssynchronicity post-MI.
CAP failed to limit PGs and reduced cardioprotective cypoxins post-MI
The primary role of CAP as an NSAID is to block the pyrogenic inflammation which prevents metabolic transformation of arachidonic acid into eicosinoids. Therefore, we measured COX-encoding genes (COX-1 and COX-2) mRNA expression post-CAP, compared the results with non-treated controls, and confirmed their activity by measuring the PGs along with other bioactive lipids in the infarcted LV. Despite CAP being an acclaimed COX-2 inhibitor, the subacute CAP treatment unexpectedly increased COX-1 and −2 expression post-MI in comparison with non-CAP groups (Figure 6A and B). Like the infarcted LV, splenic COX-1 and −2 mRNA expression were also over-amplified after CAP (supplementary figure 5A and B) and LOXs were dysregulated (supplementary figure 5C–E) post-MI. However, as expected CAP treatment decreased COX-2 activity in LV (Figure 6C). Increased COX expression in the infarcted LV was further supported by quantitative analysis of prostanoids (PGD2, PGE2, 15-keto-PGF2α and TXB2) represented in the pie chart. Particularly, PGD2 were increased to 51% in +CAP-no-MI groups in comparison with –CAP no-MI (Figure 6D and E). There was further amplification of PGD2 (~66%) due to redistribution of PGE2, 15-keto-PGF2α and TXB2 in post-MI −CAP-MI-d1 group compared with the −CAP-no-MI group (Figure 6F). Further, +CAP-MI-d1 group displayed ~60% of PGD2 compared with +CAP-no-MI group (Figure 6G). Arachidonic acid is also a substrate for cytochrome P450 (CYP) epoxygenases to biosynthesize cypoxins (epoxyeicosatrienoic acid (EETs) majorly; 5,6-, 8,9-, 11,12-, and 14,15-EET) that facilitate survival and resolution of inflammation in mice and human HF.[12, 18] To answer whether cypoxin biosynthesis was impaired by subacute CAP treatment, we measured mRNA levels of Ephx2, which encodes for soluble epoxide hydrolase, an enzyme that degrades EETs. mRNA expression encoding Ephx2 was lower in MI-d1 group (−CAP and +CAP) compared with no-MI groups (Figure 6H). The levels of 5,6-, 8,9-, 11,12-, and 14,15-EETs were lowered in +CAP-injected mice compared with respective −CAP-no-MI and MI-d1 groups (Figure 6I–L). Thus, subacute CAP treatment failed to control pro-inflammatory PGs and reduced cardioprotective bioactive lipids in the infarcted LV, indicative of non-resolving inflammation in acute HF.
Figure 6: Subacute CAP treatment failed to control pro-inflammatory prostaglandins and disrupt cypoxins in the infarcted LV post-MI.

Bar graphs representing mRNA expression encoding cyclooxygenases (COXs) A. COX-1 and B. COX-2 mRNA levels are normalized with HPRT-1. C. Bar diagram showing percentage COX2 activity in −CAP and +CAP LV pre and post-MI. Pie charts representing prostanoids in D. −CAP-no-MI E. +CAP-no-MI F.−CAP-MI-d1 G. +CAP-MI-d1. Bar graphs representing in LV CYP metabolites H. mRNA expression of epoxide hydrolase 2 (Ephx2) normalized with HPRT-1. I. 11(12)-EpETrE, J 8(9)-EpETrE, K. 14(15)-EpETrE and L. 5(6)-EpETrE in +CAP and –CAP pre and post-MI. The quantification and values are pg/50 mg of infarcted LV tissue. Values are means ± SEM; n= 4 mice/group *p< 0.05 vs −CAP-no-MI; $ p<0.05 vs +CAP-no-MI groups (analyzed by two-way ANOVA).
CAP dysregulated lipid mediators interactome (HETEs and HEPEs) in cardiac healing
Like COX-1 and −2, the LOX pathway also uses arachidonic acid as a substrate to form bioactive lipids in response to injury.[19] Thus, we further analyzed LV mRNA expression of the LOXs (−15, −12 and −5) along with their respective metabolites (HETEs and HEPEs) after CAP treatment. CAP increased LV mRNA expression of Alox15 (16 fold; p<0.05) post-MI compared with the no-MI CAP-injected group (Figure 7A). There was no significant difference noted in mRNA levels of Alox12 (Figure 7B), but Alox5 mRNA expression was increased in response to CAP in both no-MI and MI-d1 groups (Figure 7C). Subacute CAP treatment failed to decrease pro-inflammatory lipids 15-HETE, 12-HETE and 5-HETE in LV post-MI (Figure 7 D–F). EPA-derived, non-enzymatically formed eicosanoids (15-HEPE, 12-HEPE and 5-HEPE) were increased post-MI in both +CAP and –CAP groups. Interestingly, levels of 15-HEPE was higher in +CAP-MI-d1 group compared with −CAP-MI-d1 group in LV (Figures 7G–I). Therefore, CAP treatment interacted to dysregulate LOX-derived HETEs and HEPEs mediators, contributing to the formation of non-resolving milieu in the infarcted LV post-MI.
Figure 7: Subacute CAP treatment dysregulated LOXs thereby biosynthesis of respective lipid mediators post-MI.

Bar graphs representing mRNA expression encoding lipoxygenases (LOXs) A. ALOX15 B. ALOX12 C. ALOX5. mRNA levels are normalized with HPRT-1. Bar graphs representing LOX metabolites in LV D. 15-HETE, E. 12-HETE, F. 5-HETE, G. 15-HEPE, H. 12-HEPE, I. 5-HEPE in +CAP and –CAP pre and post-MI. The quantification and values are pg/50 mg of infarcted LV tissue. Values are means ±SEM; n= 4 mice/group *p < 0.05 vs −CAP-no-MI; $p< 0.05 vs +CAP-no-MI groups (analyzed by two way ANOVA).
CAP treatment pre-activated splenocardiac neutrophils and executed macrophage phagocytosis post-MI
Myeloid cell profiling using flow cytometry suggested a pre-activation of splenic neutrophils and increased leukocyte death in the LV of CAP-injected mice. Next, to validate whether the LV and spleen leukocyte may be stimulated apoptosis/necrosis pathway, therefore sections from the LV mid-cavity and spleen were stained by in-situ TUNEL immunofluorescence. No TUNEL-positive nuclei (green) were noted in naïve-controls LV of +/−CAP-injected mice. The +CAP-no-MI LV display shrunk and condensed nuclei (blue) compared with −CAP-no-MI (Figure 8A- upper panel). The TUNEL+ cells were noted in −CAP-MI-d1 groups. The number of TUNEL positive cells were increased in +CAP-MI-d1, indicating enhanced expressions of apoptosis in the LV due to CAP treatment (Figure 8A-lower panel). CAP-mediated splenic leukocyte death was evidenced pre-MI and post-MI-d1, by an increase in TUNEL+ cells in the region of marginal zone macrophages compared with non-CAP-MI-d1 controls (Figure 8B).
Figure 8: Subacute CAP treatment defectively pre-activated neutrophils that tailored macrophage phagocytosis.

A-B. Immunofluorescence images representing TUNEL positive cells (green) in LV and spleen in –CAP and +CAP no-MI and MI-d1 group. Nuclei are stained with hoechst (blue). C Immunofluorescence images representing F4/80+ (green) and CD169+ in spleen in –CAP and +CAP no-MI and MI-d1 group. D. Representative images from ImageStream analysis showing that Annexin V+ apoptotic cells bind with neutrophils (Ly6G+) and macrophages (F4/80+) in LV and spleen. For TUNEL staining, 2 mice (4–6 different areas) are acquired from spleen and LV. For image stream nearly 1000000 events acquired for each analysis.
Next, we measured immune responsive CD169+ macrophages in the spleen. The spleens from –CAP and +CAP-no-MI and MI-d1 groups were stained for F4/80+ (green) CD169+ (red) macrophages. The control spleen showed that F4/80+ macrophages were localized within CD169+ macrophages (yellow), but CAP treatment moved splenic CD169+ macrophages towards the marginal zone with impaired splenic integrity (Figure 8C upper panel).. The CD169+ cells appeared to be diffused with simultaneous migration towards the germinal center in −CAP-MI-d1 group, but +CAP-MI-d1 the spleen depicted a complete depletion of CD169+ cells (Figure 8C lower panel). These results suggest that CAP lowered CD169+ macrophages, thereby impairing the splenic innate response post-MI, which is essential in order to promote the resolution of inflammation and cardiac repair.
Lastly, pre-activated splenic neutrophils and LV leukocyte death was validated using high resolution ImageStream cytometry. CAP defectively activated neutrophils that phagocytosed macrophages instead of the sequential event of macrophage-based neutrophil efferocytosis. Representative images contain bright field (BF), annexin+ (apoptotic-green), F4/80+ (macrophages-red) and Ly6G+ (neutrophils-purple) and PI (propidium iodide-brown). The cells isolated from the LV of −CAP-no-MI mice showed an absence of annexin+ on Ly6G+ cells, however, the +CAP-no-MI group depicted faint Ly6G+ expression with presence of annexin (Supplementary figure 6A and B). Post-MI-d1 image analysis in –CAP revealed that macrophages phagocytosed annexin+ debris while +CAP-MI-d1 showed that pre-activated neutrophils (dark purple) engulfed macrophages in the LV (Figure 8D- upper panels). The spleen displayed neutrophils eating apoptotic bodies in −CAP-MI-d1 and +CAP-MI-d1 groups (Figure 8D lower panels). Thus, high resolution ImageStream and microscopy-based analyses of cellular and molecular events validated that subacute CAP treatment pre-activated neutrophils pre-MI and defectively phagocytosed macrophages, which led to non-resolving inflammation and disruption to cardiac repair.
Discussion
The cardinal immune response is an essential component to clearing out necrotic myocytes during ischemic healing and activating LOX in order to form specialized pro-resolving mediators that are associated with leukocytes’ exit from the spleen and entry into the site of injury.[8, 10] Splenic leukocytes efflux and influx at sites of ischemic injury biosynthesize lipid mediators, is indicative of overlapping inflammatory and resolving responses.[10, 20] To understand the mechanism of adverse events caused by NSAID usage, we determined a series of molecular and cellular events that occur after subacute CAP pretreatment in mice, with a major focus on cardiac function, leukocyte profiling and inflammation-resolution markers. Our results revealed that CAP pretreatment: 1) intensified splenocardiac ‘don’t eat’ me signal (CD47) and cardiac dysfunction; 2) triggered neutrophil-swarming with defectively-activated splenic neutrophils and compromised reparative leukocytes in the infarcted LV; 3) over-activated COXs (COX-1 and COX-2) in spleen and LV without limiting PGs and lowered cardio-protective EETs; and ) intensified the inflammatory phase in the infarcted heart (Figure 8E). The following three CAP-mediated mechanisms were dysregulated in the molecular and cellular process of the innate response, indicative of resolution deficit in cardiac healing.
Primarily, CAP led to over-activation of CD47 in spleen and heart post-MI. Apoptotic myocytes that expressed CD47 interacted with the signal regulatory protein (SIRPα) to activate ‘don’t eat me’ signal’[21, 22] while splenic leukocytes play an important role in clearance of post-MI inflammation in the infarcted LV.[10] Thus, elevated CD47 expression in neutrophils triggered a resistance to neutrophil clearance post-MI. CAP altered the splenic structure, which displayed disorganization in the red pulp and germinal center as well as a depletion of CD169 macrophages in the spleen marginal zone, thus impaired leukocyte profiling and inflammation-resolution along the splenocardiac axis in acute cardiac healing. The spleen is responsive to chronic NSAID use, which leads to the development of splenomegaly in contrast with chemotherapeutic agents such as Adriamycin, which cause the development of splenic contraction with marked alteration in the acute and adaptive arsenal of immune cells.[23, 24] Before MI, CAP defectively activated neutrophils, thereby increasing phagocytic activity. However, in response to MI, CAP decreased reparative neutrophils (Ly6G+/CD206+), thereby resulting in defective phagocytosis of E. coli and reduced reparative macrophages (F4/80+/CD206+Ly6Clow). This is indicative of an immune-suppressive mechanism which is non-essential for cardiac repair during the early phase of inflammation. The spleen is the major source of leukocytes for ischemic-induced damage clearance and biosynthesize specialized pro-resolving mediators such as resolvins, maresins, protectins, and lipoxins at the site of cardiac injury, which impede with CAP treatment.[10] Additionally, CAP advanced the preactivation of neutrophils in the spleen pre-MI and this was confirmed using live and dead cell quantitation. Furthermore, CAP-mediated splenocardiac leukocyte death was validated using TUNEL staining, which showed inflammation resolution deficiency and impeded biosynthesis of cardio-protective cypoxins in mice and humans.[12, 18] Interestingly, splenic macrophage death was mainly in the marginal zone, suggestive of a defective antigen-presenting process to B and or T cells, which is beyond the scope of current investigation. Like CAP, in-vitro Ibuprofen exposure represses mice splenocyte and human peripheral blood monocytes immune potentials as it impairs the biosynthesis of IgM and IgG.[25] Pain-relievers, mainly NSAIDs and selective COX-2 inhibitors (etoricoxib and rofecoxib) are available in a variety of forms. There are diverse outcomes with different pain-relievers such as mefenamic acid, ibuprofen, sulindac, diclofenac sodium, tolmetin, naproxen and feprazone. Specificity and selectivity towards COX-1 and COX-2 activity is the major difference between many NSAIDs and as a result, the integral and sequential components that are dysregulated in T cell signaling is another mechanism of immunosuppression.[26]
The second action of CAP was an inefficient control of PGs and COX-2 in cardiac injury. In pre-clinical studies, the expression of COX-2 is primarily associated with pain, fever, inflammation and atherogenic capacity; however, inhibition of COX-2 promotes cardiovascular risks due to suppression of cardio-protective prostacyclin (PGI2), which demonstrates the stunning complexity of PGs in biology.[27, 28] Additional reports indicated cardioprotection from COX-2-derived mediators such as PGI2 and PGE2.[29, 30] Cardiomyocyte-specific COX-2 deletion in mice impaired exercise tolerance, increased predisposition to arrhythmogenesis and cardiac dysfunction in pressure overload the HF model.[27] Moreover, previously uncovered interactions between COX inhibitors with LOX and CYP pathways were identified and detailed that CAP failed to control the synthesis of PGs. In contrast, CAP reduced EETs and dysregulated the levels of LOX-derived mediators, which is indicative of the negative impact of NSAIDs on leukocytes’ resolution biology.[9] Our findings are in line with other COX-2 inhibitors such as rofecoxib, celecoxib, meloxicam which were shown to reduce levels of cardioprotective EETs in the plasma, kidney and heart in order to facilitate systemic inflammation in drug-disease interaction reports.[31] In contrast, atorvastatin activates COX-2 S-nitrosylation during the innate response through neutrophil-endothelial interactions in order to biosynthesize 13(T)-series resolvins from docosapentaenoic acid to stimulate inflammation-resolution.[32, 33] Because activated immune cells are enriched with COX, LOX, and CYP and use the identical essential fatty acids to form different bioactive mediators depending on the magnitude of injury. The COX-2 inhibitors randomized clinical trial and observational study are alarming that restrict the use of COX-2 inhibitors in cardiac patients. A multi-national project comprised of randomized control trial and observational studies of 7 non-specific pain-killers (diclofenac, ibuprofen, indomethacin, ketorolac, naproxen, nimesulide, and piroxicam) along with selective COX-2 inhibitors (etoricoxib and rofecoxib) showed that taking these medications doubles the risk of HF readmission.[5] Along with presented molecular and cellular results, the PRECISION trial outcome supported the avoidance of NSAIDs, if possible, in cardiac patients.[34]
The third action of CAP is the imbalance of inflammatory and reparative cytokines in cardiac injury. After MI, splenic and cardiac tissue activate cytokines to communicate danger signals with biosynthesis of lipid mediators thereby chemotaxis that varied with external stimuli or milieu such as obesity, hypertension, diabetes and aging.[35, 36] In response to MI, splenic leukocytes receive the inflammatory signal to produce the inflammatory-resolving cytokines in the acute healing process as part of their host defense. However, despite being an anti-inflammatory agent, CAP over-activated proinflammatory cytokines (TNF-α, IL-1β, and CCL2), and decreased the reparative cytokine (Mrc-1/CD206), along with increased leukocyte death in acute healing. Cytokines were targeted in HF therapy, however, the global clinical trial of anti-cytokine therapy (infliximab and etanercept) results (RENAISSANCE in North America, and RECOVER in Europe and Australia) are negative.[37] Recent data indicated that control of specific cytokine therapy may lead to fatal infection as reported in anti-inflammatory therapy trials.[38] Thus, failure of anti-cytokines therapy or pain killer medications/NSAIDs, integrative genesis and temporal activation of cytokines in the spleen and heart before and after MI is an active area of research.
Limitations and perspective
1. Presented data suggests pre-activation of splenic and LV leukocytes after subacute CAP regimen. Therefore, chronic intake of CAP or higher doses may be more potent and further sustain non-resolving inflammation. 2. Because tested in young C57BL/6J male mice, female or other strains of male and female mice will show a differential response. 3. Superimposition of CAP with additional risk factors such as aging, diabetes, hypertension or obesity will provide a differential outcome in the inflammation-resolution nexus. 4. From a translational perspective, the present outcome aligns with the clinical community opinion regarding whether pain-killers should be prescribed instead of over-the-counter in order to limit possible incidences of adverse events.
In summary, our results indicated that a subacute CAP regimen develops non-resolving inflammation and disrupts splenocardiac leukocyte-profiling and leukocyte-derived mediators that impair the inflammation-resolution axis. Thus, long-term studies after CAP treatment are warranted in temporal acute and chronic HF.
Supplementary Material
Fig. S1. Gating strategy for flow cytometry analysis of leukocyte populations in LV and spleen
Fig. S2. Subacute CAP treatment amplified ‘don’t eat me’ signal in spleen with decreased MRC-1/CD206 in infarcted LV post-MI. mRNA expression of A. CD47 (‘don’t eat me’ signal) in spleen B. MRC-1/CD206 in infarcted LV of −CAP and +CAP treated no-MI and post-MI groups. mRNA levels are normalized with hypoxanthine phosphoribosyltransferase 1 (HPRT-1). Values are means ± SEM; n= 5 mice/group *p < 0.05 vs −CAP-no-MI; $ p < 0.05 vs +CAP-no-MI groups (analyzed by two-way ANOVA). C. Table representing CAP effect and MI impact by two-way ANOVA. +CAP and −CAP treated pre-MI and post-MI groups.
Fig. S3: Impact of CAP on splenic neutrophil phagocytosis. After −CAP and +CAP treatment, isolated splenic neutrophils were incubated with pHrodo-Red labeled E.Coli to determine the phagocytosis pre-MI and post-MI from 0 min to 60 min. Neutrophils phagocytosed pHrodo-Red labeled E.Coli as determined by increased red fluorescence at 60 min time point. The experiment was done in duplicates. Images taken on 40x. Total 3–4 fields were taken for each time point.
Fig. S4: Impact of CAP on LV neutrophil phagocytosis. After −CAP and +CAP treatment, isolated LV neutrophils were incubated with pHrodo-Red labeled E.Coli to determine the phagocytosis pre-MI and post-MI from 0 min to 60 min. Neutrophils phagocytosed pHrodo-Red labeled E.Coli as determined by increased red fluorescence at 60 min time point. The experiment was done in duplicates. Images taken on 40x. Total 3–4 fields were taken for each time point.
Fig. S5. Subacute CAP treatment over activated COXs and dysregulated LOXs in spleen post-MI. Bar graphs representing mRNA expression encoding cyclooxygenases (COXs) A. COX-1 and B. COX-2 and lipoxygenases (LOXs) C. ALOX5 D. ALOX12 E. ALOX15. mRNA levels are normalized with HPRT-1. Values are means ±SEM; n= 4 mice/group *p< 0.05 vs −CAP-no-MI; $ p<0.05 vs +CAP-no-MI groups (analyzed by two-way ANOVA).
Fig. S6. Representative images from ImageStream analysis were selected for focus, size, and aspect ratios, which are labeled for the phenotypes analyzed: Annexin (apoptotic cells; green), dead cells (orange), F4/80+ (macrophages, red), or Ly6G+ (neutrophil; purple), and all channels merged with and without brightfield (BF) in LV and spleen of −CAP-no-MI and +CAP-no-MI groups. n=2 mice/group. For Image stream nearly 1 million events acquired for each analysis.
Acknowledgement
This work was supported in part by National Institutes of Health [AT006704 and HL132989] and The University of Alabama at Birmingham (UAB) Pittman scholar award to G.V.H., American Heart Association postdoctoral fellowship [POST31000008] to V.K.
List of non-standard abbreviations
- COX
cyclooxygenase
- LOX
lipoxygenase
- CYP
cytochromes P450
- AA
arachidonic acid
- PDE2
prostaglandin E2
- PGD2
prostaglandin D2
- TXB2
thromboxane B2
- CAP
carprofen
- NSAIDs
non-steroidal anti-inflammatory drugs
- MI
myocardial infarction
- LV
left ventricle
- EET
epoxyeicosatrienoic acid (EETs)
Footnotes
Conflict of interest disclosure
None.
References
- 1.Ricciotti E and FitzGerald GA (2011) Prostaglandins and inflammation. Arteriosclerosis, thrombosis, and vascular biology 31, 986–1000. [DOI] [PMC free article] [PubMed] [Google Scholar]
- 2.Kain V, Prabhu SD, Halade GV (2014) Inflammation revisited: inflammation versus resolution of inflammation following myocardial infarction. Basic research in cardiology 109, 444. [DOI] [PubMed] [Google Scholar]
- 3.Wolfe MM, Lichtenstein DR, Singh G (1999) Gastrointestinal toxicity of nonsteroidal antiinflammatory drugs. The New England journal of medicine 340, 1888–99. [DOI] [PubMed] [Google Scholar]
- 4.Garcia Rodriguez LA, Tacconelli S, Patrignani P (2008) Role of dose potency in the prediction of risk of myocardial infarction associated with nonsteroidal anti-inflammatory drugs in the general population. Journal of the American College of Cardiology 52, 1628–36. [DOI] [PubMed] [Google Scholar]
- 5.Arfe A, Scotti L, Varas-Lorenzo C, Nicotra F, Zambon A, Kollhorst B, Schink T, Garbe E, Herings R, Straatman H, Schade R, Villa M, Lucchi S, Valkhoff V, Romio S, Thiessard F, Schuemie M, Pariente A, Sturkenboom M, Corrao G (2016) Non-steroidal anti-inflammatory drugs and risk of heart failure in four European countries: nested case-control study. BMJ (Clinical research ed.) 354, i4857. [DOI] [PubMed] [Google Scholar]
- 6.Bally M, Dendukuri N, Rich B, Nadeau L, Helin-Salmivaara A, Garbe E, Brophy JM (2017) Risk of acute myocardial infarction with NSAIDs in real world use: bayesian meta-analysis of individual patient data. BMJ (Clinical research ed.) 357, j1909. [DOI] [PMC free article] [PubMed] [Google Scholar]
- 7.Antman EM, Bennett JS, Daugherty A, Furberg C, Roberts H, Taubert KA (2007) Use of nonsteroidal antiinflammatory drugs: an update for clinicians: a scientific statement from the American Heart Association. Circulation 115, 1634–42. [DOI] [PubMed] [Google Scholar]
- 8.Swirski FK, Nahrendorf M, Etzrodt M, Wildgruber M, Cortez-Retamozo V, Panizzi P, Figueiredo JL, Kohler RH, Chudnovskiy A, Waterman P, Aikawa E, Mempel TR, Libby P, Weissleder R, Pittet MJ (2009) Identification of splenic reservoir monocytes and their deployment to inflammatory sites. Science (New York, N.Y.) 325, 612–6. [DOI] [PMC free article] [PubMed] [Google Scholar]
- 9.Serhan CN (2014) Pro-resolving lipid mediators are leads for resolution physiology. Nature 510, 92–101. [DOI] [PMC free article] [PubMed] [Google Scholar]
- 10.Halade GV, Norris PC, Kain V, Serhan CN, Ingle KA (2018) Splenic leukocytes define the resolution of inflammation in heart failure. Science signaling 11. [DOI] [PMC free article] [PubMed] [Google Scholar]
- 11.De Caterina R (2011) n-3 fatty acids in cardiovascular disease. The New England journal of medicine 364, 2439–50. [DOI] [PubMed] [Google Scholar]
- 12.Kain V, Ingle KA, Kabarowski J, Barnes S, Limdi NA, Prabhu SD, Halade GV (2018) Genetic deletion of 12/15 lipoxygenase promotes effective resolution of inflammation following myocardial infarction. Journal of molecular and cellular cardiology 118, 70–80. [DOI] [PMC free article] [PubMed] [Google Scholar]
- 13.Halade GV, Kain V, Ingle KA, Prabhu SD (2017) Interaction of 12/15-lipoxygenase with fatty acids alters the leukocyte kinetics leading to improved postmyocardial infarction healing. American journal of physiology. Heart and circulatory physiology 313, H89–h102. [DOI] [PMC free article] [PubMed] [Google Scholar]
- 14.Halade GV, Kain V, Ingle KA (2018) Heart functional and structural compendium of cardiosplenic and cardiorenal networks in acute and chronic heart failure pathology. American journal of physiology. Heart and circulatory physiology 314, H255–h267. [DOI] [PMC free article] [PubMed] [Google Scholar]
- 15.Lindsey ML, Kassiri Z, Virag JAI, de Castro Bras LE, Scherrer-Crosbie M (2018) Guidelines for measuring cardiac physiology in mice. American journal of physiology. Heart and circulatory physiology 314, H733–h752. [DOI] [PMC free article] [PubMed] [Google Scholar]
- 16.Halade GV, Kain V, Black LM, Prabhu SD, Ingle KA (2016) Aging dysregulates D- and E-series resolvins to modulate cardiosplenic and cardiorenal network following myocardial infarction. Aging 8, 2611–2634. [DOI] [PMC free article] [PubMed] [Google Scholar]
- 17.Deniset JF and Surewaard BG (2017) Splenic Ly6G(high) mature and Ly6G(int) immature neutrophils contribute to eradication of S. pneumoniae. The Journal of experimental medicine 214, 1333–1350. [DOI] [PMC free article] [PubMed] [Google Scholar]
- 18.Oni-Orisan A, Edin ML, Lee JA, Wells MA, Christensen ES, Vendrov KC, Lih FB, Tomer KB, Bai X, Taylor JM, Stouffer GA, Zeldin DC, Lee CR (2016) Cytochrome P450-derived epoxyeicosatrienoic acids and coronary artery disease in humans: a targeted metabolomics study. Journal of lipid research 57, 109–19. [DOI] [PMC free article] [PubMed] [Google Scholar]
- 19.Serhan CN (2002) Lipoxins and aspirin-triggered 15-epi-lipoxin biosynthesis: an update and role in anti-inflammation and pro-resolution. Prostaglandins & other lipid mediators 68–69, 433–55. [DOI] [PubMed] [Google Scholar]
- 20.Serhan CN, Brain SD, Buckley CD, Gilroy DW, Haslett C, O’Neill LA, Perretti M, Rossi AG, Wallace JL (2007) Resolution of inflammation: state of the art, definitions and terms. FASEB journal : official publication of the Federation of American Societies for Experimental Biology 21, 325–32. [DOI] [PMC free article] [PubMed] [Google Scholar]
- 21.Zhang S, Yeap XY, DeBerge M, Naresh NK, Wang K, Jiang Z, Wilcox JE, White SM, Morrow JP, Burridge PW, Procissi D, Scott EA, Frazier W, Thorp EB (2017) Acute CD47 Blockade During Ischemic Myocardial Reperfusion Enhances Phagocytosis-Associated Cardiac Repair. JACC. Basic to translational science 2, 386–397. [DOI] [PMC free article] [PubMed] [Google Scholar]
- 22.Poon IK, Lucas CD, Rossi AG, Ravichandran KS (2014) Apoptotic cell clearance: basic biology and therapeutic potential. Nature reviews. Immunology 14, 166–80. [DOI] [PMC free article] [PubMed] [Google Scholar]
- 23.Petroianu A (2007) Drug-induced splenic enlargement. Expert opinion on drug safety 6, 199–206. [DOI] [PubMed] [Google Scholar]
- 24.Evans AR, Miriyala S, St Clair DK, Butterfield DA, Robinson RA (2012) Global effects of adriamycin treatment on mouse splenic protein levels. Journal of proteome research 11, 1054–64. [DOI] [PubMed] [Google Scholar]
- 25.Bancos S, Bernard MP, Topham DJ, Phipps RP (2009) Ibuprofen and other widely used non-steroidal anti-inflammatory drugs inhibit antibody production in human cells. Cellular immunology 258, 18–28. [DOI] [PMC free article] [PubMed] [Google Scholar]
- 26.Paccani SR, Boncristiano M, Ulivieri C, D’Elios MM, Del Prete G, Baldari CT (2002) Nonsteroidal anti-inflammatory drugs suppress T-cell activation by inhibiting p38 MAPK induction. The Journal of biological chemistry 277, 1509–13. [DOI] [PubMed] [Google Scholar]
- 27.Wang D, Patel VV, Ricciotti E, Zhou R, Levin MD, Gao E, Yu Z, Ferrari VA, Lu MM, Xu J, Zhang H, Hui Y, Cheng Y, Petrenko N, Yu Y, FitzGerald GA (2009) Cardiomyocyte cyclooxygenase-2 influences cardiac rhythm and function. Proceedings of the National Academy of Sciences of the United States of America 106, 7548–52. [DOI] [PMC free article] [PubMed] [Google Scholar]
- 28.Hui Y, Ricciotti E, Crichton I, Yu Z, Wang D, Stubbe J, Wang M, Pure E, FitzGerald GA (2010) Targeted deletions of cyclooxygenase-2 and atherogenesis in mice. Circulation 121, 2654–60. [DOI] [PMC free article] [PubMed] [Google Scholar]
- 29.Shinmura K, Tang XL, Wang Y, Xuan YT, Liu SQ, Takano H, Bhatnagar A, Bolli R (2000) Cyclooxygenase-2 mediates the cardioprotective effects of the late phase of ischemic preconditioning in conscious rabbits. Proceedings of the National Academy of Sciences of the United States of America 97, 10197–202. [DOI] [PMC free article] [PubMed] [Google Scholar]
- 30.Shinmura K, Kodani E, Xuan YT, Dawn B, Tang XL, Bolli R (2003) Effect of aspirin on late preconditioning against myocardial stunning in conscious rabbits. Journal of the American College of Cardiology 41, 1183–94. [DOI] [PubMed] [Google Scholar]
- 31.Aghazadeh-Habashi A, Asghar W, Jamali F (2018) Drug-Disease Interaction: Effect of Inflammation and Nonsteroidal Anti-Inflammatory Drugs on Cytochrome P450 Metabolites of Arachidonic Acid. Journal of pharmaceutical sciences 107, 756–763. [DOI] [PubMed] [Google Scholar]
- 32.Dalli J, Chiang N, Serhan CN (2015) Elucidation of novel 13-series resolvins that increase with atorvastatin and clear infections. Nature medicine 21, 1071–5. [DOI] [PMC free article] [PubMed] [Google Scholar]
- 33.Atar S, Ye Y, Lin Y, Freeberg SY, Nishi SP, Rosanio S, Huang MH, Uretsky BF, Perez-Polo JR, Birnbaum Y (2006) Atorvastatin-induced cardioprotection is mediated by increasing inducible nitric oxide synthase and consequent S-nitrosylation of cyclooxygenase-2. American journal of physiology. Heart and circulatory physiology 290, H1960–8. [DOI] [PubMed] [Google Scholar]
- 34.Pepine CJ and Gurbel PA (2017) Cardiovascular safety of NSAIDs: Additional insights after PRECISION and point of view. Clinical cardiology 40, 1352–1356. [DOI] [PMC free article] [PubMed] [Google Scholar]
- 35.Lopez EF, Kabarowski JH, Ingle KA, Kain V, Barnes S, Crossman DK, Lindsey ML, Halade GV (2015) Obesity superimposed on aging magnifies inflammation and delays the resolving response after myocardial infarction. American journal of physiology. Heart and circulatory physiology 308, H269–80. [DOI] [PMC free article] [PubMed] [Google Scholar]
- 36.Halade GV and Kain V (2017) Obesity and Cardiometabolic Defects in Heart Failure Pathology. Comprehensive Physiology 7, 1463–1477. [DOI] [PMC free article] [PubMed] [Google Scholar]
- 37.Bachetti T, Comini L, Pasini E, Ferrari R (2004) Anti-cytokine therapy in chronic heart failure: new approaches and unmet promises. European Heart Journal Supplements 6, F16–F21. [Google Scholar]
- 38.Ridker PM, Everett BM, Thuren T, MacFadyen JG, Chang WH, Ballantyne C, Fonseca F, Nicolau J, Koenig W, Anker SD, Kastelein JJP, Cornel JH, Pais P, Pella D, Genest J, Cifkova R, Lorenzatti A, Forster T, Kobalava Z, Vida-Simiti L, Flather M, Shimokawa H, Ogawa H, Dellborg M, Rossi PRF, Troquay RPT, Libby P, Glynn RJ, Group CT (2017) Antiinflammatory Therapy with Canakinumab for Atherosclerotic Disease. The New England journal of medicine 377, 1119–1131. [DOI] [PubMed] [Google Scholar]
Associated Data
This section collects any data citations, data availability statements, or supplementary materials included in this article.
Supplementary Materials
Fig. S1. Gating strategy for flow cytometry analysis of leukocyte populations in LV and spleen
Fig. S2. Subacute CAP treatment amplified ‘don’t eat me’ signal in spleen with decreased MRC-1/CD206 in infarcted LV post-MI. mRNA expression of A. CD47 (‘don’t eat me’ signal) in spleen B. MRC-1/CD206 in infarcted LV of −CAP and +CAP treated no-MI and post-MI groups. mRNA levels are normalized with hypoxanthine phosphoribosyltransferase 1 (HPRT-1). Values are means ± SEM; n= 5 mice/group *p < 0.05 vs −CAP-no-MI; $ p < 0.05 vs +CAP-no-MI groups (analyzed by two-way ANOVA). C. Table representing CAP effect and MI impact by two-way ANOVA. +CAP and −CAP treated pre-MI and post-MI groups.
Fig. S3: Impact of CAP on splenic neutrophil phagocytosis. After −CAP and +CAP treatment, isolated splenic neutrophils were incubated with pHrodo-Red labeled E.Coli to determine the phagocytosis pre-MI and post-MI from 0 min to 60 min. Neutrophils phagocytosed pHrodo-Red labeled E.Coli as determined by increased red fluorescence at 60 min time point. The experiment was done in duplicates. Images taken on 40x. Total 3–4 fields were taken for each time point.
Fig. S4: Impact of CAP on LV neutrophil phagocytosis. After −CAP and +CAP treatment, isolated LV neutrophils were incubated with pHrodo-Red labeled E.Coli to determine the phagocytosis pre-MI and post-MI from 0 min to 60 min. Neutrophils phagocytosed pHrodo-Red labeled E.Coli as determined by increased red fluorescence at 60 min time point. The experiment was done in duplicates. Images taken on 40x. Total 3–4 fields were taken for each time point.
Fig. S5. Subacute CAP treatment over activated COXs and dysregulated LOXs in spleen post-MI. Bar graphs representing mRNA expression encoding cyclooxygenases (COXs) A. COX-1 and B. COX-2 and lipoxygenases (LOXs) C. ALOX5 D. ALOX12 E. ALOX15. mRNA levels are normalized with HPRT-1. Values are means ±SEM; n= 4 mice/group *p< 0.05 vs −CAP-no-MI; $ p<0.05 vs +CAP-no-MI groups (analyzed by two-way ANOVA).
Fig. S6. Representative images from ImageStream analysis were selected for focus, size, and aspect ratios, which are labeled for the phenotypes analyzed: Annexin (apoptotic cells; green), dead cells (orange), F4/80+ (macrophages, red), or Ly6G+ (neutrophil; purple), and all channels merged with and without brightfield (BF) in LV and spleen of −CAP-no-MI and +CAP-no-MI groups. n=2 mice/group. For Image stream nearly 1 million events acquired for each analysis.