

Supplemental Digital Content is available in the text.
Keywords: glycolysis, metabolism, mitochondria, myocytes, smooth muscle, pulmonary artery
Objective:
NFU1 is a mitochondrial iron-sulfur scaffold protein, involved in iron-sulfur assembly and transfer to complex II and LAS (lipoic acid synthase). Patients with the point mutation NFU1G208C and CRISPR/CAS9 (clustered regularly interspaced short palindromic repeats/clustered regularly interspaced short palindromic repeat–associated 9)-generated rats develop mitochondrial dysfunction leading to pulmonary arterial hypertension. However, the mechanistic understanding of pulmonary vascular proliferation due to a single mutation in NFU1 remains unresolved.
Approach and Results:
Quantitative proteomics of isolated mitochondria showed the entire phenotypic transformation of NFU1G206C rats with a disturbed mitochondrial proteomic landscape, involving significant changes in the expression of 208 mitochondrial proteins. The NFU1 mutation deranged the expression pattern of electron transport proteins, resulting in a significant decrease in mitochondrial respiration. Reduced reliance on mitochondrial respiration amplified glycolysis in pulmonary artery smooth muscle cell (PASMC) and activated GPD (glycerol-3-phosphate dehydrogenase), linking glycolysis to oxidative phosphorylation and lipid metabolism. Decreased PDH (pyruvate dehydrogenase) activity due to the lipoic acid shortage is compensated by increased fatty acid metabolism and oxidation. PASMC became dependent on extracellular fatty acid sources due to upregulated transporters such as CD36 (cluster of differentiation 36) and CPT (carnitine palmitoyltransferase)-1. Finally, the NFU1 mutation produced a dysregulated antioxidant system in the mitochondria, leading to increased reactive oxygen species levels. PASMC from NFU1 rats showed apoptosis resistance, increased anaplerosis, and attained a highly proliferative phenotype. Attenuation of mitochondrial reactive oxygen species by mitochondrial-targeted antioxidant significantly decreased PASMC proliferation.
Conclusions:
The alteration in iron-sulfur metabolism completely transforms the proteomic landscape of the mitochondria, leading toward metabolic plasticity and redistribution of energy sources to the acquisition of a proliferative phenotype by the PASMC.
Highlights.
The G206C mutation in NFU1 significantly alters the mitochondrial proteome.
NFU1 mutation remarkably decreased mitochondrial respiration and increased glycolysis.
NFU1 mutation adversely increases oxidative stress, apoptosis resistance, and proliferation rates.
The study highlights the role of iron-sulfur clusters in pulmonary arterial hypertension.
Pulmonary arterial hypertension (PAH) is a multifactorial disease with increased proliferation in pulmonary vascular cells, leading to increased pulmonary pressure and right-sided heart failure.1–3 There is a strong correlation between mitochondrial dysfunction and PAH, which is supported by extensive scientific research reported in the literature.4–8 Several mitochondrial proteins contain iron-sulfur (Fe-S) clusters and are majorly involved in energy metabolism, making them indispensable to cellular function.9 The transfer of Fe-S clusters to client proteins such as mitochondrial complex 2 and LAS (lipoic acid synthase) is mediated by NFU1.10 Importantly, mutations in the human NFU1 protein are shown to be associated with PAH and multiple mitochondrial dysfunctions syndrome 1.10 Also, abnormalities in Fe-S cluster transfer to client proteins have been shown to be associated with cardiovascular diseases.10,11 We recently established that the G206C mutation in NFU1 in rats demonstrates a similar PAH pathology as found in humans with the NFU1G208C mutation,12 making it the first humanized genetic rat preclinical model of PAH.13 It was also recently highlighted that there needs to be further investigation into PAH in the context of Fe-S biology.13 The loss in Fe-S clusters has recently been shown to induce a glycolytic switch in cells, ultimately leading to PAH.14,15 Also, our recent work demonstrated that introducing human NFU1G206C mutation in rats is sufficient to induce spontaneous PAH.12 However, understanding the role of Fe-S clusters in PAH at the cellular level has been elusive due to a lack of the appropriate cell culture models. In the current study, we examine mitochondrial function and metabolism in primary pulmonary artery smooth muscle cells (PASMCs) derived from rats with a mutation in the whole animal using the CRISPR/Cas9 (clustered regularly interspaced short palindromic repeats/clustered regularly interspaced short palindromic repeat–associated 9) gene-editing technique. This approach ensured that the effects were preserved at the cellular level, presenting a unique opportunity to closely analyze the cellular mechanisms of the single mutation. We found that the occurrence of the disease in the NFU1 model followed a similar pattern (male:female, 1:3) as in patients12 and, in the present study, we selected female rats for isolation of mitochondria and smooth muscle cells due to higher association of the disease with this sex.12 Our data provide new insights into the molecular events driving PAH pathogenesis at the cellular level.
Materials and Methods
Data Availability Disclosure
The data that support the findings of this study are available from the corresponding author upon reasonable request.
Animals
Point mutation (G206C, GGC to TGC) in the Sprague Dawley rat model at the Nfu1 locus was done as described previously.12 The rats were bred in-house, and the colony was kept in the University Animal Care at the University of Arizona. The animals were kept in a 12-hour light-dark cycle and received standard rodent food and water ad lib. Female rats at the age of 10 to 12 weeks were used for this study. All experimental procedures were approved by the University of Arizona Institutional Animal Care and Use Committee. The study has adhered to the preclinical research guidelines in PAH approved by the World Symposium association of PH.16 We used only female animals for all experiments in the current study because NFU1 mutation predominantly affects females, and female patients have a higher occurrence of PAH.
Mitochondrial Isolation
Mitochondrial isolations were performed as described previously.12 In brief, rat livers were excised and suspended in cold PBS. The mitochondria were then isolated by homogenizing the liver in ice-cold isolation buffer (50 mmol/L Tris/HCl, pH 7.4, 250 mmol/L sucrose, 5 mmol/L EDTA, and protease inhibitors) using the Fisher homogenizer 850 at 10 000 RPM for 1 minute followed by gentle shaking in the UltraCruz Shaker at 0 °C for 10 minutes. The samples were then subject to multiple stages of centrifugation at 700, 7800, and 12 000 g to finally pellet the mitochondria. The mitochondria were aliquoted, quick-frozen, and stored at −80 °C for further analyses.
Mass Spectrometry
In-Solution Tryptic Digestion of Isolated Mitochondria
To determine changes in the mitochondrial proteome associated with the NFU1G206C mutation, 50 µL of Membrane Solubilization Buffer (catalog No. 1862783; Thermo Scientific) was added to isolated mitochondria and incubated on ice for 30 minutes. Forty microliters of clarified supernatant was collected and subjected to in-solution tryptic digestion. Sample volumes were made to 100 µL using Membrane Solubilization Buffer, supplemented with dithiothreitol at a final concentration of 5 mmol/L, and incubated at 56 °C for 30 minutes. Samples were cooled to room temperature for 10 minutes and subsequently incubated with 15 mmol/L acrylamide for 30 minutes at room temperature while protected from light. The samples were supplemented with 6 volumes of prechilled 100% acetone and incubated for 1 hour at −20 °C to precipitate proteins followed by centrifugation at 16 000g for 10 minutes at 4 °C. Four hundred microliters of prechilled 90% acetone was added to the protein pellet and vortexed, followed by centrifugation at 16 000g for 5 minutes at 4 °C. The remaining acetone was removed, and the protein pellets were air-dried for 2 to 3 minutes. The protein pellet was resuspended in 50 µL of digestion buffer from the Pierce mass spectrometry (MS) Sample Prep Kit for Cultured Cells (catalog No. 84840; Thermo Scientific), and 2 µg of Lys-C was added to each sample and incubated at 37 °C for 2 hours while shaking at 300 rpm. Afterward, 50 µL of 50 mmol/L ammonium bicarbonate and 2 µg of trypsin was added to each sample and incubated at 37 °C overnight while shaking at 300 rpm. The samples were frozen at −80 °C for 10 minutes to stop the digestion. The samples were dried down, resuspended in 15 µL 0.1% heptafluorobutyric acid/4% fatty acid (FA; v/v), and incubated at room temperature for 15 minutes. The samples were subjected to desalting as described previously.17 The dried peptides were resuspended in 6 µL of 0.1% FA (v/v), sonicated for 1 minute, and 2.5 µL of the final sample was analyzed by mass spectrometry.
Mass Spectrometry and Data Processing
HPLC-ESI-MS/MS was performed in positive ion mode on a Thermo Scientific Orbitrap Fusion Lumos tribrid mass spectrometer fitted with an EASY-Spray source (Thermo Scientific, San Jose, CA). NanoLC was performed using a Thermo Scientific UltiMate 3000 RSLCnano system with an EASY-Spray C18 LC column (catalog No. ES803; Thermo Scientific; 50 cm×75 μm inner diameter, packed with PepMap RSLC C18 material, 2 µm); loading phase for 15 minutes at 0.300 µL/min; mobile phase, a linear gradient of 1% to 34% Buffer B in 119 minutes at 0.220 µL/min, followed by a step to 95% Buffer B over 4 minutes at 0.220 µL/min, hold 5 minutes at 0.250 µL/min, and then a step to 1% Buffer B over 5 minutes at 0.250 µL/min and a final hold for 10 minutes (total run, 159 minutes); Buffer A=0.1% FA/H2O; Buffer B=0.1% FA in 80% ACN. All solvents were liquid chromatography–mass spectrometry grade. Spectra were acquired using XCalibur, version 2.3 (Thermo Scientific). A top-speed data-dependent MS/MS analysis was performed. Dynamic exclusion was enabled with a repeat count of 1, a repeat duration of 30 s, and an exclusion duration of 60 s. Tandem mass spectra were extracted from Xcalibur RAW files, and charge states were assigned using the ProteoWizard 2.1.x msConvert script using the default parameters. The fragment mass spectra were then searched against the Rattus SwissProt_2018_11 database (8068 entries) using Mascot (Matrix Science; London, United Kingdom; version 2.4) using the default probability cutoff score. The search variables that were used were 10 ppm mass tolerance for precursor ion masses and 0.5 Da for product ion masses; digestion with trypsin; a maximum of 2 missed tryptic cleavages; variable modifications of oxidation of methionine; and phosphorylation of serine, threonine, and tyrosine. Cross-correlation of Mascot search results with X! Tandem was accomplished with Scaffold (version Scaffold_4.8.7; Proteome Software, Portland, OR). Probability assessment of peptide assignments and protein identifications were made through the use of Scaffold. Only peptides with ≥95% probability were considered. Reported peptide FDR rates from Scaffold ranged from 0.1% to 0.2%. The mass spectrometry proteomics data have been deposited to the ProteomeXchange Consortium via the PRIDE (Proteomics Identifications Database)18,19 partner repository with the dataset identifier PXD015022 and 10.6019/PXD015022. The reviewer account details are as follows: username, reviewer04967@ebi.ac.uk; password, HqUtN2OP.
Label-Free Quantitative Proteomics
Progenesis QI for Proteomics software (version 2.4; Nonlinear Dynamics, Ltd, Newcastle Upon Tyne, United Kingdom) was used to perform ion intensity–based label-free quantification as described previously.20 Of the detected peptides, for further analysis, we selected those with a peptide expression difference between the groups using a significance of P<0.05, as estimated by Progenesis.
Bioinformatics Analysis
The normalized peptide abundance values were exported, and Perseus, version 1.6.2.3, was used to analyze and visualize the data.21,22 The data were converted to Z scores by calculating the mean of each column and then subtracting it from each value in the column. The resultant value was then divided by the Sprague Dawley of the row or column to obtain the final Z score. Unsupervised hierarchical clustering was performed to generate a visual heat map representation; the distance was set to Euclidian and the linkage to average. The maximal numbers of clusters were set to 300. For the principal component analysis, the number of components was set to 5, and for the cutoff, the Benjamini-Hochberg method was used. Database for Annotation, Visualization and Integrated Discovery was used for gene ontology (GO) annotation of the proteins for cellular component (CC), biological processes, and molecular function. Kyoto Encyclopedia of Genes and Genomes was used to visualize the pathways affected.
Rat Primary Pulmonary Arterial Smooth Muscle Cell Isolation
Female rat PASMC was isolated as described previously.23 In brief, the whole lungs or the left lobe was excised from the rat and immediately placed in cold DMEM (Dulbecco’s Modified Eagle Medium) without glutamine and pyruvate (catalog No. 11960-044; Gibco). Under the hood, clean vessels from the lungs were cut and transferred to 2 mL of 1 mg/mL collagenase-2 (catalog No. LS004176; Worthington) in DMEM without glutamine and pyruvate for 20 minutes at 37 °C. The supernatant was aspirated carefully, and 10 mL of warm DMEM with glutamine supplemented (catalog No. 11965-092; Gibco) with 20% fetal bovine serum (catalog No. 25-5144; Geneclone) was added. This was then plated in a 10-cm dish covered with gelatin (catalog No. ES-006-B; Millipore). To ensure adequate cell number, cells were pooled from 5 different rats. Every 2 to 3 days, half of the media was changed to DMEM with glutamine. After 2 to 3 passages, the cells were stained for smooth muscle actin (anti-α-SM actin [1A4], Alexa-Fluor488 ab184675, Abcam, 1:100, isotype IgG2a) using FACS performed in a Novocyte 2000 (ACEA Biosciences) instrument.
Seahorse Assays
Seahorse assays were performed as described previously.23 For the glyco-stress Seahorse assay, isolated PASMCs were seeded in a 24-well Seahorse cell culture microplate at 50 000/well and left overnight to form a monolayer. On the day of the assay, the media was aspirated and cells were incubated at 37 °C in a non-CO2 incubator for 1 hour with 0.5 mL XF base medium (catalog No. 102353-100; Agilent, Santa Clara, CA) supplemented with 2 mmol/L glutamine. Glucose (56 µL, 100 mmol/L), oligomycin (62 µL, 100 µmol/L), and 2- deoxyglucose (69 µL, 500 mmol/L) was added to the flux pack wells (catalog No. 102342-100; Agilent). Extracellular acidification rate was then determined using Seahorse Bioscience XFe24 extracellular flux analyzer (Agilent) according to the manufacturer’s instructions. For the mito-stress assay, cells were prepped similar to the glyco-stress assay with the exception that the XF base incubation media was supplemented with pyruvate (1 mmol/L), glutamine (2 mmol/L), and glucose (10 mmol/L). Oligomycin (56 µL, 10 µmol/L), FCCP (carbonyl cyanide 4-(trifluoromethoxy)phenylhydrazone; 62 µL, 10 µmol/L), and rotenone+antimycin-A (69 µL, 5 µmol/L) were added to the flux pack wells. Oxygen consumption rate was then determined according to the manufacturer’s instructions.
For the FA oxidation (FAO), cells were seeded 2 days before the assay. On the day before the assay, the cells were starved with DMEM with glucose (0.5 mmol/L), GlutaMAX (Thermo Fisher Scientific, Burlington, ONT; 1.0 mmol/L), carnitine (0.5 mmol/L), and 1% fetal bovine serum. On the day of the assay, the cells were washed with the assay buffer (phenol red–free DMEM supplemented with glucose [2.5 mmol/L], carnitine [0.5 mmol/L], and HEPES [5 mmol/L]). The cells were then incubated for 1 hour in a non-CO2 incubator in 375 µL of the assay buffer. Fifteen minutes before the assay, to the respective wells, 37.5 µL of 400 µmol/L etomoxir was added. Just before initiating the assay, to the respective wells, palmitate-bovine serum albumin (BSA) or the BSA control was added (catalog No. 102720-100; Agilent). The standard mito-stress assay described above was then performed on the Seahorse Bioscience XFe24 extracellular flux analyzer. For all assays, the results were normalized with respect to the cell count, measured by flow-cytometry. Chemicals for the Seahorse assays, unless specified, were procured from Sigma-Aldrich (Saint Louis, MO).
Western Blotting
For the analysis of total cell proteins, PASMCs were prepared as described previously.24 In brief, cells were lysed using RIPA (radio-immunoprecipitation assay) with a protease-phosphatase inhibitor cocktail. The cells were then spun at 10000g for 10 minutes, and the supernatant was transferred to a separate tube. Protein concentrations were determined by the Pierce BCA Protein Assay Kit (catalog No. 23225; Thermo Fisher Scientific). The samples were incubated in 6X Laemmli sample buffer (Boston Bioproducts, Inc, Ashland, MA), for 5 minutes at 95 °C. The samples were loaded on 4% to 20% Mini-PROTEAN TGX stain-free gels (Bio-Rad) and were separated electrophoretically. Following this, the proteins were transferred to a membrane using PowerPac Universal power supply and Trans-Blot Turbo transferring system (Bio-Rad Laboratories, Inc). Membranes were blocked with 5% BSA and then probed using the following antibodies: GPD (glycerol-3-phosphate dehydrogenase)-1 (1:1000, sc-376219) and GPD2 (1:1000, sc-393620) from Santa Cruz Biotechnology; HK (hexokinase)-I (1:1000, 2024), HK-II (1:1000, 2867), PKM (pyruvate kinase)-2 (1:1000, 4053), p-AKT (phospho-protein kinase B; 1:1000, 4060), and AKT (1:1000, 4685) from Cell Signaling Technology; PKM1 (1:1000, 15821-1-AP), CPT (carnitine palmitoyltransferase)-1A (1:1000, 15184-1-AP), and ACSL1 (acyl-Co-A synthetase-1; 1:1000, 13989-1-AP) from ProteinTech; PDH (pyruvate dehydrogenase; 1:1000, 8D10E6) from Invitrogen; CD36 (cluster of differentiation 36; 1:1000, MABT399) from Sigma-Aldrich; DEGS1 (delta 4-desaturase, sphingolipid 1; 1:1000, PA5-42741) from Thermo Fisher; and PC (pyruvate carboxylase; 1:1000, Ab229267), MGST1 (microsomal glutathione S-transferase 1; 1:1000, Ab131059), total OXPHOS (oxidative phosphorylation; 1:1000, Ab110413), and SOD (superoxide dismutase)-2 (1:1000, Ab68155) from Abcam. Reactive bands were visualized using the chemiluminescent protocol, recorded with ChemiDoc MP Imaging System (Bio-Rad Laboratories, Inc, Hercules, CA) and analyzed using the Image Lab software. Protein loading was normalized with respect to total sample protein loaded using free stain gels as described previously.25 Some membranes were stripped and reprobed for >1 protein.
PDH Assay
Cultured PASMCs were lysed using RIPA buffer, and the lysate was used for the PDH activity. PDH activity was measured with the PDH Activity Assay Kit (MAK183; Sigma-Aldrich) per the manufacturer protocol. All values were normalized with respect to protein concentrations as determined by the Pierce BCA Protein Assay Kit.
Reactive Oxygen Species Assays
Isolated PASMCs 50 000 cells/well were plated in a 96-well plate and grown overnight to form a monolayer. The cells were then washed in HBSS and incubated in 7.5 µmol/L MitoSox Red (catalog No. M36008; Thermo Fisher Scientific). After 30 minutes of incubation, the cells were washed twice with HBSS and the fluorescence measured on a plate reader with excitation, 510 nm and emission, 580 nm. The Amplex Red Hydrogen Peroxide Assay Kit (catalog No. A22188; Thermo Fisher Scientific) was used to detect hydrogen peroxide generation in cells of isolated PASMCs; 50 000 cells/well in a 96-well plate were grown in phenol red–free DMEM. The media was then extracted, and peroxide was determined in the media according to the manufacturer’s protocol. The Amplex Red combined with horse radish peroxidase is a highly sensitive method that can detect picomolar concentrations of cellular hydrogen peroxide of different sources, including mitochondria, NADPH oxidases, peroxisome-formed peroxides, etc. For all reactive oxygen species (ROS) assays, the final values were adjusted with total protein determined by the Pierce BCA Protein Assay Kit.
Analysis of Apoptosis by Flow Cytometry
Apoptosis levels were measured using the Apoptosis and Necrosis Quantification Kit (catalog No. 30017, Biotium, Fremont, CA) according to the kit protocol. Cells were grown to 80% confluency and then treated with Paraquat (100 µM; Sigma-Aldrich) for 24 hours. The cells were then washed, trypsinized, and then resuspended in 50 µL of reaction mix containing ethidium homodimer and FITC (fluorescein isothiocyanate)-annexin V. After incubation in the dark for 25 minutes at room temperature, the samples were diluted in 200 µL of the kit’s 1X buffer. The apoptosis was then measured by flow cytometry as described previously.26
Cell Growth Assay
PASMCs were seeded at equal densities and allowed to grow for 24 to 72 hours. At each interval, the cells were washed, trypsinized, and cell count was measured by flow cytometry. For the growth rates with mitochondrial-targeted antioxidant mito-tempo (MT), the cells were treated with 500 nM MT for 48 hours. The cells were then washed, trypsinized, and cell count was measured by flow cytometry (NovoCite, Agilent). To optimize MT treatment, the pilot experiment with 20 nM to 100 μM MT for 24 to 72 hours was performed to determine the dose/time response.
Real-Time Cell Growth Kinetics
Real-time cell growth rates were determined using the iCELLigence system (ACEA Biosciences). This is a highly accurate and precise technique to determine real-time changes in electrical impedance, which represents the cell growth index.27 The assays were performed as per to the manufacturer’s instructions. Cell index was normalized as described previously.27 For all studies, cell index was normalized at the 24-hour time point after establishing exponential cell growth. For inhibition of the glycolytic pathway, 2-deoxyglucose (2DG) was added post-adhesion to growing cells.
Statistical Analysis
Statistical calculations were performed using the GraphPad Prism software, version 7.04. The mean value (±SEM) was calculated for all samples, and significance was determined by the unpaired Student t test. P<0.05 was considered to be statistically significant. The data were tested for normality using the GraphPad Prism software and passed the normality test. Therefore, the Student t test was used for statistical analysis. The Grubbs test (extreme studentized deviate) was used to determine the significant outliers before the initiation of the data analysis.
Results
NFU1G206C Mutation Significantly Alters the Mitochondrial Proteome
We recently showed that the NFU1G206C mutation in rats had a significant impact on their vascular physiology, demonstrating PAH phenotype and multiple mitochondrial dysfunctions syndrome 1 similar to the human with NFU1G208C mutation (rat G206C corresponds to human G208C).12 Our studies revealed that a single mutation in a mitochondrial Fe-S cluster scaffold protein results in marked vascular remodeling.12 As mitochondria play a vital role in cell proliferation, we aimed to investigate the impact of the mutation on the mitochondrial proteome with label-free quantitative proteomics on freshly isolated mitochondria from WT (wild type) and homozygous mutant NFU1 rat liver (Figure 1A). Quantitative proteomic analysis of the protein expression changes between WT and homozygous mutant mitochondria identified 2065 total proteins. We selected the rat liver because it constitutes a more homogenous population of hepatocytes as compared with the whole lung cell population, which are made up of endothelial, smooth muscle, fibroblasts, epithelial, and inflammatory cells, etc. This method ensured a more homogenous mitochondrial isolate. Data obtained from the mitochondrial proteome served as a guide to assist the study with further functional investigations into possible metabolic abnormalities in the isolated PASMC from the NFU1 model. Limitations of using liver mitochondria should be assumed; however, there are no available methods to isolate mitochondria precisely from PASMC without passaging them ex vivo in quantities required for quantitative proteomics. Also, key mitochondrial proteins were probed in the isolated PASMC to corroborate the findings from quantitative proteomics. Additionally, the NFU1 mutation in these rats is preserved at the level of the whole organism. Therefore, we expect the mitochondrial proteome to conserve a certain degree of similarity between tissues.
Figure 1.
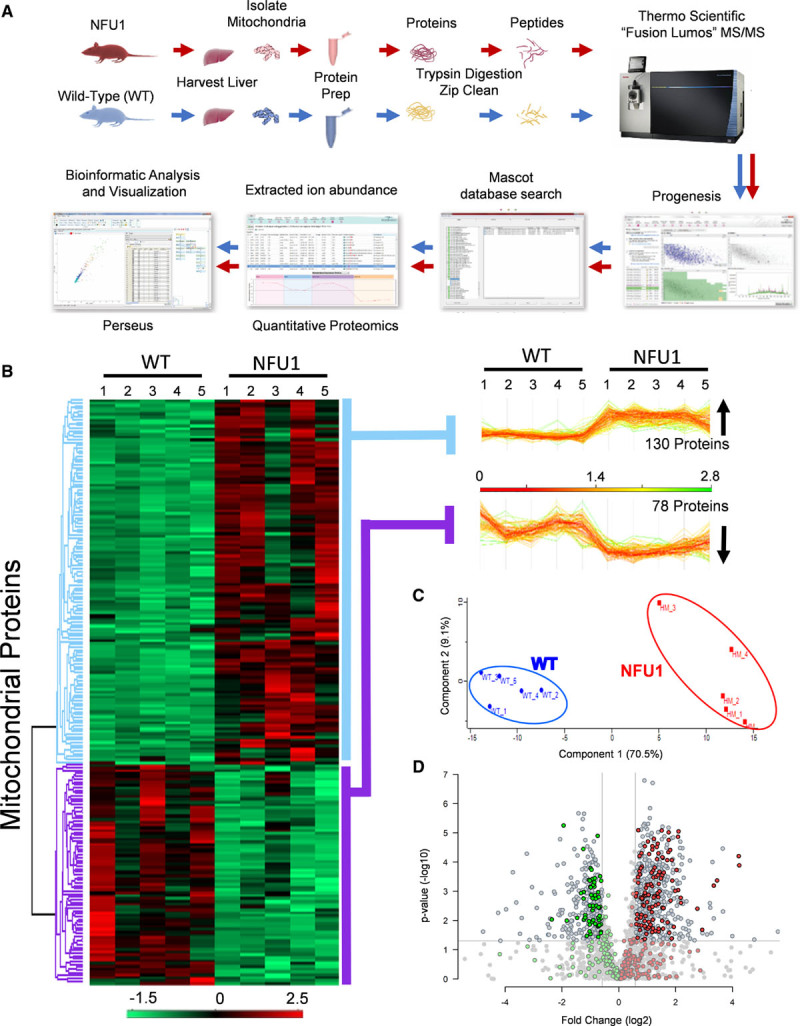
Mitochondrial proteome is markedly altered in NFU1 mutants. A, To identify differences in proteomic expression between WT (wild type) and NFU1G206C homozygous mutant rats, mitochondria were isolated, proteins prepared, subjected to trypsin digestion, and analyzed by tandem mass spectrometry. Quantification of the data was executed in Progenesis QI for proteomics, and peptide/protein identification was performed by database searching with Mascot. Quantification of changes in peptide/protein abundance was performed via extracted ion abundance. The resulting quantitative proteomics data were further processed by Perseus for visual representation of the findings. B, Unbiased hierarchical clustering of the 208 significantly affected mitochondrial proteins in the NFU1 mutant vs WT groups confirmed that the expression patterns across the different individual biological samples cluster together accordingly as WT or NFU1 mutant. A heat map and linked dendrogram of the hierarchical clustering results provide a visual representation of the clustered matrix, and the associated profile plots further reveal consistency within groups of the corresponding protein expression patterns (2 boxes to the right of the heat map). C, Unbiased principal component analysis of the 208 significantly affected proteins revealed that the protein expression differences of the individual biological samples within each group were consistent and no outliers were detected (n=5). D, Volcano plot representing proteins that are over- or underexpressed in WT rats vs NFU1 G206C homozygous mutant rats with the mitochondrial proteins highlighted in green and red.
The expression level of 1028 proteins (representing 50% of total) was significantly different between the two groups, of which 208 proteins were found to be associated with the GO term “cellular component for mitochondrion” (Figure 1B). Unbiased principal component analysis of the 208 significantly affected mitochondrial proteins revealed that the protein expression differences cluster together accordingly as either WT or homozygous mutant, suggesting that the NFU1 mutation significantly altered mitochondria proteome (Figure 1C). Volcano plots for the proteome comparisons between the groups showed significant differences (P [−log 10]) in the differential expression means between the WT and NFU1 animals (Figure 1D). Data filtering (>1.5-fold change; P<0.05) showed 888 proteins to be differentially expressed. We then analyzed the significantly affected mitochondrial proteins for biological process enrichment using GO-based assessment for functional category co-occurrence using the functional annotation tool Database for Annotation, Visualization and Integrated Discovery28 to further investigate the functional role in isolated PASMC.
Multiple Pathways Leading to Proliferation Are Dysregulated in the NFU1 Mutants
In the GO-based assessment using Database for Annotation, Visualization and Integrated Discovery, we focused on pathways closely associated with the mitochondria and were implicated in proliferation. Proteomic evidence from a recent report by Xu Weiling et al29 showed that endothelial cells derived from human PAH patients had deranged mitochondrial respiration, abnormal FA metabolism, enhanced oxidative stress, and apoptosis resistance.29 The study concluded that PAH is characterized by metabolic pathways that are primarily associated with the mitochondria.29 In addition to this, other reports also indicated that dysregulation of oxidative phosphorylation, FA metabolism, oxidative stress, and regulation of apoptosis were significantly associated with PAH and proliferation.6,30–34 Our data identify significantly enriched top 20 pathways in the Kyoto Encyclopedia of Genes and Genomes and the top 30 processes in the GO pathways for the biological processes (Figure 2A). To summarize, the NFU1 mutation significantly altered mitochondrial metabolism, antioxidant system, and apoptosis regulation. Thus, we generated the individual heat maps of proteins associated with corresponding pathways, including the most important oxidative phosphorylation, FA metabolism, oxidative stress response, and regulation of apoptosis (Figure 2B through 2E). We have previously reported that NFU1 mutation specifically affects complexes I and II of respiratory chain12 and, indeed, our proteomics data confirm the complexes decrease (Figure 2B), whereas showed marked upregulation in downstream complexes from III to V that can be explained by adaptation. Interestingly, FA transport is clearly upregulated in the NFU1 group, with overall upregulation in β-oxidation and FA synthesis (Figure 2C). However, important players in FA metabolism such as FAS, ACAT (acetyl Co-A acetyltransferase), and ACACA were downregulated and required a follow-up examination at cellular function level to find out the overall effect of NFU1 mutation on FA metabolism. The antioxidant system also showed mixed response with the upregulation of major mitochondrial hydrogen peroxide detoxicant PRDX3 (peroxiredoxin 3), superoxide scavenger PON2, and lipid detoxicant MGST1 and downregulation of many other antioxidants (Figure 2D). Therefore, it is unclear whether NFU1 mutant cells produce more oxidants and experience oxidative stress. Apoptosis panel showed significant upregulation of antiapoptotic signaling, including Akt (Figure 2E). Since these pathways have been implicated significantly in driving the pathogenesis of uncontrolled proliferation, investigating them in the PASMC would, therefore, give fundamental insights into the pathogenesis of PAH in the NFU1 model (Figure 2F).
Figure 2.
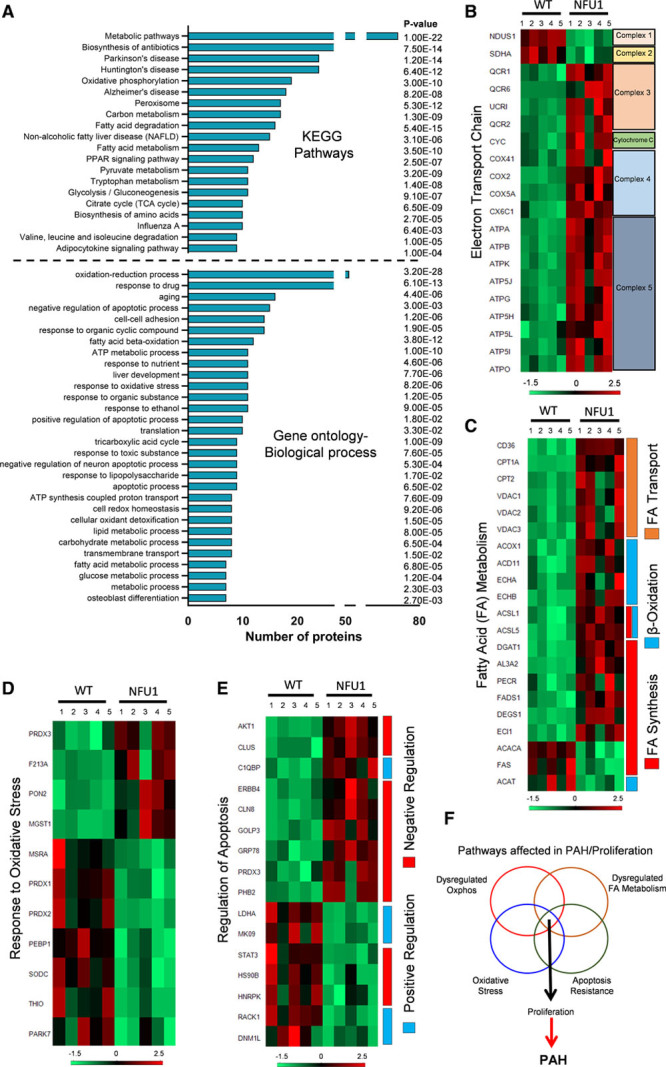
Functional annotation of significant proteins from the proteomic data using the Database for Annotation, Visualization and Integrated Discovery. A, Representation of top 20 pathways in KEGG and top 30 processes in the gene ontology-biological process. Pathways were sorted based on the abundance of the number of proteins associated. B, Heat map indicating abundance of proteins associated with the mitochondrial electron transport chain shows decreased levels of complex I and II and increased complexes III to V in the NFU1 group. C, Heat map of fatty acid metabolism proteins within the mitochondria shows dysregulated fatty acid (FA) oxidation and synthesis in NFU1 rats. D, Heat map indicating an abundance of mitochondrial proteins associated with regulating oxidative stress shows a misbalance in NFU1 mitochondria compared with WT (wild type). E, Heat map of mitochondrial proteins regulating apoptosis shows a shift favoring NFU1 survival. F, Possible dysregulated pathways that lead to proliferation and pulmonary arterial hypertension (PAH) in the NFU1 pulmonary artery smooth muscle cell (PASMC). KEGG indicates Kyoto Encyclopedia of Genes and Genomes; PPAR, peroxisome proliferator-activated receptor; and TCA, citrate cycle.
Mitochondrial Metabolism Is Diminished in NFU1G206C PASMC
It is established that PAH is associated with mitochondrial dysfunction, findings we have confirmed in our recent work, where we demonstrated that NFU1 mutant rats have impaired mitochondrial complex I and II functions.4–8,12 In the present study, quantitative proteomics, in conjunction with GO enrichment evaluation, corroborated our previous findings of altered mitochondrial electron transport chain (ETC) protein expression (Figure 2B).12 We identified that among the mitochondrial subunits, complexes I and II had decreased abundance in the NFU1 rats (Figure 2B). Conversely, the expression of complexes III, IV, and V, as well as cytochrome c, an electron carrier in the ETC, was significantly increased in the NFU1 rats (Figure 2B). We also confirm similar protein expression patterns in the PASMC isolated from the rat lungs, where we observe decreased complex I and II, unchanged complex III, and a trending increase in complex V expressions (Figure 3A and 3B). This could perhaps be a cellular compensatory mechanism that upregulates upstream complexes to balance decreases in complex I and II expression. However, changes in ETC protein expression in both directions could not answer the question of whether overall ETC has decreased or increased function. Therefore, to analyze alterations in mitochondrial bioenergetics at the cellular level, we examined mitochondrial respiration by monitoring oxygen consumption using the Seahorse XF mito-stress assay (Figure 3C). Compared with the WT, the NFU1 group showed a significant decrease in basal mitochondrial respiration, indicating that these cells had diminished basic mitochondrial function (Figure 3D). The maximal uncoupled rate induced by FCCP was also found to be markedly decreased in the NFU1 groups (Figure 3E), suggesting that these mitochondria were highly dysfunctional under stress conditions. Importantly, we observed that the spare respiratory capacity was found to be significantly decreased in the NFU1 groups (Figure 3F). This is a characteristic of cells that transform from an oxidative state to a glycolytic state.35 The calculated mitochondrial ATP production was also shown to be decreased in the NFU1 groups, which indicates a lower dependence on the mitochondria as an energy source in the NFU1 mutant (Figure 3G). A compensatory outcome for decreased mitochondrial metabolism could be an increase in the GPD (GPD2). We found a higher expression of GPD2 in the NFU1 cells than the WT cells (Figure 3H). This suggests that the NFU1 mutant cells could, indeed, recruit an alternative input of electrons via FADH2 into the ETC to balance the dysfunction in complexes I and II.
Figure 3.
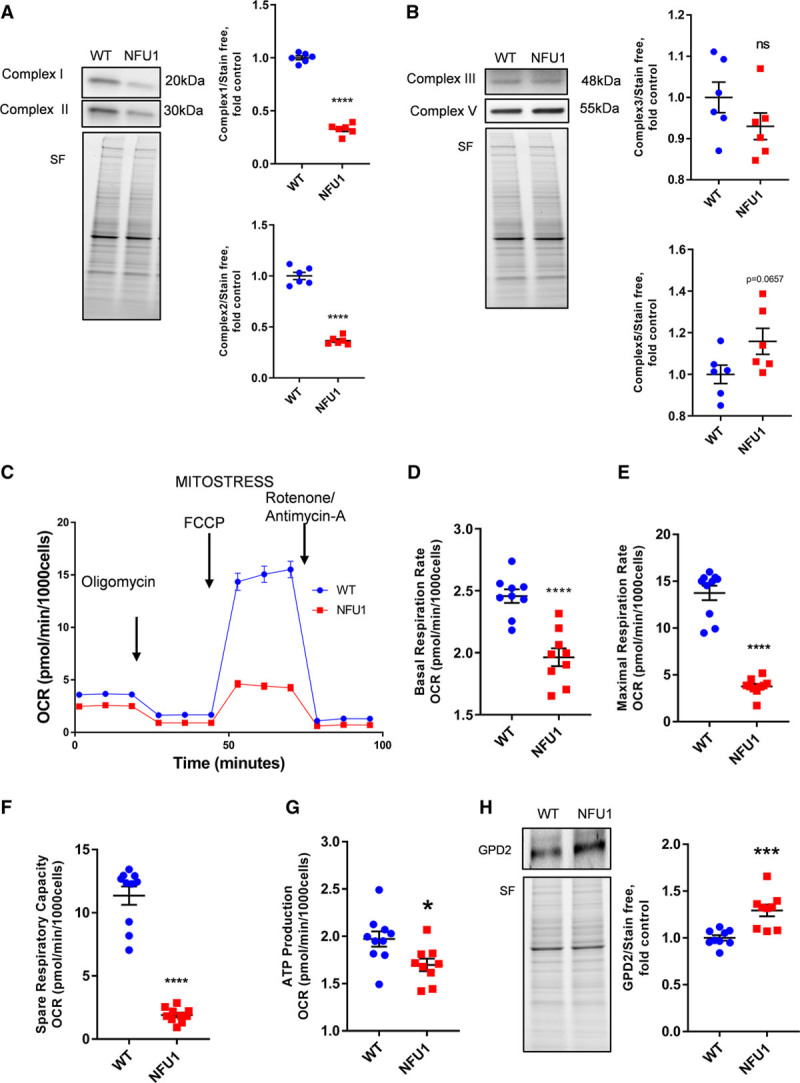
NFU1 mutant pulmonary artery smooth muscle cells show altered electron transport chain proteins and decreased mitochondrial respiration. A, Complex 1 and complex 2 protein expressions are significantly decreased in the NFU1 group. B, Complex 3 expression was unchanged, but complex 5 expression was slightly elevated in the NFU1 group. C, Representation of overall mitochondrial oxygen consumption rates. Basal (D), maximal (E), and spare respiration rates (F) are significantly decreased in the NFU1 group. G, Mitochondrial ATP production is significantly decreased in the NFU1 group. H, GPD (glycerol-3-phosphate dehydrogenase)-2 protein expression is significantly increased in the NFU1 group (mean±SEM; n=6 to 10; *, ***, **** vs WT P<0.05, 0.001, 0.0001, Student t test). FCCP indicates carbonyl cyanide 4-(trifluoromethoxy)phenylhydrazone; ns, nonsignificant; OCR, oxygen consumption rate; SF, stain-free normalization; and WT, wild type.
NFU1G206C PASMCs Adopt High Glycolysis to Meet Proliferative Energy Demands
While glycolysis is largely a cytoplasmic event, several glycolytic enzymes (eg, hexokinase 2) interact closely with the mitochondria.36 Also, since PASMC in PAH is known to be highly proliferative and exhibit increased glycolysis necessary for cell survival, we sought to establish whether the homozygote mutant of NFU1G206C PASMC demonstrated similar characteristics. To assess comprehensive glycolytic function, we performed the Seahorse XF glyco-stress assay. The NFU1 PASMC demonstrated increased extracellular acidification rates, which is indicative of increased lactate export—a terminal product of glycolysis (Figure 4A). Under conditions where the mitochondria were inhibited, the mutant cells demonstrated higher levels of glycolytic capacity (Figure 4B). Also, at the basal level, the NFU1G206C PASMCs show twice the rate of glycolysis as compared with the WT PASMC (Figure 4C). This feature is predominantly observed in highly dividing cancer cells.37 Next, to determine specific mechanisms responsible for elevated glycolytic rates, we examined specific proteins within the glycolytic pathway. Hexokinases are glycolytic enzymes, which catalyze the phosphorylation of glucose—an important step in initiating glycolysis.38 We did not detect a significant change in hexokinase I protein expression (Figure 4D), but hexokinase II expression was found to be increased in the NFU1 PASMC (Figure 4E). Interestingly, hexokinase II is highly expressed in cells with a cancer phenotype.36 PKM catalyzes the final step of glycolysis and is also known to be a rate-limiting enzyme in glycolysis.39 It was shown that the upregulation of PKM2 takes place during a glycolytic switch.40 Therefore, we assessed the PKM2/PKM1 ratio as a factor for the increased glycolytic switch. Our data show that the NFU1 PASMC has a high PKM2/PKM1 ratio consistent with our extracellular acidification rate data (Figure 4F), indicating that these cells meet their proliferative energy demands via high glycolysis. PDH converts pyruvate into acetyl Co-A to enter the TCA cycle. To follow the fate of pyruvate in the mitochondria, we examined both PDH activity and expression. We did not find any difference in the PDH expression, but its activity was found to be impaired in the NFU1 cells (Figure 4G and 4H). This is a direct outcome of the NFU1 mutation affecting LAS and subsequent lipoidation of the PDH subunit, which we recently demonstrated.12 Therefore, the fate of pyruvate is perhaps not linked to efficient mitochondrial utilization, but alternative pathways are leading to anaplerosis or gluconeogenesis. These data suggest that the mutant cells have their glycolytic metabolic switch turned on to support high proliferation.
Figure 4.
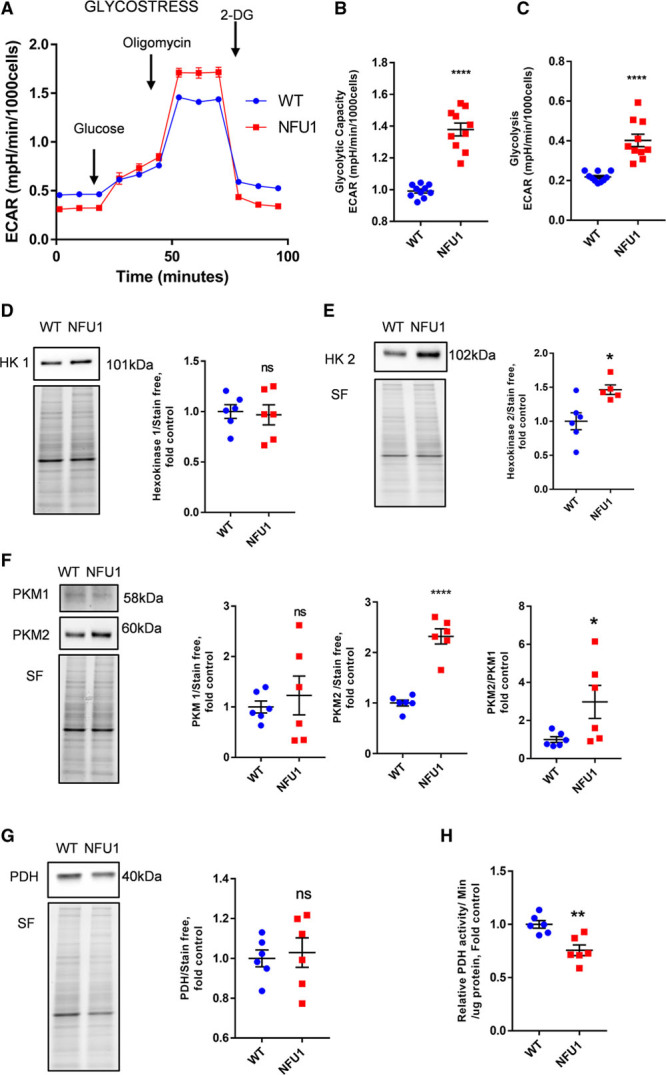
NFU1 mutant pulmonary artery smooth muscle cells (PASMCs) are highly glycolytic. A, The glyco-stress assay shows overall extracellular acidification rates (ECAR). NFU1 PASMCs show (B) higher glycolytic capacity and (C) higher basal glycolysis than the WT (wild type) group. Expression levels of glycolytic proteins: (D) HK (hexokinase) 1 expression was unaltered between the groups, but (E) HK2 was increased in the NFU1 groups; (F) PKM (pyruvate kinase)-1 was unaltered between the groups, but PKM2 and the PKM2/PKM1 ratio were increased in the NFU1 group. G, PDH (pyruvate dehydrogenase) expression was unchanged, but (H) PDH activity was decreased in the NFU1 group. PDH and HK2 have been probed from the same membrane after stripping (mean±SEM; n=5 to 10; *, **, **** vs WT P<0.05, 0.01, 0.0001, Student t test). 2-DG indicates 2-deoxyglucose; ns, nonsignificant; and SF, stain-free normalization.
NFU1 PASMCs Maintain Increased FA Metabolism via Augmented FA Import
Dysfunctional FA metabolism is shown to be involved in PAH pathogenesis.30,41 Our proteomic data (Figure 2C) suggested a possible disruption of FA metabolism (FA transport, FA oxidation, and FA synthesis), which prompted further exploration in this area. We found FA transporter proteins such as CD36 and CPT (CPT1A) upregulated in the quantitative proteomics and also the PASMC of the NFU1 animals (Figure 5A and 5B). We also observed an increased abundance in DGAT1 (diacylglycerol O-acyltransferase 1), which is involved in triglyceride synthesis in FA metabolism (Figure 2E). Also, DEGS1, involved in the FA synthesis, was found to be upregulated in the PASMC of the NFU1 rats (Figure 5C). A complementary process to FA synthesis could be an increase in the GPD shuttle (GPD1 and GPD2)—a mechanism that brings the mitochondrial oxidative phosphorylation at the crossroads of glycolysis and lipid metabolism in proliferative cells.42 Interestingly, we found increased GPD1 expression in the NFU1 cells than the WT cells (Figure 5D). This suggests that the NFU1 mutant cells could, indeed, amplify FA synthesis in tandem with the increase in DGAT1 and DEGS1. β-Oxidation is a process where FAs are broken down to generate NADH and FADH2, which enter the ETC.43 We observed increased expression of primary β-oxidation proteins such as ACSL1 (Figure 5E) and ACOX-1 (acyl-Co-A oxidase 1), but ACAT—the tertiary β-oxidation protein—was found to be decreased in the NFU1 group (Figure 2C), suggesting incomplete FAO—a pathological event in many cardiovascular diseases.44 Furthermore, to assess FAO in cells, we performed the Seahorse palmitate-BSA oxidation assay after depleting other fuel sources by starvation. Interestingly, the NFU1 mutant PASMC exhibited higher levels of FAO in comparison to the WT cells (Figure 5F). We find that the mutant cells exhibit significantly higher levels of basal FAO (Figure 5G) and a markedly amplified exogenous FAO than the WT cells (Figure 5H), perhaps owing to better FA import via CD36, CPT1, and CPT2. Also, since the cells are starved before the FAO assay, we find that the NFU1 cells are able to survive this stress more efficiently than the WT cells, as demonstrated by their increased basal respiration (Figure 5G). These data indicate that the NFU1 PASMC compensates for the reduced acetyl-Co-A synthesis via PDH by enhanced but incomplete FA utilization leading to lipotoxicity and activates mechanisms involved in oxidative stress and proliferation.
Figure 5.
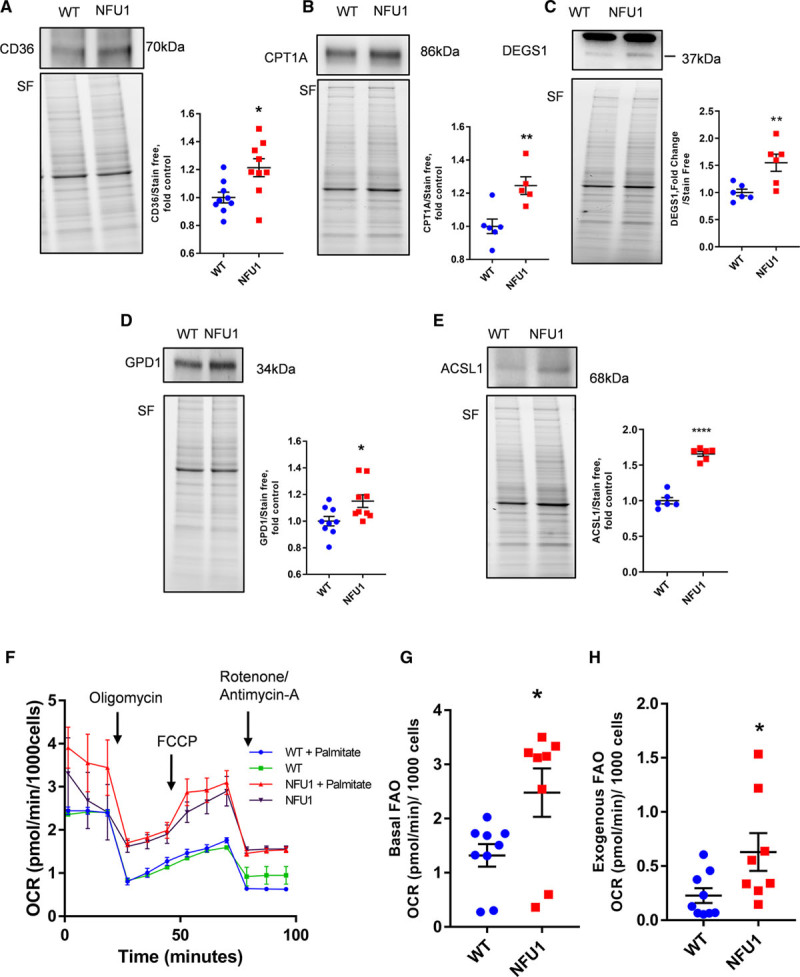
Alterations in fatty acid (FA) metabolism. A–E, CD36 (cluster of differentiation 36), CPT1A (carnitine palmitoyltransferase 1A), DEGS1 (delta 4-desaturase, sphingolipid 1), GPD (glycerol-3-phosphate dehydrogenase)-1, and ACSL1 (acyl-Co-A synthetase-1) protein expression is significantly increased in the NFU1 group. F, Seahorse-based analysis showing the overall levels of FA oxidation (FAO) the WT (wild type) and NFU1 group. G, Basal FAO is higher in the NFU1 group. Basal FAO is calculated from Figure 6B, measured as the difference in basal oxygen consumption rate (OCR) and OCR after rotenone/antimycin-A addition. H, Exogenously supplemented (palmitic acid) FAO is higher in the NFU1 group. Exogenous FAO, calculated from Figure 6B, is measured as the maximal OCR (FCCP [carbonyl cyanide 4-(trifluoromethoxy)phenylhydrazone]) difference between the respective palmitate groups and the groups without palmitate; OCR [(WT+palmitate)−(WT)], OCR [(NFU1+palmitate)−NFU1] (mean±SEM; n=5 to 10; *, **, **** vs WT P<0.05, 0.01, 0.0001, Student t test). SF indicates stain-free normalization.
NFU1G206C PASMCs Show Increased ROS Production and Resistance to Apoptosis
ROS are crucial in cellular signaling and can dictate cellular fates by regulating cell proliferation and cell death.45–47 Pathway analysis of our proteomic data revealed that the mutant cells had a decreased abundance in a large proportion of proteins that regulated cellular antioxidant responses (Figure 2D). We found that several crucial antioxidant enzymes, such as SODC and peroxiredoxins (PRDX1 and 2), were downregulated in the mutant cells. Importantly, PARK7—a protein chaperone and deglycase—is known to maintain mitochondrial ROS (mROS) and was found to be decreased in the mutant cells.48 We also found a sharp decrease in SOD2 expression indicating that the NFU1 cells could be in a highly oxidative environment (Figure 6A). However, we also observe an elevated abundance of specific lipid antioxidant protein MGST1 (Figure 6B) and the major mitochondrial antioxidant PRDX3 (Figure 2D). Interestingly, PRDX3 is known to enhance the survival of cancer cells.49 To gain clarity of the cellular redox state, we examined the oxidative status of the cells by assessing levels of mROS and hydrogen peroxide. As shown in Figure 6C, we observed that the mutant cells generate comparatively higher levels of mROS than the WT cells. Consistent with our previous data, this could perhaps be attributed to the impaired ETC (Figure 2B). Hydrogen peroxide is an important secondary signaling messenger and is known to initiate cellular proliferation and also is indicative of proliferative cells.50,51 Our study shows increased hydrogen peroxide production in the NFU1 cells (Figure 6D), which could act as a secondary messenger to maintain the highly proliferative state of the NFU1 cells. This observed increase in both peroxide and intracellular mROS could be the consequence of decreased SOD and peroxiredoxins expression, as observed in Figures 2D and 6A.
Figure 6.
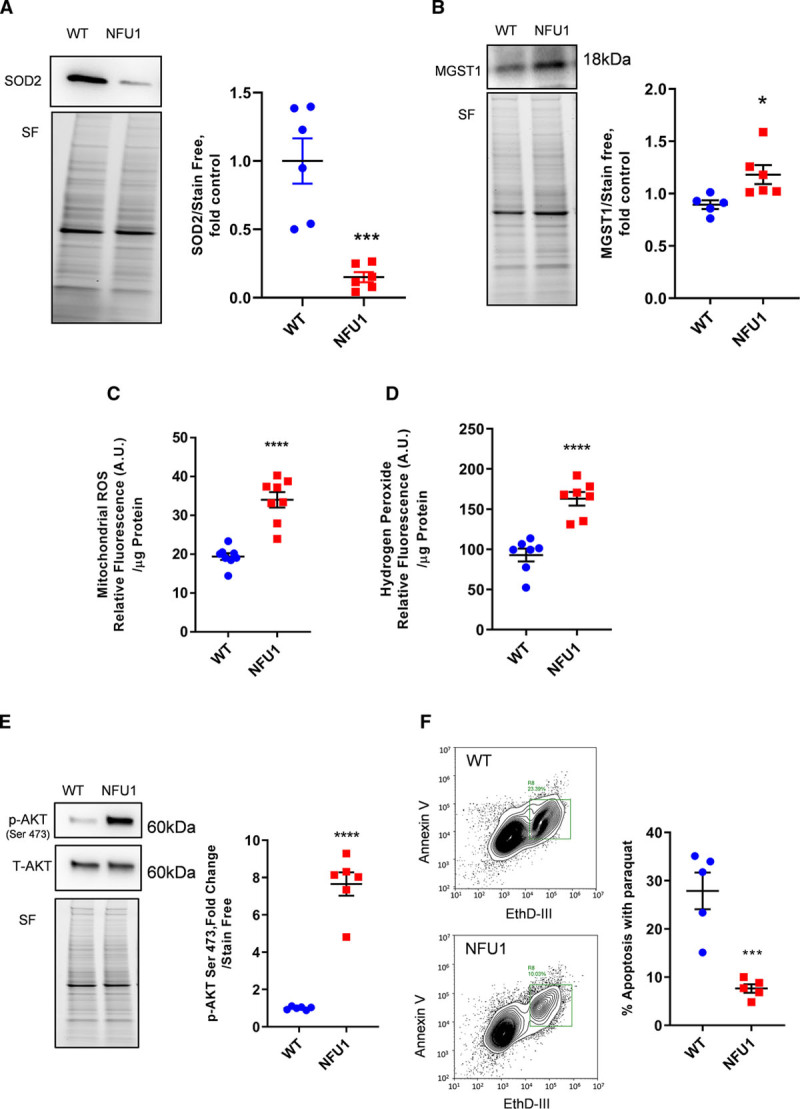
Oxidative status and apoptosis resistance. SOD (superoxide dismutase)-2 protein expression is significantly decreased (A) and MGST1 (microsomal glutathione S-transferase 1) protein expression is increased (B) in the NFU1 group. C, Mitochondrial reactive oxygen species (mROS) determined by MitoSox Red shows increased mROS in the NFU1 group. D, Hydrogen peroxide production is increased in the NFU1 group. E, p-AKT (phospho-protein kinase B) is significantly upregulated in the NFU1 group. F, Apoptosis assay (annexin V–ethidium bromide) shows that the NFU1 group has decreased apoptosis during paraquat-induced stress. Graph represented as the percentage of total pulmonary artery smooth muscle cells undergoing apoptosis (mean±SEM; n=5 to 8; *, ***, **** vs WT P<0.05, 0.001, 0.0001, Student t test). ROS indicates reactive oxygen species; SF, stain-free normalization; and WT, wild type.
A consequence of high ROS levels could be altered apoptosis.52 Resistance to apoptosis, therefore, is a key factor in enhancing the survivability of cells. Our investigation into apoptotic proteins within the mitoproteome revealed a synergistic action between increased antiapoptotic and decreased proapoptotic proteins, which could confer resistance to apoptosis in an oxidative environment (Figure 2E). While RAC-alpha serine/threonine-protein kinase (AKT1), CLUS (clusterin), and ERBB4 (receptor tyrosine-protein kinase erbB-4) proteins, which are known to enhance proliferation, are increased in the NFU1 rats, the proapoptotic proteins, MK09 (mitogen-activated protein kinase 9) and DNM1L (dynamin-1-like protein), are decreased in these rats (Figure 2E). Interestingly, we observe a remarkable activation of AKT in the PASMC of the NFU1 rats, which enhances the proliferative potential of these cells (Figure 6E). Next, to confirm our findings, we challenged the cells with paraquat—a ROS-generating chemical, which causes cell death.53 The NFU1 cells were able to survive the oxidative challenge better than the WT cells. As shown in Figure 6F, the apoptosis assays reveal that the mutant cells show a decreased apoptotic rate as compared with the WT cells, thus demonstrating their resistance to apoptosis.
NFU1G206C PASMCs Are Highly Proliferative
Uncontrolled proliferation of SMC plays a central role in vascular obliterative disease—a hallmark of PAH.54 Recently, we showed that the NFU1 rats have thickened pulmonary arteries.12 To confirm these findings, we measured the growth curve of isolated PASMC using 2 independent and different methods. Consistent with data from our metabolic and apoptosis assays, we observe that the mutant cells have proliferation rates almost twice that of the WT cells (Figure 7A through 7D). PC is an enzyme that catalyzes the conversion of pyruvate to oxaloacetate—an anaplerotic reaction linked to the highly proliferative state in cancer cells and also to PAH.55,56 We found PC to be highly expressed in the NFU1 cells (Figure 7E), showing that these cells enter a highly proliferative state, characteristic of PAH. Since high glycolytic rates are crucial for proliferation, we tested whether inhibiting glycolysis would decrease cellular growth rates. Consequently, we treated the cells with 2DG—a glycolysis inhibitor. Both the WT and the NFU1 cells showed a significantly decreased growth rate with 2DG (Figure 7F and 7G). However, the NFU1 cells treated with 2DG had a significantly higher growth rate than the WT cells with 2DG. This observation could be attributed to either optimized glycolytic pathway in NFU1 cells or upregulated alternative energetics pathways such as the fatty acid pathways activated (Figure 5F through 5H). Next, to test whether the high growth rate in NFU1 cells was dependent on excessive mROS generation as previously observed in this study (Figure 6B and 6C), we treated the cells with various concentrations of MT—a mitochondria-targeted superoxide scavenger. We find that the NFU1 PASMCs have significantly attenuated growth rates when treated with MT (500 nM, 48 hours; Figure 7H). These results indicate that dysregulated mitochondrial function could lead to increased mROS and could potentially be one of the mechanisms for excessive proliferation of the NFU1 cells.
Figure 7.
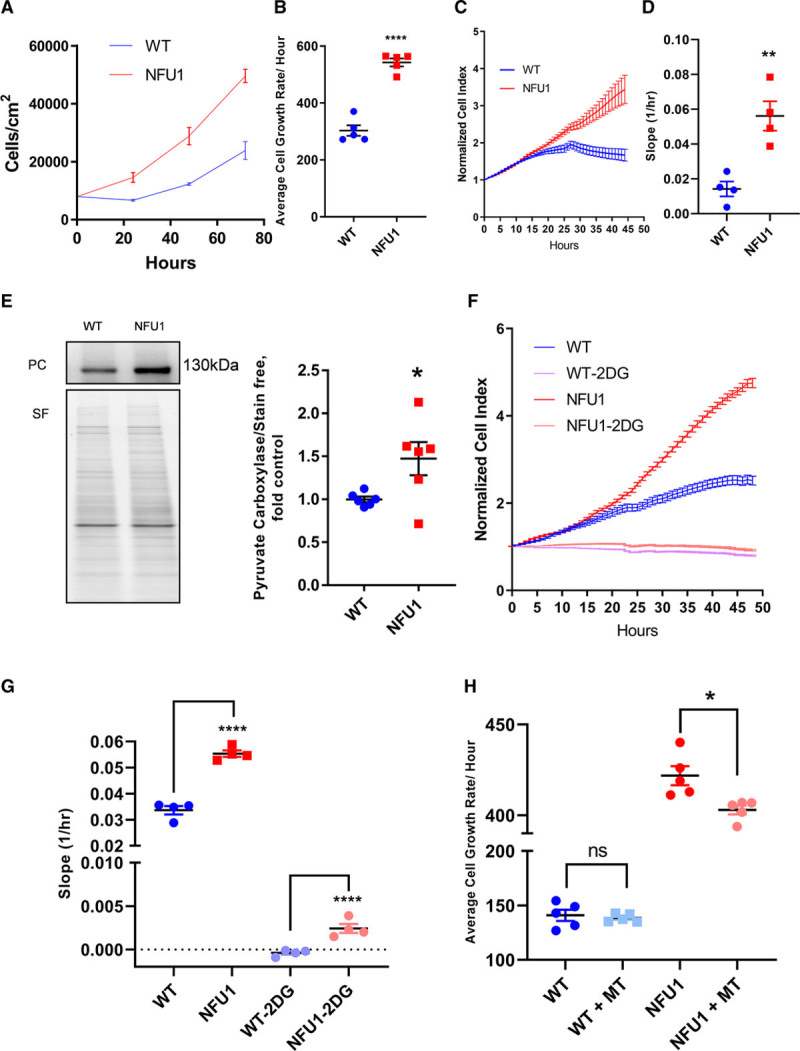
Cell proliferation is increased in pulmonary artery smooth muscle cells isolated from the NFU1 and WT (wild type) rats. A, Growth curves of WT and NFU1 pulmonary artery smooth muscle cell (PASMC) identified by cell counting. B, NFU1 PASMCs have higher proliferation rates in comparison with the WT PASMC (mean±SEM; n=5; ** vs WT P<0.01, Student t test). C, Proliferation rates as determined by the iCELLigence System (ACEA Biosciences), indicating real-time variations in electrical impedance, representing the cell growth index. D, Slope shows significantly increased growth rates in the NFU1 PASMC (mean±SEM; n=4; ** vs WT P<0.01, Student t test). E, PC (pyruvate carboxylase) expression is increased in the NFU1 PASMC (mean±SEM; n=5; * vs WT P<0.05, Student t test). F, Proliferation rate of both WT and NFU1 PASMC is inhibited by 2-deoxyglucose (2DG); however, (G) NFU1 PASMCs show significantly increased growth rate than WT PASMCs when treated with 2DG (25 mmol/L; mean±SEM; n=4; **** vs WT P<0.0001, Student t test). NFU1 mutant PASMC proliferation is decreased with the mitochondrial antioxidant mito-tempo (MT). H, NFU1 PASMC treated with 500 nM MT for 48 h shows decreased growth rates while in WT PASMC, the growth rate is unchanged with MT treatment (mean±SEM; n=5; * vs NFU1 P<0.05, Student t test). ns indicates nonsignificant; and SF, stain-free normalization.
Discussion
Mitochondrial dysfunction has surfaced from many studies as the primary initiating factor in proliferative diseases such as cancer and PAH.4,57,58 We recently demonstrated that rats with the NFU1G206C mutation develop abnormal mitochondrial function, which is sufficient to initiate PAH in rats.12 In this study, we used for the first time in isolated NFU1 mutant pulmonary arterial smooth muscle cells to establish a cellular mechanistic link between the cascades of events leading from mitochondrial dysfunction to PAH. We show that dysregulated Fe-S cluster homeostasis could trigger a complete change in the mitochondrial phenotype leading to metabolic reprogramming in the cells and causing proliferative changes in PAH (Figure 8).
Figure 8.
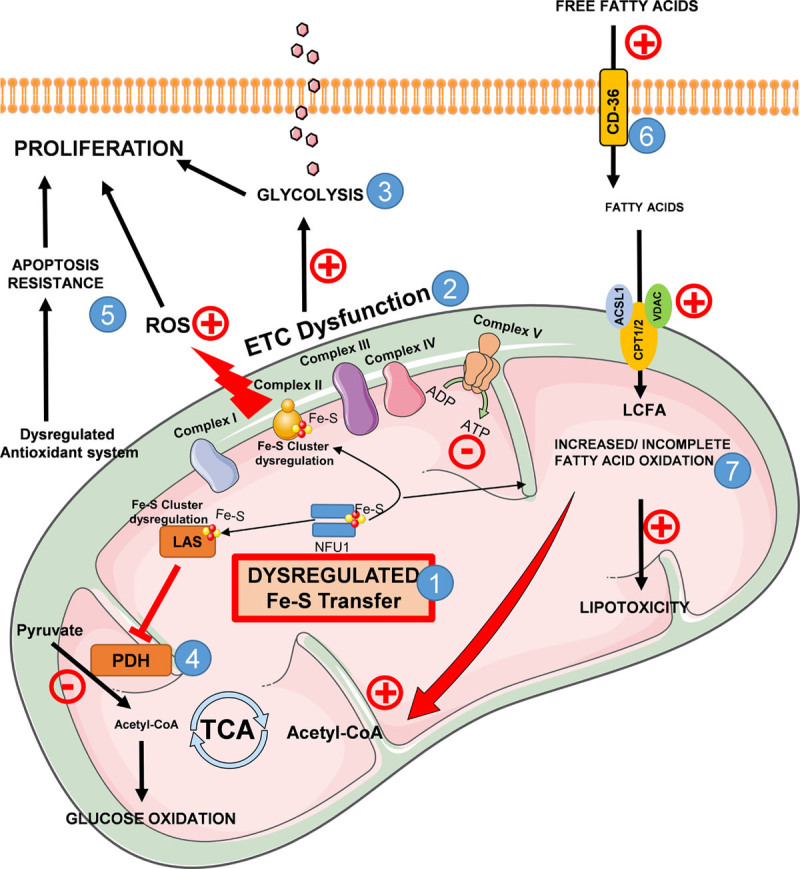
Consequences of NFU1 mutation on metabolic reprogramming of smooth muscle cells. (1) Mutation in the NFU1 protein causes defective iron-sulfur (Fe-S) cluster transfer to mitochondrial complex II and LAS (lipoic acid synthase). (2) Fe-S cluster transfer defects cause dysfunctional electron transport chain (ETC), leading to decreased ATP production in NFU1 pulmonary artery smooth muscle cell (PASMC). (3) Dysfunctional ETC and decreased mitochondrial ATP cause a compensatory metabolic switch, increasing glycolysis, thus leading to proliferation. (4) PDH (pyruvate dehydrogenase) activity is decreased as a result of impaired LAS, causing decreased glucose oxidation. (5) Impaired mitochondrial complexes lead to increased reactive oxygen species (ROS) production. In conjunction with dysregulated antioxidant system and apoptosis resistance, ROS production increases proliferation. (6) Fatty acid (FA) import is elevated in NFU1 PASMC via elevated CD36 (cluster of differentiation 36) expression. (7) Increased fatty acid import in conjunction with increased FA oxidation could balance decreased glucose oxidation and further supplement proliferation. Incomplete FA oxidation leads to lipotoxicity. ACSL1 indicates acyl-Co-A synthetase; AU, arbitrary units; CPT, carnitine palmitoyltransferase; EthDIII, ethidium homodimer III; LCFA, long-chain fatty acids; p-AKT, phospho-protein kinase B; T-AKT, total-protein kinase B; TCA, citrate cycle; and VDAC, voltage-dependent anion-selective channel protein.
We previously demonstrated that impaired mitochondrial respiration could induce a glycolytic shift in smooth muscle cells leading to proliferation in PAH.23,59 Disrupted iron homeostasis has also been shown to be directly associated with decreased mitochondrial respiration and increased glycolysis in PAH.58,60,61 Correspondingly, in this study, we found that the NFU1 cells have increased glycolysis, which is a direct response to impaired mitochondrial function as a result of disrupted Fe-S cluster protein maturation. This direct outcome of the NFU1 mutation strengthens the central role of Fe-S clusters in impairing mitochondrial function and triggering a glycolytic switch in proliferative diseases such as PAH.
Cells with impaired mitochondrial function adopt alternative pathways to cope with decreased energy output. An interesting observation in our study was the compensatory mechanisms used by the NFU1 cells to balance impaired mitochondrial function. We found that in response to the deficiency in Fe-S–dependent complexes I and II, the expression of cytochrome C and complexes III to V increases. Perhaps, the cell could aim to compensate for the decrease in energy. The GPD enzymes (GPD2 and GPD1) shuttle electrons across to the mitochondria via FADH linking glycolysis to the ETC.62 GPD2 is also shown to accumulate glycerol, leading to increased lipid storage in cell.42,63 Therefore, in conjunction with increased glycolysis, the increased GPD2-GPD1 activity and upregulated expression of complexes III to V in the NFU1 cells gives them an opportunity to adequately meet their energy demands for rapid cellular proliferation. Importantly, this increase in GPD2 is not only compensatory for the decreased mitochondrial respiration but also could supplement uncontrolled proliferation.64 Taken together, we find that the NFU1 mutation causes multiple mitochondrial aberrations leading to increased glycolysis and converges into a proliferative phenotype.
PDH controls the entry of pyruvate into the TCA cycle and, therefore, is known to be the gatekeeper of glucose oxidation. Recently, it was demonstrated that using DCA to inhibit PDK (PDH kinase)—an enzyme that inhibits PDH—improved outcomes in PAH patients.65 But DCA inhibition does not improve outcomes in certain PAH patients due to several genetic variabilities.65 Conversely, activation of PDK could not be the only reason for the attenuation of PDH activity. Our humanized rat model clearly shows that other mechanisms, for example, impaired synthesis of lipoic acid, a critical PDH cofactor, are sufficient to severely attenuate PDH activity and could be responsible to the unprecedently high prevalence of PAH (70% versus 0.0001% in general population) in patients with NFU1 mutation. Decreased glucose oxidation as a result of diminished PDH activity could instigate proliferative pathways in cells.66 In this article, we discovered that PDH is also a critically important switch for the increase in FA transport and oxidation. The mechanism also associated with PAH development and progression. Consistent with our recent findings,12 in the present study, we found PDH activity to be decreased in the NFU1 cells, which results in the NFU1 cells diverting pyruvate to alternative pathways, for example, anaplerosis via PC leading to enhanced proliferation of the cell. Thus, PDH has a key role in switching mitochondrial respiration to glycolysis and upregulated FAO.
Importantly, in the mitochondria, PDH and PC are competing for the same substrate, pyruvate. PC is an anaplerotic enzyme and is involved in several metabolic pathways such as gluconeogenesis, de novo FA synthesis, and amino acid synthesis. Indeed, the conversion of pyruvate to oxaloacetate by PC and following that to malate and citrate generates the essential components for cellular proliferation: oxaloacetate, malate, and NADPH.67 Oxaloacetate is involved in gluconeogenesis, amino acid, and FA synthesis. Increased glycolysis could, therefore, augment the production of intermediates via anaplerosis that is utilized in the production of amino acids, lipids, porphyrins, and nucleotides and, therefore, direct uncontrolled proliferation.59 Importantly, increased PC expression is predominantly observed in cancer and PAH, as reported in several studies.66 In our study, we show that the NFU1 cells have significantly upregulated PC, therefore, generating the necessary metabolites and activating pathways required for cell proliferation. Correspondingly, we could, therefore, establish that PC could efficiently balance the increased glycolysis to the excessive proliferation in NFU1 cells.6
It is well established that dysregulated FA metabolism is a hallmark of PAH.30,68,69 In addition to this, recent proteomic studies in cells derived from PAH patients have strongly associated abnormal and increased FA metabolism with PAH.29 Increased expression of the main long-chain FA transporter CD36 has been shown to be elevated in PAH, causing chronic elevation of long-chain FA uptake.30 Also, CD36 accounts for around 70% of the FA uptake in cardiomyocytes.30 In the mitochondria, CPT1/2 is a key long-chain FA shuttle. CPT1/2, along with ACSL1 in conjunction with a VDAC (voltage-dependent anion-selective channel protein), transfers FAs across the mitochondrial membrane.70 Coupled with the increased uptake of FAs, increased FA and triglyceride synthesis further complicates the disease, aggravating PAH.30,69 In the NFU1 cells, we observe that there is an increase in CD36, CPT1/2, ACSL1, and VDAC, implying increased FA import and increased triglyceride synthesis owing to increased DGAT1. A recent study linked Fe-S cluster loss to increased FA synthesis in nonadipose tissues.71 Increased FA uptake and synthesis could affect FAO rates, which is shown to be dysregulated in PAH. Notably, increased FAO and glycolysis are also shown to be associated with RV failure.68 Indeed, inhibiting FAO was shown to increase GO and prevent PAH in mice.69 Moreover, DGAT1 that catalyzes the final step of triglyceride synthesis has been shown to be elevated in association with cardiac dysfunction.72 Importantly, increased FAO is shown to be accompanied by increased CPT1 expression, which is the rate-limiting step to mitochondrial FAO pathway.73 Consequently, increased FAO overload could potentially only increase glucose uptake and glycolysis but not glucose oxidation as compared with FA uptake and β-oxidation.30,69 Mitochondrial FA overload, in conjunction with increased accumulation of long-chain acylcarnitines, has been linked to incomplete FAO. In fact, incomplete FAO generates intermediates that could cause lipotoxicity leading to RV dysfunction and failure.41 In the present study, we speculate that as a result of decreased expression of ACAT, the increased but incomplete FAO in conjunction with increased FA uptake could lead to the formation of intermediates that causes lipotoxicity in the NFU1 model. Interestingly, in the micro-environment, proliferative cells have been shown to demonstrate high FA metabolism to complement glycolysis.74 In addition to this, when we inhibited glycolysis in the PASMC, we observe that the NFU1 cells still demonstrate higher growth than the WT cells, indicating a possible sustained input from other metabolic sources. Taken together, with our previous observation of upregulated GPD2/1, increased PC, and increased complex III-V, increased FAO could additionally compensate for decreased mitochondrial respiration and supplement proliferation in the NFU1 PASMC.
Excessive mROS in PASMC has been shown to impair redox signaling and is known to create cells that are proliferative and apoptosis-resistant and, therefore, contributing to PAH.75 Indeed, it is also shown that many cancers are initiated due to an initial presence of excessive ROS,76 and it is hypothesized that in a high oxidative environment, aerobic glycolysis is enhanced, leading to cell proliferation.77 In our study, we observe that the NFU1 cells generate high ROS levels, and these cells obtain a highly proliferative phenotype. It is shown that cells with decreased mitochondrial function typically generate reduced ROS levels.69 However, we found that the NFU1 cells show a severely impaired mitochondrial antioxidant system, and, therefore, this could result in excessive mROS generation. The significant decrease in SOD2 that we observe in the NFU1 cells could play a vital role in ROS-mediated cellular proliferation. These findings corroborate with several studies, which have confirmed that a decrease in SOD2 triggers a proliferative, cancer-like phenotype.78,79 Additionally, SOD2 deficiency is emerging as a crucial focus of research in PAH and is demonstrated to be involved in the phenotypic switching of cells.75,80,81 Altogether, the NFU1 model resonates these findings and brings SOD2 and ROS to the intersection of mitochondrial dysfunction and phenotypic switching of the PASMC. Confirming the role of mROS in proliferation, we show that the NFU1 cells have attenuated proliferation rates when the mROS is quenched using the mitochondrial-targeted antioxidant MT. Indeed, MT is known to be an SOD mimetic.82 A similar observation was previously reported in proliferative cancer cells where antioxidant treatment inhibited redox-sensitive survival.83 However, the observation that MT treatment does not bring back proliferation rates to WT levels indicates that there could be several other mechanisms underlying the increased proliferation in the NFU1 cells. We postulate that the NFU1 cells perhaps maintain a high proliferation rate in an oxidative environment due an ingenious interplay in the antioxidant system. MGST1 and PRDX3 are antioxidant enzymes that are known to be upregulated in cancers, which are also protective of oxidative stress–induced apoptosis.84,85 In our study, we observe that both MGST1 and PRDX3 levels were elevated in NFU1 cells while other important antioxidants, for example, SOD1/SOD2, PRDX1/2, and thioredoxins, were downregulated. This dysregulated expression in antioxidant enzymes could work in consensus to enhance survival from increased ROS production and thereby promote cell survival. Increased ROS should potentially activate pathways leading to apoptosis,52 but we find that the NFU1 cells circumvent apoptosis. Our data indicate that the NFU1 cells are resistant to apoptosis through the synergistic action of anti- and proapoptotic proteins. In an environment of oxidative stress, MK09 is shown to induce apoptosis.86 Indeed, we found that MK09 expression had decreased, implying that the NFU1 cells evade apoptosis and increase proliferation by upregulating proliferative proteins, for example, AKT, CLUS, and ERBB4. Importantly, PARK7—a redox-sensitive chaperone,48 which is essential in regulating ROS and apoptosis—was found to be downregulated in the NFU1 cells. Indeed, our observation of the NFU1 cells surviving high ROS stress induced by paraquat supports the proteomic data in this study. Altogether, these data provide us with insight that the NFU1 cells take advantage of both high ROS and decreased apoptosis to promote excessive proliferation.
In conclusion, a single primary event, dysfunctional mitochondria due to impaired Fe-S cluster transfer, converges our observation of impaired mitochondrial respiration, increased glycolysis, increased ROS, apoptosis resistance, and dysregulated FA metabolism leading to increased proliferation of smooth muscle cells. This study emphasizes the role of mitochondrial dysfunction in the initiation of PAH, provides a novel model, and paves the way to explore PAH at the cellular level. This study only considered female cells due to the higher occurrence of PAH phenotype in female NFU1 rats that recapitulates the higher prevalence of the female sex in patients with PAH. Additionally, studying sex differences in the NFU1 model could reveal new strategies to rescue the metabolic switch.
Acknowledgments
We would like to acknowledge Kevin Doubleday for his help with the volcano plots. Certain components of the graphical abstract and Figure 8 were obtained from the Image Bank of Servier Medical Art (http://smart.servier.com/) under a Creative Commons Attribution 3.0 Unported License. R. Rafikov and O. Rafikova contributed to the conception and design; analysis and interpretation was done by J. James, M. Zemskova, N.K. Barker, M.V. Varghese, C.A. Eccles, M. Niihori, and M. Luo; and J. James, O. Rafikova, R. Rafikov, L.J. Mandarino, M. Luo, and P.R. Langlais drafted the manuscript for important intellectual content.
Sources of Funding
This work was supported by the National Institutes of Health grants R01HL133085 (O. Rafikova), R01HL132918 (R. Rafikov), and R01HL151447 (R. Rafikov).
Disclosures
None.
Supplementary Material
Nonstandard Abbreviations and Acronyms
- 2-DG
- 2-deoxyglucose
- ACAT
- acetyl Co-A acetyltransferase
- ACOX-1
- acyl-Co-A oxidase 1
- ACSL1
- acyl-Co-A synthetase-1
- CC
- cellular component
- CLUS
- clusterin
- CPT
- carnitine palmitoyltransferase
- CRISPR/CAS9
- clustered regularly interspaced short palindromic repeats/clustered regularly interspaced short palindromic repeat–associated 9
- DEGS1
- delta 4-desaturase, sphingolipid 1
- DGAT1
- diacylglycerol O-acyltransferase 1
- DNM1L
- dynamin-1-like protein
- ERBB4
- receptor tyrosine-protein kinase erbB-4
- ETC
- electron transport chain
- FA
- fatty acid
- FAO
- fatty acid oxidation
- Fe-S
- iron-sulfur
- GO
- gene ontology
- GPD
- glycerol-3-phosphate dehydrogenase
- HK
- hexokinase
- LAS
- lipoic acid synthase
- MGST1
- microsomal glutathione S-transferase 1
- MK09
- mitogen-activated protein kinase 9
- mROS
- mitochondrial reactive oxygen species
- MT
- mito-tempo
- PAH
- pulmonary arterial hypertension
- PASMC
- pulmonary artery smooth muscle cell
- PC
- pyruvate carboxylase
- PDH
- pyruvate dehydrogenase
- PDK
- pyruvate dehydrogenase kinase
- PKM
- pyruvate kinase
- PRDX3
- peroxiredoxin 3
- ROS
- reactive oxygen species
- SOD
- superoxide dismutase
- VDAC
- voltage-dependent anion-selective channel protein
- WT
- wild type
The Data Supplement is available with this article at https://www.ahajournals.org/doi/suppl/10.1161/ATVBAHA.120.314655.
For Sources of Funding and Disclosures, see page 752.
Contributor Information
Joel James, Email: joeljames@deptofmed.arizona.edu.
Marina Zemskova, Email: maz3@email.arizona.edu.
Cody A. Eccles, Email: codyeccles@email.arizona.edu.
Mathews V. Varghese, Email: mathewsv@email.arizona.edu.
Maki Niihori, Email: mniihori@deptofmed.arizona.edu.
Natalie K. Barker, Email: nakbarke@ad.unc.edu.
Moulun Luo, Email: moulunluo@deptofmed.arizona.edu.
Lawrence J. Mandarino, Email: mandarino@deptofmed.arizona.edu.
Paul R. Langlais, Email: langlais@deptofmed.arizona.edu.
Olga Rafikova, Email: orafikova@email.arizona.edu.
References
- 1.Chan SY, Loscalzo J. Pathogenic mechanisms of pulmonary arterial hypertension. J Mol Cell Cardiol. 2008;44:14–30. doi: 10.1016/j.yjmcc.2007.09.006 [DOI] [PMC free article] [PubMed] [Google Scholar]
- 2.Stenmark KR, Fagan KA, Frid MG. Hypoxia-induced pulmonary vascular remodeling: cellular and molecular mechanisms. Circ Res. 2006;99:675–691. doi: 10.1161/01.RES.0000243584.45145.3f [DOI] [PubMed] [Google Scholar]
- 3.Humbert M, Guignabert C, Bonnet S, Dorfmüller P, Klinger JR, Nicolls MR, Olschewski AJ, Pullamsetti SS, Schermuly RT, Stenmark KR, et al. Pathology and pathobiology of pulmonary hypertension: state of the art and research perspectives. Eur Respir J. 2019;53:1801887. [DOI] [PMC free article] [PubMed] [Google Scholar]
- 4.Marshall JD, Bazan I, Zhang Y, Fares WH, Lee PJ. Mitochondrial dysfunction and pulmonary hypertension: cause, effect, or both. Am J Physiol Lung Cell Mol Physiol. 2018;314:L782–L796. doi: 10.1152/ajplung.00331.2017 [DOI] [PMC free article] [PubMed] [Google Scholar]
- 5.Xu S, Xu X, Zhang J, Ying K, Shao Y, Zhang R. Pulmonary hypertension as a manifestation of mitochondrial disease: a case report and review of the literature. Medicine (Baltimore). 2017;96:e8716 doi: 10.1097/MD.0000000000008716 [DOI] [PMC free article] [PubMed] [Google Scholar]
- 6.Yu Q, Chan SY. Mitochondrial and metabolic drivers of pulmonary vascular endothelial dysfunction in pulmonary hypertension. Adv Exp Med Biol. 2017;967:373–383. doi: 10.1007/978-3-319-63245-2_24 [DOI] [PMC free article] [PubMed] [Google Scholar]
- 7.Sahay S, Marshall JD, Sauler M, Rao Y, Lee PJ, Fares WH. Endothelial mitochondrial dysfunction in pulmonary arterial hypertension - secondary analysis from freedom-C2. A68. WOW: Pharm Treat Pulm Hypertens. 2017A2274–A2274. [Google Scholar]
- 8.Paulin R, Dromparis P, Sutendra G, Gurtu V, Zervopoulos S, Bowers L, Haromy A, Webster L, Provencher S, Bonnet S, et al. Sirtuin 3 deficiency is associated with inhibited mitochondrial function and pulmonary arterial hypertension in rodents and humans. Cell Metab. 2014;20:827–839. doi: 10.1016/j.cmet.2014.08.011 [DOI] [PubMed] [Google Scholar]
- 9.Braymer JJ, Lill R. Iron–sulfur cluster biogenesis and trafficking in mitochondria. J Biol Chem. 2017;292:12754–12763. [DOI] [PMC free article] [PubMed] [Google Scholar]
- 10.Melber A, Na U, Vashisht A, Weiler BD, Lill R, Wohlschlegel JA, Winge DR. Role of nfu1 and bol3 in iron-sulfur cluster transfer to mitochondrial clients. Elife. 2016;5:e15991. [DOI] [PMC free article] [PubMed] [Google Scholar]
- 11.Pain D, Dancis A. Roles of Fe-S proteins: from cofactor synthesis to iron homeostasis to protein synthesis. Curr Opin Genet Dev. 2016;38:45–51. doi: 10.1016/j.gde.2016.03.006 [DOI] [PMC free article] [PubMed] [Google Scholar]
- 12.Niihori M, Eccles CA, Kurdyukov S, Zemskova M, Varghese MV, Stepanova AA, Galkin A, Rafikov R, Rafikova O. Rats with a human mutation of NFU1 develop pulmonary hypertension. Am J Respir Cell Mol Biol. 2020;62:231–242. doi: 10.1165/rcmb.2019-0065OC [DOI] [PMC free article] [PubMed] [Google Scholar]
- 13.Culley MK, Perk D, Chan SY. NFU1, Iron-sulfur biogenesis, and pulmonary arterial hypertension: a (metabolic) shift in our thinking. Am J Respir Cell Mol Biol. 2020;62:136–138. doi: 10.1165/rcmb.2019-0309ED [DOI] [PMC free article] [PubMed] [Google Scholar]
- 14.Li H, Liu Y, Shang L, Cai J, Wu J, Zhang W, Pu X, Dong W, Qiao T, Li K. Iron regulatory protein 2 modulates the switch from aerobic glycolysis to oxidative phosphorylation in mouse embryonic fibroblasts. Proc Natl Acad Sci USA. 2019;116:9871–9876. doi: 10.1073/pnas.1820051116 [DOI] [PMC free article] [PubMed] [Google Scholar]
- 15.White K, Lu Y, Annis S, Hale AE, Chau BN, Dahlman JE, Hemann C, Opotowsky AR, Vargas SO, Rosas I, et al. Genetic and hypoxic alterations of the microRNA-210-ISCU1/2 axis promote iron-sulfur deficiency and pulmonary hypertension. EMBO Mol Med. 2015;7:695–713. doi: 10.15252/emmm.201404511 [DOI] [PMC free article] [PubMed] [Google Scholar]
- 16.Provencher S, Archer SL, Ramirez FD, Hibbert B, Paulin R, Boucherat O, Lacasse Y, Bonnet S. Standards and methodological rigor in pulmonary arterial hypertension preclinical and translational research. Circ Res. 2018;122:1021–1032. doi: 10.1161/CIRCRESAHA.117.312579 [DOI] [PubMed] [Google Scholar]
- 17.Kruse R, Krantz J, Barker N, Coletta RL, Rafikov R, Luo M, Højlund K, Mandarino LJ, Langlais PR. Characterization of the CLASP2 protein interaction network identifies SOGA1 as a microtubule-associated protein. Mol Cell Proteomics. 2017;16:1718–1735. doi: 10.1074/mcp.RA117.000011 [DOI] [PMC free article] [PubMed] [Google Scholar]
- 18.Perez-Riverol Y, Csordas A, Bai J, Bernal-Llinares M, Hewapathirana S, Kundu DJ, Inuganti A, Griss J, Mayer G, Eisenacher M, et al. The PRIDE database and related tools and resources in 2019: improving support for quantification data. Nucleic Acids Res. 2019;47(D1):D442–D450. doi: 10.1093/nar/gky1106 [DOI] [PMC free article] [PubMed] [Google Scholar]
- 19.Deutsch EW, Csordas A, Sun Z, Jarnuczak A, Perez-Riverol Y, Ternent T, Campbell DS, Bernal-Llinares M, Okuda S, Kawano S, et al. The ProteomeXchange consortium in 2017: supporting the cultural change in proteomics public data deposition. Nucleic Acids Res. 2017;45(D1):D1100–D1106. doi: 10.1093/nar/gkw936 [DOI] [PMC free article] [PubMed] [Google Scholar]
- 20.Parker SS, Krantz J, Kwak EA, Barker NK, Deer CG, Lee NY, Mouneimne G, Langlais PR. Insulin induces microtubule stabilization and regulates the microtubule plus-end tracking protein network in adipocytes. Mol Cell Proteomics. 2019;18:1363–1381. [DOI] [PMC free article] [PubMed] [Google Scholar]
- 21.Tyanova S, Temu T, Sinitcyn P, Carlson A, Hein MY, Geiger T, Mann M, Cox J. The Perseus computational platform for comprehensive analysis of (prote)omics data. Nat Methods. 2016;13:731–740. doi: 10.1038/nmeth.3901 [DOI] [PubMed] [Google Scholar]
- 22.Tyanova S, Cox J. Perseus: a bioinformatics platform for integrative analysis of proteomics data in cancer research. Methods Mol Biol. 2018;1711:133–148. doi: 10.1007/978-1-4939-7493-1_7 [DOI] [PubMed] [Google Scholar]
- 23.Rafikov R, Sun X, Rafikova O, Louise Meadows M, Desai AA, Khalpey Z, Yuan JX, Fineman JR, Black SM. Complex I dysfunction underlies the glycolytic switch in pulmonary hypertensive smooth muscle cells. Redox Biol. 2015;6:278–286. doi: 10.1016/j.redox.2015.07.016 [DOI] [PMC free article] [PubMed] [Google Scholar]
- 24.Rafikova O, Rafikov R, Kangath A, Qu N, Aggarwal S, Sharma S, Desai J, Fields T, Ludewig B, Yuan JX, et al. Redox regulation of epidermal growth factor receptor signaling during the development of pulmonary hypertension. Free Radic Biol Med. 2016;95:96–111. doi: 10.1016/j.freeradbiomed.2016.02.029 [DOI] [PMC free article] [PubMed] [Google Scholar]
- 25.Rivero-Gutiérrez B, Anzola A, Martínez-Augustin O, de Medina FS. Stain-free detection as loading control alternative to Ponceau and housekeeping protein immunodetection in Western blotting. Anal Biochem. 2014;467:1–3. doi: 10.1016/j.ab.2014.08.027 [DOI] [PubMed] [Google Scholar]
- 26.Rafikov R, McBride ML, Zemskova M, Kurdyukov S, McClain N, Niihori M, Langlais PR, Rafikova O. Inositol monophosphatase 1 as a novel interacting partner of RAGE in pulmonary hypertension. Am J Physiol Lung Cell Mol Physiol. 2019;316:L428–L444. doi: 10.1152/ajplung.00393.2018 [DOI] [PMC free article] [PubMed] [Google Scholar]
- 27.Pan T, Huang B, Zhang W, Gabos S, Huang DY, Devendran V. Cytotoxicity assessment based on the AUC50 using multi-concentration time-dependent cellular response curves. Anal Chim Acta. 2013;764:44–52. doi: 10.1016/j.aca.2012.12.047 [DOI] [PubMed] [Google Scholar]
- 28.Huang da W, Sherman BT, Lempicki RA. Systematic and integrative analysis of large gene lists using DAVID bioinformatics resources. Nat Protoc. 2009;4:44–57. doi: 10.1038/nprot.2008.211 [DOI] [PubMed] [Google Scholar]
- 29.Xu W, Comhair SAA, Chen R, Hu B, Hou Y, Zhou Y, Mavrakis LA, Janocha AJ, Li L, Zhang D, et al. Integrative proteomics and phosphoproteomics in pulmonary arterial hypertension. Sci Rep. 2019;9:18623 doi: 10.1038/s41598-019-55053-6 [DOI] [PMC free article] [PubMed] [Google Scholar]
- 30.Talati M, Hemnes A. Fatty acid metabolism in pulmonary arterial hypertension: role in right ventricular dysfunction and hypertrophy. Pulm Circ. 2015;5:269–278. doi: 10.1086/681227 [DOI] [PMC free article] [PubMed] [Google Scholar]
- 31.Masri FA, Xu W, Comhair SA, Asosingh K, Koo M, Vasanji A, Drazba J, Anand-Apte B, Erzurum SC. Hyperproliferative apoptosis-resistant endothelial cells in idiopathic pulmonary arterial hypertension. Am J Physiol Lung Cell Mol Physiol. 2007;293:L548–L554. doi: 10.1152/ajplung.00428.2006 [DOI] [PubMed] [Google Scholar]
- 32.Sakao S, Tatsumi K, Voelkel NF. Endothelial cells and pulmonary arterial hypertension: apoptosis, proliferation, interaction and transdifferentiation. Respir Res. 2009;10:95 doi: 10.1186/1465-9921-10-95 [DOI] [PMC free article] [PubMed] [Google Scholar]
- 33.Demarco VG, Whaley-Connell AT, Sowers JR, Habibi J, Dellsperger KC. Contribution of oxidative stress to pulmonary arterial hypertension. World J Cardiol. 2010;2:316–324. doi: 10.4330/wjc.v2.i10.316 [DOI] [PMC free article] [PubMed] [Google Scholar]
- 34.Ghasemzadeh N, Patel RS, Eapen DJ, Veledar E, Al Kassem H, Manocha P, Khayata M, Zafari AM, Sperling L, Jones DP, et al. Oxidative stress is associated with increased pulmonary artery systolic pressure in humans. Hypertension. 2014;63:1270–1275. doi: 10.1161/HYPERTENSIONAHA.113.02360 [DOI] [PMC free article] [PubMed] [Google Scholar]
- 35.Zhou Y, Al-Saaidi RA, Fernandez-Guerra P, Freude KK, Olsen RK, Jensen UB, Gregersen N, Hyttel P, Bolund L, Aagaard L, et al. Mitochondrial spare respiratory capacity is negatively correlated with nuclear reprogramming efficiency. Stem Cells Dev. 2017;26:166–176. doi: 10.1089/scd.2016.0162 [DOI] [PubMed] [Google Scholar]
- 36.Wolf A, Agnihotri S, Micallef J, Mukherjee J, Sabha N, Cairns R, Hawkins C, Guha A. Hexokinase 2 is a key mediator of aerobic glycolysis and promotes tumor growth in human glioblastoma multiforme. J Exp Med. 2011;208:313–326. doi: 10.1084/jem.20101470 [DOI] [PMC free article] [PubMed] [Google Scholar]
- 37.Liberti MV, Locasale JW. The warburg effect: how does it benefit cancer cells? Trends Biochem Sci. 2016;41:211–218. doi: 10.1016/j.tibs.2015.12.001 [DOI] [PMC free article] [PubMed] [Google Scholar]
- 38.Li XB, Gu JD, Zhou QH. Review of aerobic glycolysis and its key enzymes - new targets for lung cancer therapy. Thorac Cancer. 2015;6:17–24. doi: 10.1111/1759-7714.12148 [DOI] [PMC free article] [PubMed] [Google Scholar]
- 39.Dong G, Mao Q, Xia W, Xu Y, Wang J, Xu L, Jiang F. PKM2 and cancer: the function of PKM2 beyond glycolysis. Oncol Lett. 2016;11:1980–1986. doi: 10.3892/ol.2016.4168 [DOI] [PMC free article] [PubMed] [Google Scholar]
- 40.Zhang H, Wang D, Li M, Plecitá-Hlavatá L, D’Alessandro A, Tauber J, Riddle S, Kumar S, Flockton A, McKeon BA, et al. Metabolic and proliferative state of vascular adventitial fibroblasts in pulmonary hypertension is regulated through a MicroRNA-124/PTBP1 (polypyrimidine tract binding protein 1)/pyruvate kinase muscle axis. Circulation. 2017;136:2468–2485. doi: 10.1161/CIRCULATIONAHA.117.028069 [DOI] [PMC free article] [PubMed] [Google Scholar]
- 41.Brittain EL, Talati M, Fessel JP, Zhu H, Penner N, Calcutt MW, West JD, Funke M, Lewis GD, Gerszten RE, et al. Fatty acid metabolic defects and right ventricular lipotoxicity in human pulmonary arterial hypertension. Circulation. 2016;133:1936–1944. doi: 10.1161/CIRCULATIONAHA.115.019351 [DOI] [PMC free article] [PubMed] [Google Scholar]
- 42.Mráček T, Drahota Z, Houštěk J. The function and the role of the mitochondrial glycerol-3-phosphate dehydrogenase in mammalian tissues. Biochim Biophys Acta. 2013;1827:401–410. doi: 10.1016/j.bbabio.2012.11.014 [DOI] [PubMed] [Google Scholar]
- 43.Abdurrachim D, Luiken JJ, Nicolay K, Glatz JF, Prompers JJ, Nabben M. Good and bad consequences of altered fatty acid metabolism in heart failure: evidence from mouse models. Cardiovasc Res. 2015;106:194–205. doi: 10.1093/cvr/cvv105 [DOI] [PubMed] [Google Scholar]
- 44.Moore KH, Radloff JF, Hull FE, Sweeley CC. Incomplete fatty acid oxidation by ischemic heart: beta-hydroxy fatty acid production. Am J Physiol. 1980;239:H257–H265. doi: 10.1152/ajpheart.1980.239.2.H257 [DOI] [PubMed] [Google Scholar]
- 45.Circu ML, Aw TY. Reactive oxygen species, cellular redox systems, and apoptosis. Free Radic Biol Med. 2010;48:749–762. doi: 10.1016/j.freeradbiomed.2009.12.022 [DOI] [PMC free article] [PubMed] [Google Scholar]
- 46.Day RM, Suzuki YJ. Cell proliferation, reactive oxygen and cellular glutathione. Dose Response. 2005;3:425–42. [DOI] [PMC free article] [PubMed] [Google Scholar]
- 47.Ogrunc M, Di Micco R, Liontos M, Bombardelli L, Mione M, Fumagalli M, Gorgoulis VG, d’Adda di Fagagna F. Oncogene-induced reactive oxygen species fuel hyperproliferation and DNA damage response activation. Cell Death Differ. 2014;21:998–1012. doi: 10.1038/cdd.2014.16 [DOI] [PMC free article] [PubMed] [Google Scholar]
- 48.Shendelman S, Jonason A, Martinat C, Leete T, Abeliovich A. DJ-1 is a redox-dependent molecular chaperone that inhibits alpha-synuclein aggregate formation. PLoS Biol. 2004;2:e362 doi: 10.1371/journal.pbio.0020362 [DOI] [PMC free article] [PubMed] [Google Scholar]
- 49.McDonald C, Muhlbauer J, Perlmutter G, Taparra K, Phelan SA. Peroxiredoxin proteins protect MCF-7 breast cancer cells from doxorubicin-induced toxicity. Int J Oncol. 2014;45:219–226. doi: 10.3892/ijo.2014.2398 [DOI] [PubMed] [Google Scholar]
- 50.Polytarchou C, Hatziapostolou M, Papadimitriou E. Hydrogen peroxide stimulates proliferation and migration of human prostate cancer cells through activation of activator protein-1 and up-regulation of the heparin affin regulatory peptide gene. J Biol Chem. 2005;280:40428–40435. doi: 10.1074/jbc.M505120200 [DOI] [PubMed] [Google Scholar]
- 51.Stone JR, Collins T. The role of hydrogen peroxide in endothelial proliferative responses. Endothelium. 2002;9:231–238. doi: 10.1080/10623320214733 [DOI] [PubMed] [Google Scholar]
- 52.Redza-Dutordoir M, Averill-Bates DA. Activation of apoptosis signalling pathways by reactive oxygen species. Biochim Biophys Acta. 2016;1863:2977–2992. doi: 10.1016/j.bbamcr.2016.09.012 [DOI] [PubMed] [Google Scholar]
- 53.Jang YJ, Won JH, Back MJ, Fu Z, Jang JM, Ha HC, Hong S, Chang M, Kim DK. Paraquat induces apoptosis through a mitochondria-dependent pathway in RAW264.7 cells. Biomol Ther (Seoul). 2015;23:407–413. doi: 10.4062/biomolther.2015.075 [DOI] [PMC free article] [PubMed] [Google Scholar]
- 54.Rabinovitch M. Molecular pathogenesis of pulmonary arterial hypertension. J Clin Invest. 2012;122:4306–4313. doi: 10.1172/JCI60658 [DOI] [PMC free article] [PubMed] [Google Scholar]
- 55.Lao-On U, Attwood PV, Jitrapakdee S. Roles of pyruvate carboxylase in human diseases: from diabetes to cancers and infection. J Mol Med (Berl). 2018;96:237–247. doi: 10.1007/s00109-018-1622-0 [DOI] [PubMed] [Google Scholar]
- 56.Sun W, Chan SY. Pulmonary arterial stiffness: an early and pervasive driver of pulmonary arterial hypertension. Front Med. 2018;5::204. [DOI] [PMC free article] [PubMed] [Google Scholar]
- 57.Boland ML, Chourasia AH, Macleod KF. Mitochondrial dysfunction in cancer. Front Oncol. 2013;3:292 doi: 10.3389/fonc.2013.00292 [DOI] [PMC free article] [PubMed] [Google Scholar]
- 58.Rafikov R, James J, McClain N, Tofovic SP, Rafikova O. Role of gender in regulation of redox homeostasis in pulmonary arterial hypertension. Antioxidants. 2019;8:135. [DOI] [PMC free article] [PubMed] [Google Scholar]
- 59.Rafikova O, Srivastava A, Desai AA, Rafikov R, Tofovic SP. Recurrent inhibition of mitochondrial complex III induces chronic pulmonary vasoconstriction and glycolytic switch in the rat lung. Respir Res. 2018;19:69 doi: 10.1186/s12931-018-0776-1 [DOI] [PMC free article] [PubMed] [Google Scholar]
- 60.Navarro-Sastre A, Tort F, Stehling O, Uzarska MA, Arranz JA, Del Toro M, Labayru MT, Landa J, Font A, Garcia-Villoria J, et al. A fatal mitochondrial disease is associated with defective NFU1 function in the maturation of a subset of mitochondrial Fe-S proteins. Am J Hum Genet. 2011;89:656–667. doi: 10.1016/j.ajhg.2011.10.005 [DOI] [PMC free article] [PubMed] [Google Scholar]
- 61.Cotroneo E, Ashek A, Wang L, Wharton J, Dubois O, Bozorgi S, Busbridge M, Alavian KN, Wilkins MR, Zhao L. Iron homeostasis and pulmonary hypertension: iron deficiency leads to pulmonary vascular remodeling in the rat. Circ Res. 2015;116:1680–1690. doi: 10.1161/CIRCRESAHA.116.305265 [DOI] [PubMed] [Google Scholar]
- 62.Singh G. Mitochondrial FAD-linked Glycerol-3-phosphate dehydrogenase: a target for cancer therapeutics. Pharmaceuticals (Basel). 2014;7:192–206. doi: 10.3390/ph7020192 [DOI] [PMC free article] [PubMed] [Google Scholar]
- 63.Xu SP, Mao XY, Ren FZ, Che HL. Attenuating effect of casein glycomacropeptide on proliferation, differentiation, and lipid accumulation of in vitro Sprague-Dawley rat preadipocytes. J Dairy Sci. 2011;94:676–683. doi: 10.3168/jds.2010-3827 [DOI] [PubMed] [Google Scholar]
- 64.Zhou C, Yu J, Wang M, Yang J, Xiong H, Huang H, Wu D, Hu S, Wang Y, Chen XZ, et al. Identification of glycerol-3-phosphate dehydrogenase 1 as a tumour suppressor in human breast cancer. Oncotarget. 2017;8:101309–101324. doi: 10.18632/oncotarget.21087 [DOI] [PMC free article] [PubMed] [Google Scholar]
- 65.Michelakis ED, Gurtu V, Webster L, Barnes G, Watson G, Howard L, Cupitt J, Paterson I, Thompson RB, Chow K, et al. Inhibition of pyruvate dehydrogenase kinase improves pulmonary arterial hypertension in genetically susceptible patients. Sci Transl Med. 2017;9:eaao4583. [DOI] [PubMed] [Google Scholar]
- 66.Gray LR, Tompkins SC, Taylor EB. Regulation of pyruvate metabolism and human disease. Cell Mol Life Sci. 2014;71:2577–2604. doi: 10.1007/s00018-013-1539-2 [DOI] [PMC free article] [PubMed] [Google Scholar]
- 67.Liu YQ, Han J, Epstein PN, Long YS. Enhanced rat β-cell proliferation in 60% pancreatectomized islets by increased glucose metabolic flux through pyruvate carboxylase pathway. Am J Physiol Endocrinol Metab. 2005;288:E471–E478. [DOI] [PubMed] [Google Scholar]
- 68.Ohira H, deKemp R, Pena E, Davies RA, Stewart DJ, Chandy G, Contreras-Dominguez V, Dennie C, Mc Ardle B, Mc Klein R, et al. Shifts in myocardial fatty acid and glucose metabolism in pulmonary arterial hypertension: a potential mechanism for a maladaptive right ventricular response. Eur Heart J Cardiovasc Imaging. 2016;17:1424–1431. doi: 10.1093/ehjci/jev136 [DOI] [PubMed] [Google Scholar]
- 69.Sutendra G, Bonnet S, Rochefort G, Haromy A, Folmes KD, Lopaschuk GD, Dyck JR, Michelakis ED. Fatty acid oxidation and malonyl-CoA decarboxylase in the vascular remodeling of pulmonary hypertension. Sci Transl Med. 2010;2:44ra58 doi: 10.1126/scitranslmed.3001327 [DOI] [PubMed] [Google Scholar]
- 70.Lee K, Kerner J, Hoppel CL. Mitochondrial carnitine palmitoyltransferase 1a (CPT1a) is part of an outer membrane fatty acid transfer complex. J Biol Chem. 2011;286:25655–25662. doi: 10.1074/jbc.M111.228692 [DOI] [PMC free article] [PubMed] [Google Scholar]
- 71.Crooks DR, Maio N, Lane AN, Jarnik M, Higashi RM, Haller RG, Yang Y, Fan TW, Linehan WM, Rouault TA. Acute loss of iron-sulfur clusters results in metabolic reprogramming and generation of lipid droplets in mammalian cells. J Biol Chem. 2018;293:8297–8311. doi: 10.1074/jbc.RA118.001885 [DOI] [PMC free article] [PubMed] [Google Scholar]
- 72.Glenn DJ, Wang F, Nishimoto M, Cruz MC, Uchida Y, Holleran WM, Zhang Y, Yeghiazarians Y, Gardner DG. A murine model of isolated cardiac steatosis leads to cardiomyopathy. Hypertension. 2011;57:216–222. doi: 10.1161/HYPERTENSIONAHA.110.160655 [DOI] [PMC free article] [PubMed] [Google Scholar]
- 73.van der Windt GJ, Everts B, Chang CH, Curtis JD, Freitas TC, Amiel E, Pearce EJ, Pearce EL. Mitochondrial respiratory capacity is a critical regulator of CD8+ T cell memory development. Immunity. 2012;36:68–78. doi: 10.1016/j.immuni.2011.12.007 [DOI] [PMC free article] [PubMed] [Google Scholar]
- 74.Pacella I, Procaccini C, Focaccetti C, Miacci S, Timperi E, Faicchia D, Severa M, Rizzo F, Coccia EM, Bonacina F, et al. Fatty acid metabolism complements glycolysis in the selective regulatory T cell expansion during tumor growth. Proc Natl Acad Sci USA. 2018;115:E6546–E6555. doi: 10.1073/pnas.1720113115 [DOI] [PMC free article] [PubMed] [Google Scholar]
- 75.Archer SL, Marsboom G, Kim GH, Zhang HJ, Toth PT, Svensson EC, Dyck JR, Gomberg-Maitland M, Thébaud B, Husain AN, et al. Epigenetic attenuation of mitochondrial superoxide dismutase 2 in pulmonary arterial hypertension: a basis for excessive cell proliferation and a new therapeutic target. Circulation. 2010;121:2661–2671. doi: 10.1161/CIRCULATIONAHA.109.916098 [DOI] [PMC free article] [PubMed] [Google Scholar]
- 76.Reuter S, Gupta SC, Chaturvedi MM, Aggarwal BB. Oxidative stress, inflammation, and cancer: how are they linked? Free Radic Biol Med. 2010;49:1603–1616. doi: 10.1016/j.freeradbiomed.2010.09.006 [DOI] [PMC free article] [PubMed] [Google Scholar]
- 77.Molavian HR, Kohandel M, Sivaloganathan S. High concentrations of H2O2 make aerobic glycolysis energetically more favorable for cellular respiration. Front Physiol. 2016;7:362 doi: 10.3389/fphys.2016.00362 [DOI] [PMC free article] [PubMed] [Google Scholar]
- 78.Hurt EM, Thomas SB, Peng B, Farrar WL. Molecular consequences of SOD2 expression in epigenetically silenced pancreatic carcinoma cell lines. Br J Cancer. 2007;97:1116–1123. doi: 10.1038/sj.bjc.6604000 [DOI] [PMC free article] [PubMed] [Google Scholar]
- 79.Hussain SP, Hofseth LJ, Harris CC. Radical causes of cancer. Nat Rev Cancer. 2003;3:276–285. doi: 10.1038/nrc1046 [DOI] [PubMed] [Google Scholar]
- 80.Fu C, Hao S, Liu Z, Xie L, Wu X, Wu X, Li S. SOD2 ameliorates pulmonary hypertension in a murine model of sleep apnea via suppressing expression of NLRP3 in CD11b+ cells. Respir Res. 2020;21:9 doi: 10.1186/s12931-019-1270-0 [DOI] [PMC free article] [PubMed] [Google Scholar]
- 81.Song JQ, Jiang LY, Fu CP, Wu X, Liu ZL, Xie L, Wu XD, Hao SY, Li SQ. Heterozygous SOD2 deletion deteriorated chronic intermittent hypoxia-induced lung inflammation and vascular remodeling through mtROS-NLRP3 signaling pathway. Acta Pharmacol Sin. 2020;41:1197–1207. doi: 10.1038/s41401-019-0349-y [DOI] [PMC free article] [PubMed] [Google Scholar]
- 82.Dikalova AE, Bikineyeva AT, Budzyn K, Nazarewicz RR, McCann L, Lewis W, Harrison DG, Dikalov SI. Therapeutic targeting of mitochondrial superoxide in hypertension. Circ Res. 2010;107:106–116. doi: 10.1161/CIRCRESAHA.109.214601 [DOI] [PMC free article] [PubMed] [Google Scholar]
- 83.Nazarewicz RR, Dikalova A, Bikineyeva A, Ivanov S, Kirilyuk IA, Grigor’ev IA, Dikalov SI. Does scavenging of mitochondrial superoxide attenuate cancer prosurvival signaling pathways? Antioxid Redox Signal. 2013;19:344–349. doi: 10.1089/ars.2013.5185 [DOI] [PMC free article] [PubMed] [Google Scholar]
- 84.Johansson K, Ahlen K, Rinaldi R, Sahlander K, Siritantikorn A, Morgenstern R. Microsomal glutathione transferase 1 in anticancer drug resistance. Carcinogenesis. 2007;28:465–470. doi: 10.1093/carcin/bgl148 [DOI] [PubMed] [Google Scholar]
- 85.Nonn L, Berggren M, Powis G. Increased expression of mitochondrial peroxiredoxin-3 (thioredoxin peroxidase-2) protects cancer cells against hypoxia and drug-induced hydrogen peroxide-dependent apoptosis. Mol Cancer Res. 2003;1:682. [PubMed] [Google Scholar]
- 86.Wada T, Penninger JM. Mitogen-activated protein kinases in apoptosis regulation. Oncogene. 2004;23:2838–2849. doi: 10.1038/sj.onc.1207556 [DOI] [PubMed] [Google Scholar]
Associated Data
This section collects any data citations, data availability statements, or supplementary materials included in this article.
Supplementary Materials
Data Availability Statement
The data that support the findings of this study are available from the corresponding author upon reasonable request.