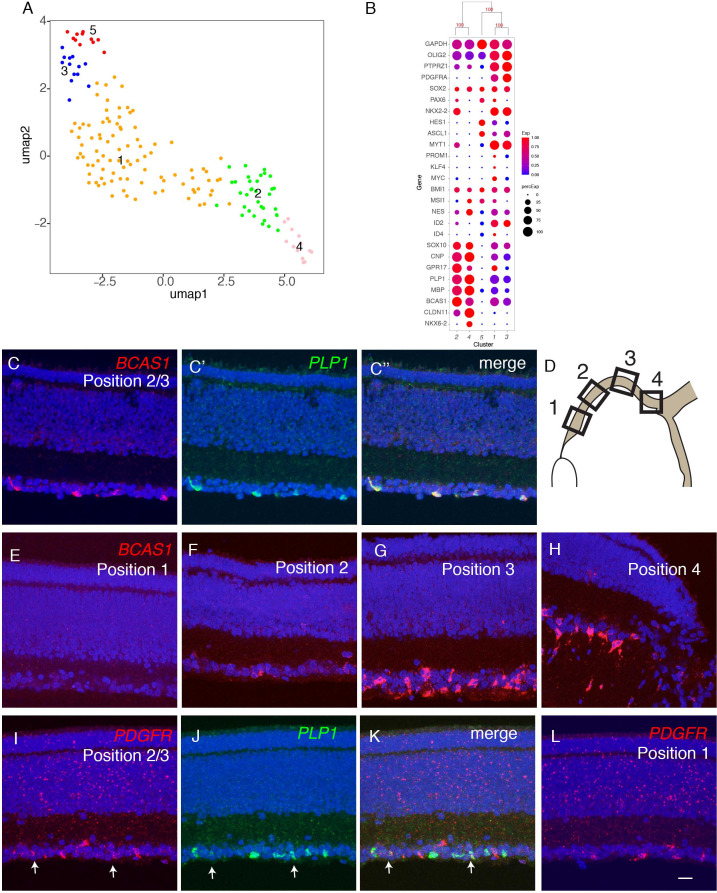
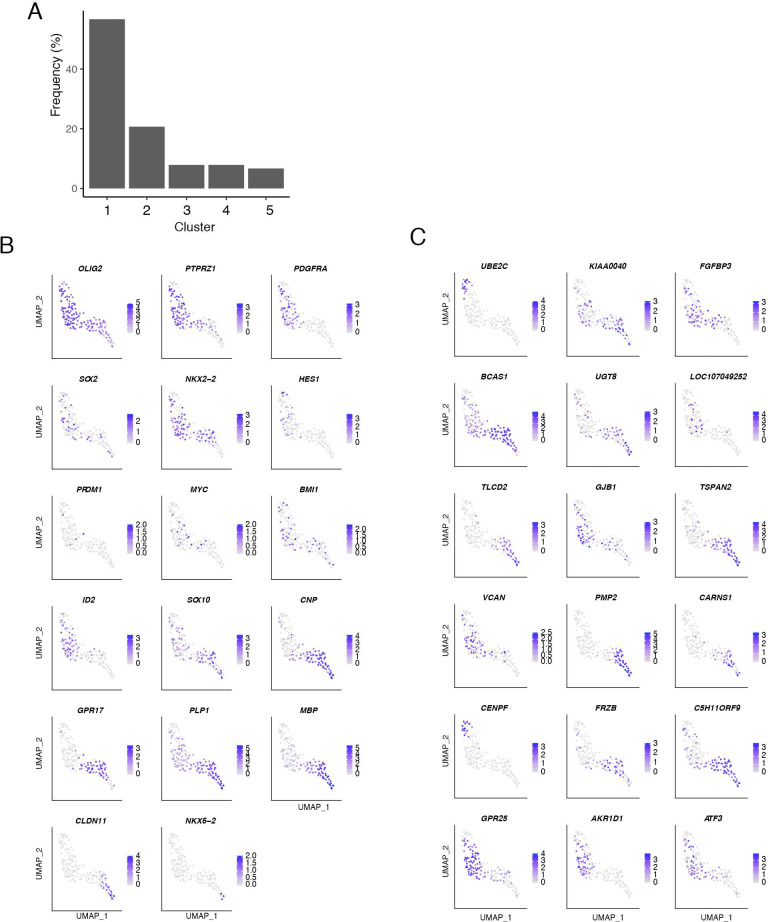
Figure 9. Developmental trajectory of oligodendrocytes.
(A) Clustering of E18 oligodendrocytes viewed in UMAP. (B) Dot plots showing expression of selected genes expressed in all or subsets of oligodendrocytes. Numbers correspond to clusters in A. (C-K) Double-label in situ hybridization showing that BCAS1 and PLP1 are co-expressed in the ganglion cell layer (C) while PDGFR and PLP1 exhibit nonoverlapping expression (I-K). (E-L) Graded distribution of BCAS1+ and PDGFR+ oligodendrocytes along the central-to-peripheral axis at E16. Positions of sections (E–L) are shown in D.


