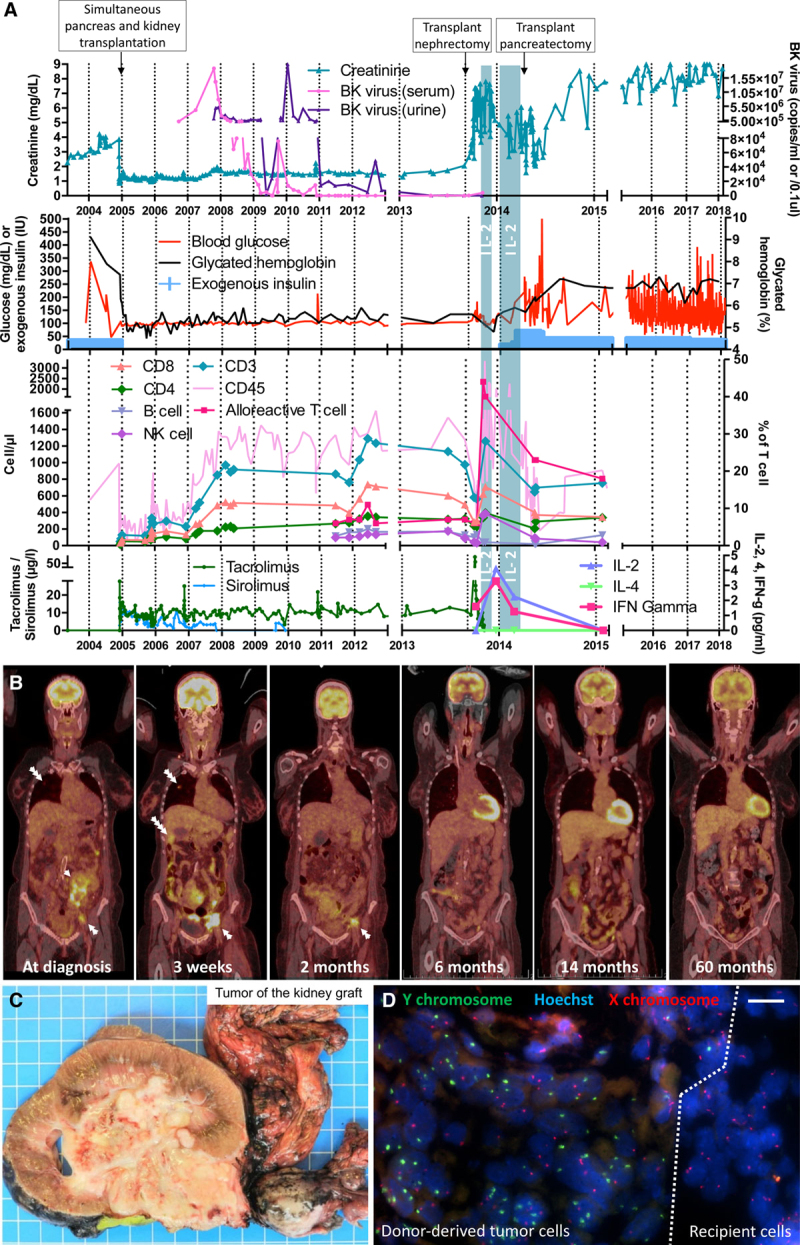
FIGURE 1.

Clinical, biological, radiological, and pathological evolution of the kidney-pancreas and the collecting duct carcinoma. A, Chart depicting the 15-y evolution of patient’s renal and endocrine pancreas function. BK virus copies per mL (blood) or per 0.1 μL (urine) are represented. The count of the different peripheral blood mononuclear cell populations was assessed over time. Interleukin (IL)–2 treatment course is shown as vertical blue bars and serum IL-2, -4, and interferon-γ (IFN-γ) levels preceding and following IL-2 treatment are represented. Immunosuppression regimen including tacrolimus and sirolimus trough levels are represented. B, PET/CT scans showing a metastatic collecting duct carcinoma at diagnosis (3 d before transplant nephrectomy) and 3 wk after surgery. Two-, 6-, 14-, and 60-mo follow-up imaging showing disappearance of the tumor. Single white arrow, kidney tumor; double white arrow, iliac metastatic lymph nodes; triple white arrow, lung metastasis; and quadruple white arrow, liver metastasis. C, Macroscopic view showing the explanted kidney graft invaded by the collecting duct carcinoma (1 blue square: 1 cm). D, fluorescence in situ hybridization (FISH) analysis of a kidney cryosection showing Y chromosome presence (in green) at the junction between tumor tissue and surrounding recipient parenchyma; tumor cells including multiple Y chromosome copies due to the high mitosis rate (scale bar: 50 µm). IU, international unit; NK, natural killer; PET/CT, positron emission tomography/computed tomography.
