Abstract
Purpose:
Epidemiological evidence suggests an increased risk of cancer related to CT scans, with children exposed to greater risk. The purpose of this work is to test the reliability of a linear Boltzmann Transport Equation (LBTE) solver for rapid and patient-specific CT dose estimation. This includes building a flexible LBTE framework for modeling modern clinical CT scanners and to validate the resulting dose maps across a range of realistic scanner configurations and patient models.
Methods:
In this study, computational tools were developed for modeling CT scanners, including a bowtie filter, overrange collimation, and tube current modulation. The LBTE solver requires discretization in the spatial, angular, and spectral dimensions, which may affect the accuracy of scanner modeling. To investigate these effects, this study evaluated the LBTE dose accuracy for different discretization parameters, scanner configurations, and patient models (male, female, adults, pediatric). The method used to validate the LBTE dose maps was the Monte Carlo code Geant4, which provided ground truth dose maps. LBTE simulations were implemented on a GeForce GTX 1080 graphic unit, while Geant4 was implemented on a distributed cluster of CPUs.
Results:
The agreement between Geant4 and the LBTE solver quantifies the accuracy of the LBTE, which was similar across the different protocols and phantoms. The results suggest that 18 views per rotation provides sufficient accuracy, as no significant improvement in the accuracy was observed by increasing the number of projection views. Considering this discretization, the LBTE solver average simulation time was approximately 30 seconds. However, in the LBTE solver the phantom model was implemented with a lower voxel resolution with respect to Geant4, as it is limited by the memory of the GPU. Despite this discretization the results showed a good agreement between the LBTE and Geant4, with root mean square error of the dose in organs of approximately 3.5% for most of the studied configurations.
Conclusions:
The LBTE solver is proposed as an alternative to Monte Carlo for patient-specific organ dose estimation. This study demonstrated accurate organ dose estimates for the rapid LBTE solver when considering realistic aspects of CT scanners and a range of phantom models. Future plans will combine the LBTE framework with deep-learning autosegmentation algorithms to provide near real-time patient-specific organ dose estimation.
Keywords: CT organ dose, deterministic solver, Monte Carlo
1. INTRODUCTION
The risk related to the radiation exposure of CT scans is a matter of wide concern1–3. The CT Dose Index (CTDI) is a dose metric included in CT dose reports. However, it is an inadequate metric of patient radiation dose, as it represents the average dose to a uniform plastic cylindrical phantom, which is not an appropriate model of the patient’s anatomy4–7. Patient-specific reporting of radiation dose requires a method to rapidly estimate the dose, which has traditionally required Monte Carlo computational methods. Monte Carlo represents the gold standard for radiation dose estimates and is widely used among the research scientific community. Monte Carlo (MC) was previously a computationally expensive tool that could not meet the clinical demand of having rapid dose maps. However, recent implementations of MC code on GPUs have drastically improved speeds8–11.
The alternative method for fast dose maps investigated in this work is Acuros CTD (Varian Medical Systems, Palo Alto, CA), a linear Boltzmann transport equation (LBTE) solver12. Acuros CTD and MC both solve the Boltzmann transport equation, but they use different approaches. MC is a stochastic solver whose accuracy depends on the number of particles simulated. Acuros CTD is a deterministic solver, thus, the dose map estimation problem is discretized in energy, space, and angle. The accuracy of the LBTE solutions depends on the level of discretization of these three parameters. Acuros CTD was previously validated for simple CT scan configurations in Wang et al.’s work12 using a reference dataset defined in the AAPM TG 195 report and one example source spectrum13. A different discrete LBTE solver was proposed by Norris et al.14 and investigated for estimating absorbed dose in the CTDI phantom. While Acuros CTD was validated for an anthropomorphic phantom model, this previous study of Acuros CTD did not model realistic scanner complexities that impact patient dose, such as overrange collimation and tube current modulation (TCM). The modeling of these scanner complexities in Acuros CTD may be impacted by the level of discretization. To investigate this question, this work first developed methods to model scanner complexities within the Acuros CTD framework. Then, in order to verify the accuracy of the CT system modeling considering the required discretization, the dose maps were compared with the gold standard MC method. Also, to broaden the validity of our study, different scanner parameters were varied, such as source collimation, spectral distribution of the beam, and TCM. Acuros CTD was also tested for the first time for a variety of anthropomorphic phantoms.
2. MATERIALS AND METHODS
The present study implements modern CT scanner aspects that affect dose deposition, such as the bowtie filter, overrange collimation, and TCM, both in Acuros CTD and in MC. The MC code Geant4 version 10.4.215 was used in this study. The MC simulations were run on a high-performance computing cluster Dell PowerEdge Model R630, with CPU 12-core Intel Xeon E5–2670 v3, and each node has 24 cores and 120 GB of memory. The physics library used for the MC method Geant4 was the Livermore models, which describe the interactions of electrons and photons with matter from 250 eV to 100 GeV16,17. The quantity scored was absorbed dose per simulated particle, given in units of eV/g/photon. The transport of secondary particles was included, with default cut value of 0.1 mm for photons and electrons, as was used in the AAPM Task Group report13. Our MC code was previously validated against Case 5 of the AAPM TG 195 report. Results showed differences between our MC code and the TG 195 results to within 1% for most organs, excluding the least exposed ones. The benchmarking of our Geant4 code allows us to use it as a validation tool of the LBTE results for this exercise.
2.1. Acuros CTD overview
Acuros CTD is based on the core algorithm of Acuros XB18,19 (Varian Medical Systems, Palo Alto, CA), which is a commercially available software tool for radiation therapy planning, and Acuros CTS20,21, which is a software that estimates cone beam CT scatter as part of a commercial iterative reconstruction algorithm package (iCBCT, Varian Medical Systems, Palo Alto, CA). The Acuros CTD application is for CT dose estimation and is for research use only. The photon transport in Acuros CTD consists of two steps. First, ray-tracing is performed from the source model to analytically calculate the uncollided fluence distribution in the patient, which represents the primary dose. The LBTE is numerically solved and iteratively applied to compute higher order collisions, from which the dose due to scatter is estimated. Numerical solution of the LBTE requires discretization in space, angle, and energy. These discretizations affect the memory requirement and runtime. Detailed description of how Acuros CTD numerically solves the LBTE is available in previous works12,20,21. In this study we develop methods to model diagnostic CT scanner complexities using the LBTE solver implementation that was previously optimized for CBCT scatter estimation20,21.
The solution of the LBTE solver is given in terms of fluence for each of the discretized energy groups. The fluence is then converted to dose by:
| (1) |
where Ki,g are the energy-weighted mass energy-absorption coefficients for each voxel i and for each energy group g, wm are quadrature weights associated with each direction, so that the weighted sum of the discrete directions approximates the spherical integral in all directions using the Discrete Ordinates method22,23, and ϕi,g,m is the discrete solution of the LBTE. Therefore, the calculation of dose requires an estimate of the energy-weighted mass absorption coefficients Ki,g for each of the studied spectra. Estimates of these coefficients were obtained using the NIST mass energy-absorption tables24. For each material in Acuros, its elemental composition was used to weight the elemental mass energy-absorption coefficients at the effective energies of the energy groups. These coefficients were further weighted by the effective energies to obtain Ki,g. All studies presented throughout this paper used these fixed coefficients, unless otherwise specified.
The accuracy of the LBTE depends on the number of voxels representing the phantom and is limited by the memory of the GPU and runtime constraints. The memory constraint typically requires the downsampling of the volume to a lower spatial resolution, resulting in downsampled fluence maps ϕi,g,m. The final dose map Di, is computed after upsampling the fluence maps ϕi,g,m to the native spatial resolution of the voxelized object. Energy-weighted mass absorption coefficients Ki,g are used at their native spatial resolution.
For the sake of simplicity, Acuros CTD will be referred to as Acuros throughout this paper. Because Acuros was developed for diagnostic imaging applications only, secondary particles are disregarded, which is also typically the case of MC GPU implementations9. In the diagnostic energy range, kerma and absorbed dose are assumed to be equivalent, suggesting that secondary particles travel negligible distance and their energy is absorbed locally.
2.2. Implementation of the scanner effects: Acuros versus Geant4
In Acuros, the complexities of modern CT scanners were modeled by defining distributed, discretized x-ray beams whose spectra and fluence varied across fan angle, gantry angle, and slice position. Each x-ray beam is defined by a discrete spectrum of six energy bins, which are hard coded in the software and limited to 125 keV as the upper energy currently modeled in the highest energy group. In Geant4 the beam fluence varies continuously in energy and 107 photons are generated per each view, in order to obtain results with statistical uncertainty below 1% for most organs. For all cases, a helical scan with a pitch of 0.9 was simulated including the bowtie filter, angular, and longitudinal tube current modulation, and overrange collimation. The source was translated a total distance of 14.4 cm longitudinally. Although the distance of 14.4 cm does not represent a clinical scan length, this value was selected in order to evaluate several aspects of interest. First, the scanned length represents the central portion of the phantom. This guaranteed that the overrange collimation effects were clearly visible at the beginning and at the end of the scan. Also, by avoiding the coverage of the whole phantom, this work was able to evaluate the agreement between the two codes for partially irradiated organs, or organs where the effect of the overrange is substantial, such as the liver. Helical scans were modeled for 4-cm nominal collimation at isocenter for all cases, unless otherwise specified. The scanner was modeled with a source to isocenter distance of 60 cm, a source to detector distance of 120 cm, and a detector size of 8 × 100 cm2 for the 4-cm collimation. In Geant4, 200 sources were simulated for each 360° rotation, with an angle increment of 1.8°. The previous Acuros study of a simpler CT scanner configuration suggested that 18 views per rotation with an angular increment of 20° provided adequate accuracy12. In this study, 18 views per rotation were modeled in the initial investigations of voxel downsampling, while a study on the optimal number of views considering scanner effects was also performed.
2.2.1. Modeling of the bowtie filter
A mathematical model of a typical medium bowtie filter of a Siemens scanner was modeled as aluminum of density 2.7 g/cm3, with different thicknesses as a function of the incident beam angle10. To model the bowtie filter both in Acuros and Geant4, the bowtie was implemented analytically, rather than a physical model within the simulated geometry. In order to do so, the fluence of each photon exiting the source was attenuated depending on the thickness of the bowtie filter along the direction of the ray, accordingly to the Beer-Lambert law. In Geant4, as in any other Monte Carlo code, the x-ray beam varies continuously in space resulting in a continuous model of the bowtie filter. In Acuros the beam is defined by discrete rays, with 47 rays used in this study to model the fan beam distribution. In this latter case, a custom routine in MATLAB generated 47 x-ray spectra attenuated according to the bowtie thickness across the fan angle and within the collimation of the beam. X-ray spectra for rays in between these 47 rays were linearly interpolated from their nearest neighbors.
2.2.2. Modeling of the overrange collimation
The overrange region is the scan length that extends beyond the volume of the reconstructed image that is required for helical scanning and that results in unnecessary dose to the patient. To avoid this exposure, some CT scanners implement overrange collimation, for which the beam is collimated across the cone angle at the beginning and at the end of a helical scan, whereas other scanners, such as the GE Revolution, maintain a constant aperture of the beam across the helical scan25. Furthermore, different scanners can be characterized by different collimation patterns, as is the case for Siemens Somatom Force and Philips iQon, which both implement the same overrange collimation but, for example, differently from the GE Lightspeed VCT and GE Discovery 750HD25. In this work, the collimation scheme of the Siemens Somatom Force / Philips iQon scanners is adopted. For the first view of the scan, the overrange collimation limits the exposure coverage to half of the detector rows, i.e. for a nominal collimation of 4 cm at the isocenter, exposure is limited to 2 cm for the first view. As the scan advances and the view angle changes, the overrange collimation is reduced by a quantity equal to the scan length traveled per each projection view, resulting in more exposure. As the tube approaches the end of the scan, the overrange collimation is gradually adjusted in the opposite manner. This dynamic adjustment depends on the scan length traveled per each view.
2.2.3. Modeling of the tube current modulation
A previously validated custom MATLAB program generated tube current modulation profiles for each studied phantom26, modeling longitudinal + sinusoidal angular tube current modulation (SmartmA, GE Healthcare, Chicago IL). The MATLAB routine is a proprietary model that takes as input the noise index and the scout. The algorithm determines the maximum tube current (lateral projection directions) and minimum tube current (anterior-posterior projection directions) for each longitudinal position based on object attenuation, shape, and the desired noise index. The tube current is modulated sinusoidally for each angular view based on the maximum and minimum determined for each longitudinal position. Depending on the simulation study, the noise index was set between 18 and 32, which represents realistic noise index settings in clinical scanners. For beams with peak voltage of 120 kV and 140 kV, the noise index was set to 18. For lower kV, the noise index had to be increased to higher values: 25 for 100 kV and 32 for 80 kV. Regarding the scout input, a scout image of each anthropomorphic phantom was computationally generated as the AP projection of the linear attenuation coefficients for each material of the phantom assuming a 120-kV spectrum. Figure 1 (a) and (b) present the computationally generated scout, with the tube current modulation profiles shown for helical scans modeled with 2-cm and 4-cm nominal collimation measured at isocenter. The generated profiles were normalized to the maximum tube current value. For the Acuros implementation, the normalized profiles were used to scale the fluences modeled as exiting the source for each projection angle. In Geant4, the tube current modulation values were used to weight the dose output for each view. The gold standard simulations modeled 200 modulations per rotation, while the Acuros implementation modeled fewer modulations per rotation, due to the increased discretization (4 to 40 views per rotation investigated).
Figure 1.
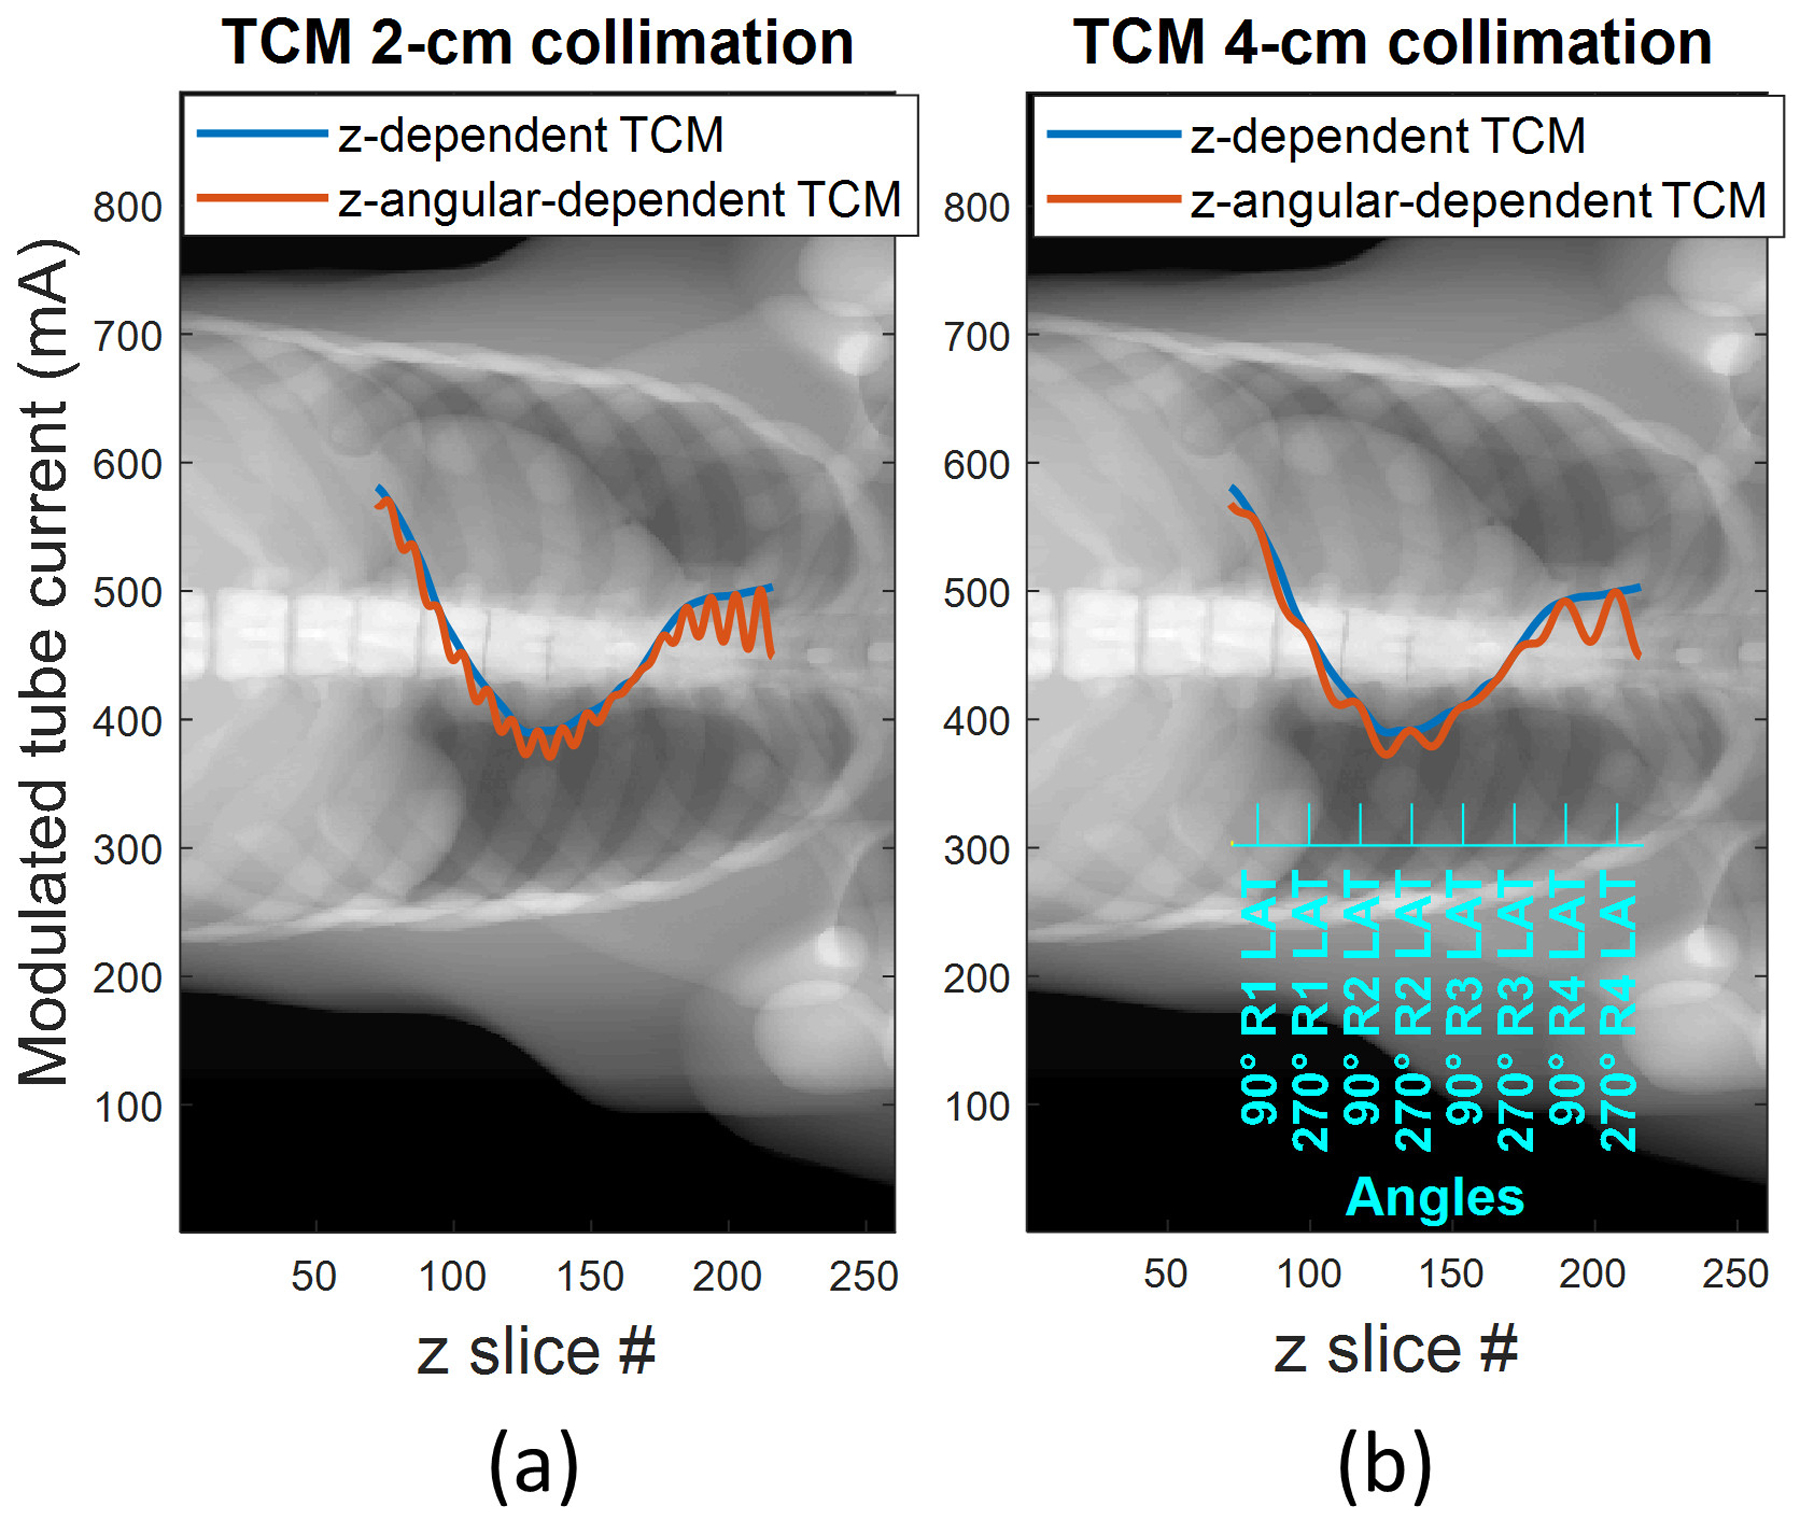
Tube current modulation profiles (longitudinal and longitudinal + sinusoidal angular modulation profiles in blue and orange respectively) plotted over a synthetic AP scout of dimension 260 voxels (X axis) × 888 voxels (Y axis), for (a) 2-cm collimation and (b) 4-cm collimation scenario. The latter shows the correspondent view angle on the blue axis, demonstrating that the sinusoidal maxima occur when the projection is in the lateral direction.
2.3. Studies performed
All studies in this paper modeled the bowtie filter, overrange collimation, and longitudinal + angular TCM. Studies were performed to investigate the effects of voxel sampling and angular sampling while modeling these scanner effects in Acuros. Studies were also carried out for different source spectra and patient models.
2.3.1. Optimal voxel downsampling
The voxelized anthropomorphic phantom employed in the AAPM Task Group 195 was used as a test case in a study of optimal voxel downsampling. For the Geant4 implementation, the original phantom voxel size of 1×1×1 mm3 was used. Because Acuros is limited by the memory of the GPU, the phantom was downsampled to voxels of dimensions of: 10×8×1, 8×8×2, 5×5×5 and 4×5×4 mm3, with Monte Carlo providing the ground truth for all cases. Seventeen organs are defined and labeled in this phantom, with exact compositions and mass densities provided in the report. Helical scans were modeled for two different beam thicknesses: 2-cm nominal collimation and 4-cm nominal collimation measured at isocenter. Although in clinical practice the actual radiation beam width at the isocenter is slightly larger than the nominal collimation to ensure complete coverage of all the detector rows and due to penumbra effects, this was not considered in the present study for either simulation code. The 120-kV spectrum from AAPM TG 195 dataset was modeled in this study. In order to cover the same scan length, 4 and 8 rotations were modeled for the 4-cm and 2-cm collimation cases, respectively. Table 1 presents the relevant parameters of the simulations for this study.
Table 1.
Parameters used for the study of voxel downsampling for the 2-cm and 4-cm collimation cases.
| 2-cm collimation / 120 kV | 4-cm collimation / 120 kV | |||
|---|---|---|---|---|
| Acuros | Geant4 | Acuros | Geant4 | |
| No. views per rotation | 18 | 200 | 18 | 200 |
| No. rotations | 8 | 8 | 4 | 4 |
| Scan length traveled per view (cm) | 0.1 | 0.009 | 0.2 | 0.018 |
| 4×5×4 mm3 | 4×5×4 mm3 | |||
For all studies, the dose was calculated for each organ and each method in eV/g as the average of the dose values within the boundaries of the organ. The measure used to quantify the agreement between Acuros and GEANT4 was the root-mean-squared organ dose error (RMSE), excluding the organs that absorb less than 0.1% of the total deposited energy. More specifically, the RMSE of the Acuros organ dose estimates (DoseA) relative to the ground truth Geant4 organ dose estimates (DoseG4) is defined as
where the sum is performed over all N organs that each absorb more than 0.1% of the total deposited energy.
2.3.2. Optimal views per rotation
The LBTE accuracy may be limited by the discretization in angle and space. A sensitivity study was performed in order to determine the optimal number of projection views to be applied in Acuros, to ensure a low simulation time without compromising the accuracy of the result. Wang et al.12 suggested that 18 views per rotation are a good compromise between accuracy and low simulation time. However, both the TCM and overrange collimation models implemented in this current study are affected by the discretization in view angle. Therefore, a higher number of projection angles might be required to achieve accuracy when considering these scanner effects. This study, described in Table 2, investigated Acuros for varying number of views per rotation: 4, 5, 8, 12, 18, 24, 30, 40, and 200.
Table 2.
Parameters used for the study of the optimal views per rotation.
| 4-cm collimation / 120 kV | ||
|---|---|---|
| Acuros | Geant4 | |
| No. views per rotation | 4, 5, 8, 12, 18, 24, 30, 40, 200 | 200 |
| No. rotations | 4 | 4 |
| Scan length traveled per view (cm) | 0.9, 0.72, 0.45, 0.3, 0.2, 0.15, 0.12, 0.09, 0.018 | 0.018 |
| 5×5×5 mm3 | 1×1×1 mm3 | |
Because of the different angular discretization for the MC implementation (200 views per rotation) compared to Acuros (4 to 40 views per rotation), Geant4 modeled 444 overrange collimation adjustments whereas 18 to 178 adjustments were implemented in Acuros, which are proportional to the ratio between the size of the detector (8 cm) and the scan length traveled per each projection view.
2.3.3. Varying source spectra
Acuros defines the spectral distribution in six energy groups. The objective of this portion of the study was to determine if the discretization in energy of the spectral distribution affects the accuracy of the resulting dose estimates. Three different source spectra were modeled, with peak voltages of 80, 100, and 140 kV. Acuros output is given in terms of fluence, and the dose in each voxel is obtained with equation (1). Relevant parameters for this study are listed in Table 3.
Table 3.
Parameters used for the study of different source fluence spectra.
| 4-cm collimation / 80 kV, 100 kV, 140 kV | ||
|---|---|---|
| Acuros | Geant4 | |
| No. views per rotation | 18 | 200 |
| No. rotations | 4 | 4 |
| Scan length traveled per view (cm) | 0.2 | 0.018 |
| 5×5×5 mm3 | 1×1×1 mm3 | |
2.3.4. Varying anthropomorphic phantoms
The purpose of this study was to validate Acuros across a range of patient model sizes. The tool 4D Extended Cardiac-Torso (XCAT) version 2.027 from Duke University was used to generate three additional voxelized anthropomorphic phantoms: one pediatric and two adults. The phantoms output by XCAT have approximately 3000 defined organs and tissues. Of these, only the organs that were defined in the TG 195 phantom were considered in the organ dose calculations. The remaining tissues or organs not specified in the TG 195 phantom model that have similar composition to water (such as connective tissues) or muscle, were considered as soft tissue with composition as defined in the TG 195 report. Bone structures were modeled as cortical bone. Also, the phantoms output by XCAT have isotropic voxels of 1.5 mm size. In Geant4 this voxel size was maintained whereas in Acuros the voxels were downsampled to 4.5×4.5×4.5 mm3 for the pediatric phantom and 6.0×4.5×4.5 mm3 for the adult phantoms, due to memory constraint. Table 4 specifies the height, weight, and BMI for each patient model. The protocols specified in Table 3 were applied, and the tube current modulation profiles were changed accordingly for each phantom and tube spectra.
Table 4.
Height, weight, and BMI for each XCAT-generated anthropomorphic phantoms and corresponding protocol.
| Phantom | Height (cm) | Weight (kg) | BMI | kV |
|---|---|---|---|---|
| Female_Ped | 119.5 | 22.9 | 16.0 | 80 |
| Female_Adult | 162.0 | 66.4 | 25.3 | 100 |
| Male_Adult | 176.5 | 100.0 | 32.1 | 120 |
2.4. Alternative method to calculate mass energy absorption coefficients using MC fitting
Dose calculation is challenging for the deterministic solver in the proximity of tissue interfaces, especially in the presence of density heterogeneities (e.g., soft tissue versus bone tissue) where large fluence exchange takes place. In this case, Monte Carlo calculation is the most reliable method for dose calculation. As explained in section 2.1, Acuros outputs fluence that is later converted to dose by equation (1) using the energy-weighted mass energy-absorption coefficients Ki,g. In Section 2.1 we proposed calculating the Ki,g using NIST energy absorption databases. In this section we explored an alternative method that integrated Monte Carlo for the calculation of the Ki,g. This accounts somewhat for scattering and beam hardening that take place inside the irradiated heterogeneous objects. The alternative here proposed is to adopt an empirical approach to estimate the coefficients. Simulations that modeled the bowtie and overrange collimation, but without tube current modulation, were implemented both in Acuros CTD and in Geant4 with the TG 195 anthropomorphic phantom. The Ki,g coefficients were then obtained by minimizing the residual error between the output of the two methods (fluence for Acuros CTD, dose for Geant4). The constraints of the least square fitting were set equal to ± 10% of NIST-derived absorption coefficients, which are weighted by energy according to the spectral distribution of the beam. The ± 10% is a tolerance applied so that the process estimates a small correction to the NIST-derived coefficients to account for beam hardening and scatter inside the object. A set of Ki,g coefficients was estimated by this method for each of the investigated spectra (80 kV, 100 kV, 120 kV, 140 kV). These alternative Ki,g coefficients were investigated in a study using the anthropomorphic phantoms described in Section 2.3.4, which are different than the phantom used to estimate the coefficients.
3. RESULTS
Throughout the results, the Geant4 MC results are considered ground truth, as our Geant4 code was previously validated against task 5 of the TG 195 report with differences within 1%, excluding the least exposed organs.
3.1. Optimal voxel downsampling
Four different voxel sizes were investigated in Acuros, with Geant4 providing the ground truth with voxels of 1×1×1 mm3. Figures 2 and 3 show the spatial distribution of dose for the 2-cm collimation and 4-cm collimation, respectively, for the case of 5×5×5 mm3 Acuros voxel sampling. The displayed dose maps in all figures correspond to the central slices of the phantom for the axial, coronal and sagittal views. The angle of the entry dose changes with slice position due to the helical scan trajectory, such that the entry dose distribution depends on the slice visualized. For the axial slices presented in Figures 2 and 3, the source was located anterior to the TG 195 patient. The resulting dose maps were similar, although stochastic noise is evident in the Geant4 maps. The difference maps show that the highest errors were found especially in the bone tissue.
Figure 2.
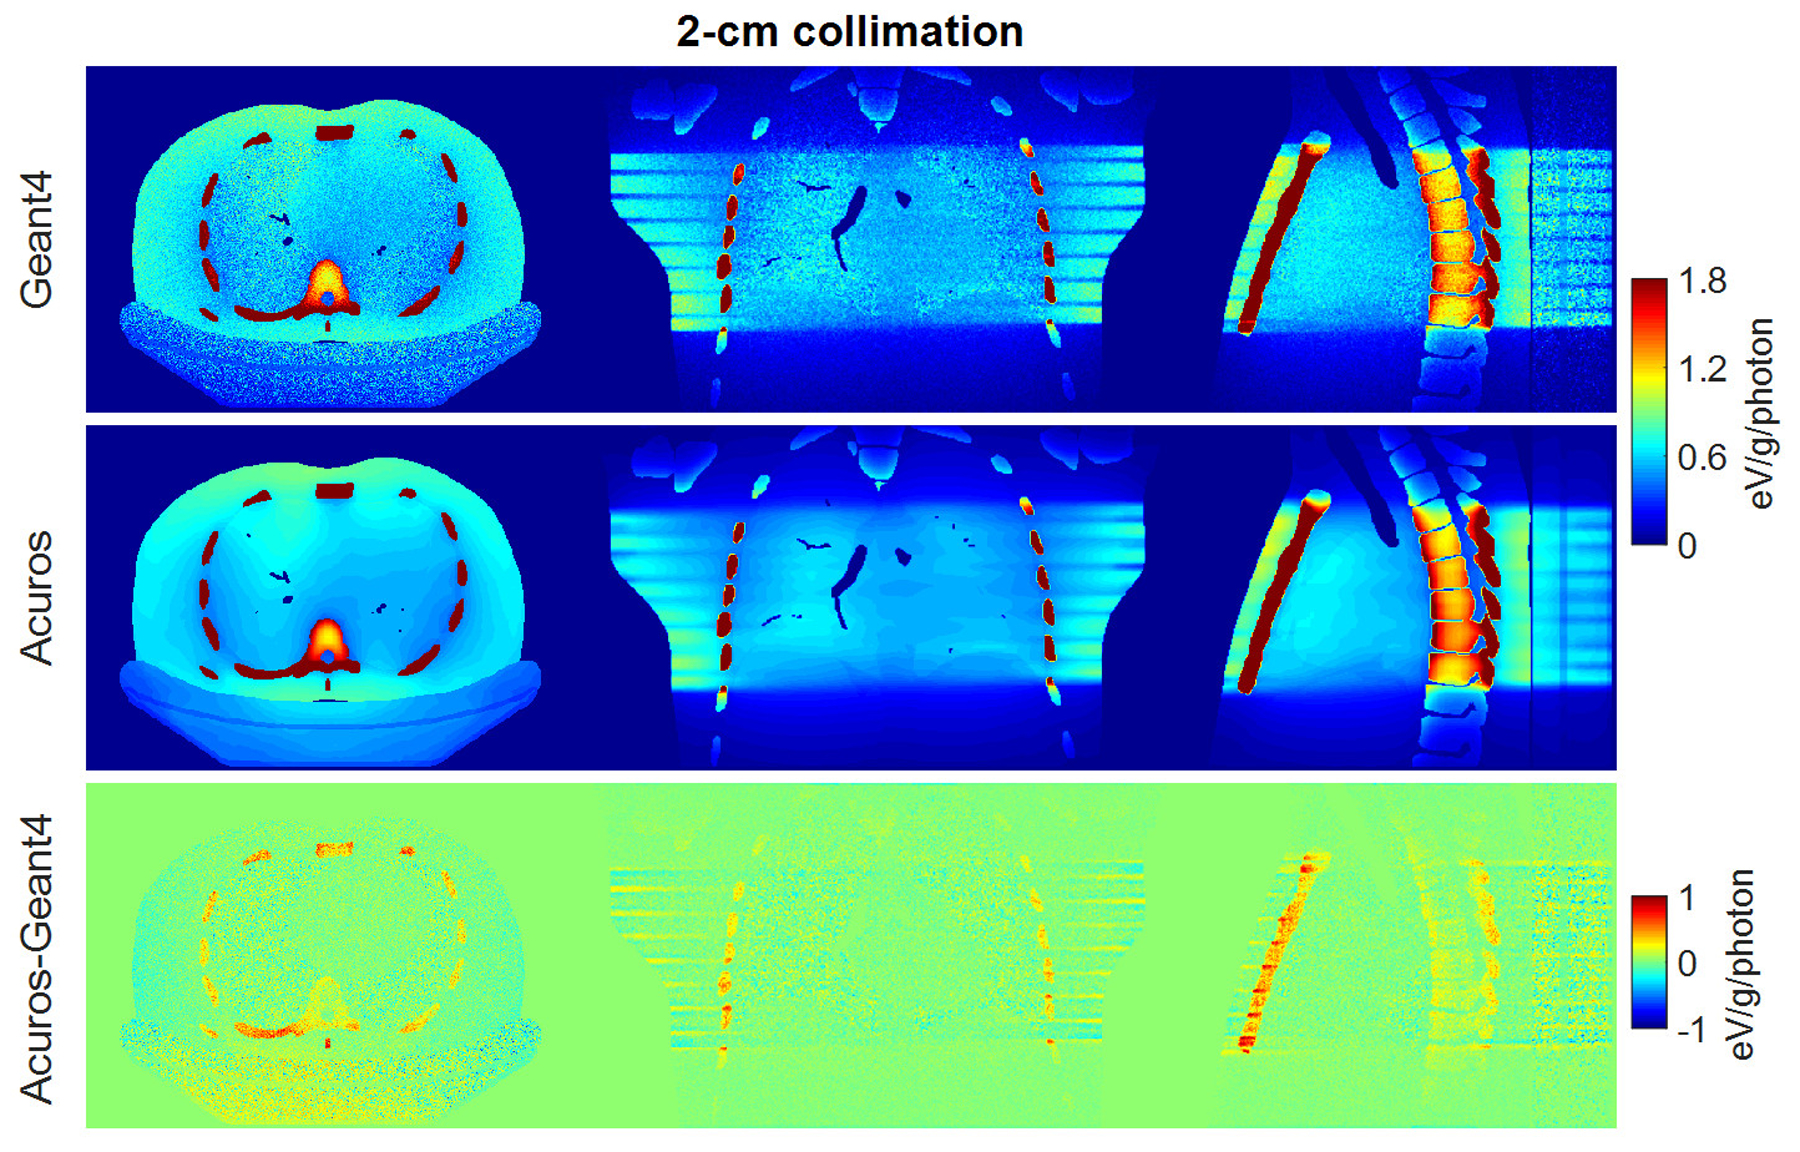
Dose maps in Geant4 (top) and Acuros (middle) for the case of 2-cm collimation, shown with window of [0, 1.8] eV/g/photon. Difference image Acuros-Geant4 (bottom), shown with window of [−1, 1], for the axial, coronal and sagittal views, displayed from left to right.
Figure 3.
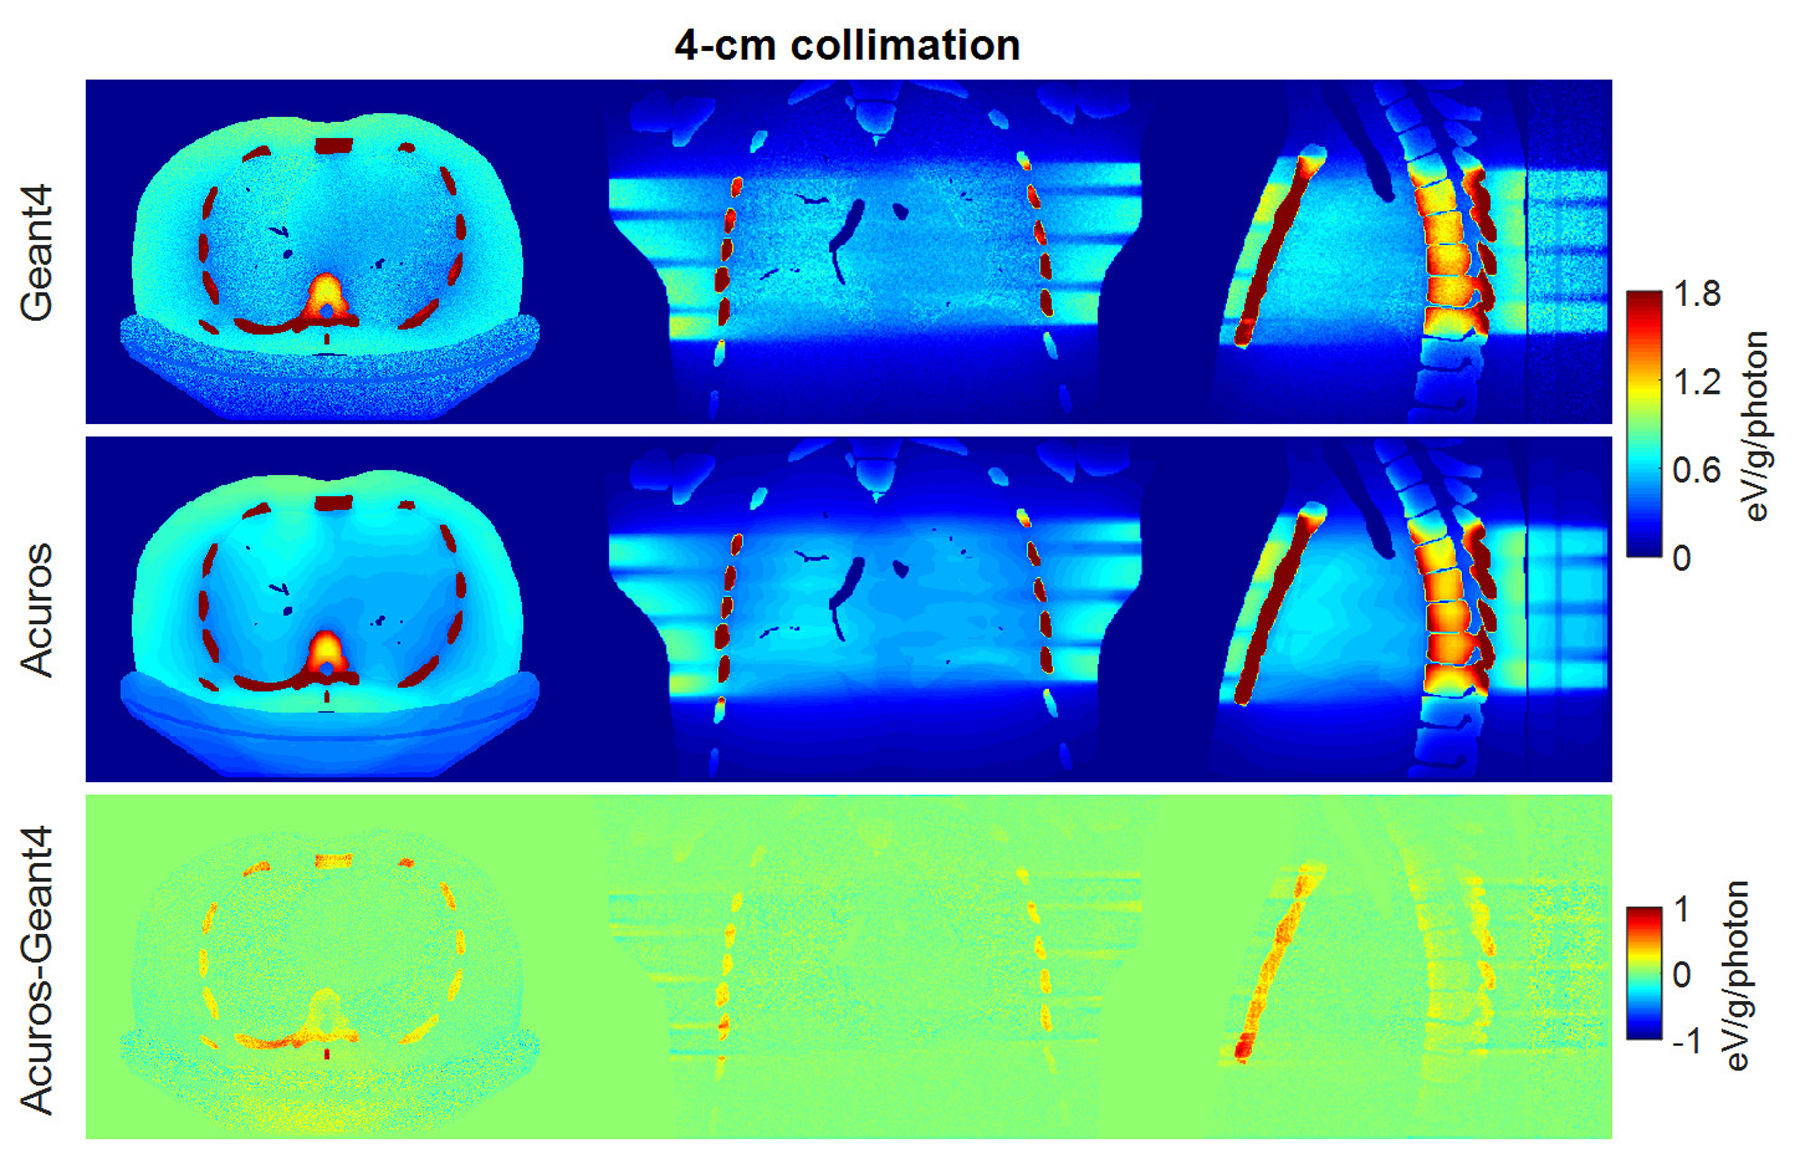
Dose maps in Geant4 (top) and Acuros (middle) for the case of 4-cm collimation, shown with window of [0, 1.8] eV/photon/mm3. Difference image Acuros-Geant4 (bottom), shown with window of [−1, 1], for the axial, coronal, and sagittal views, displayed from left to right.
Figure 4 plots the dose in the 17 tissues or organs defined in the phantom, for the 2-cm and 4-cm collimation cases, and for all investigated levels of voxel sampling in Acuros.
Figure 4.
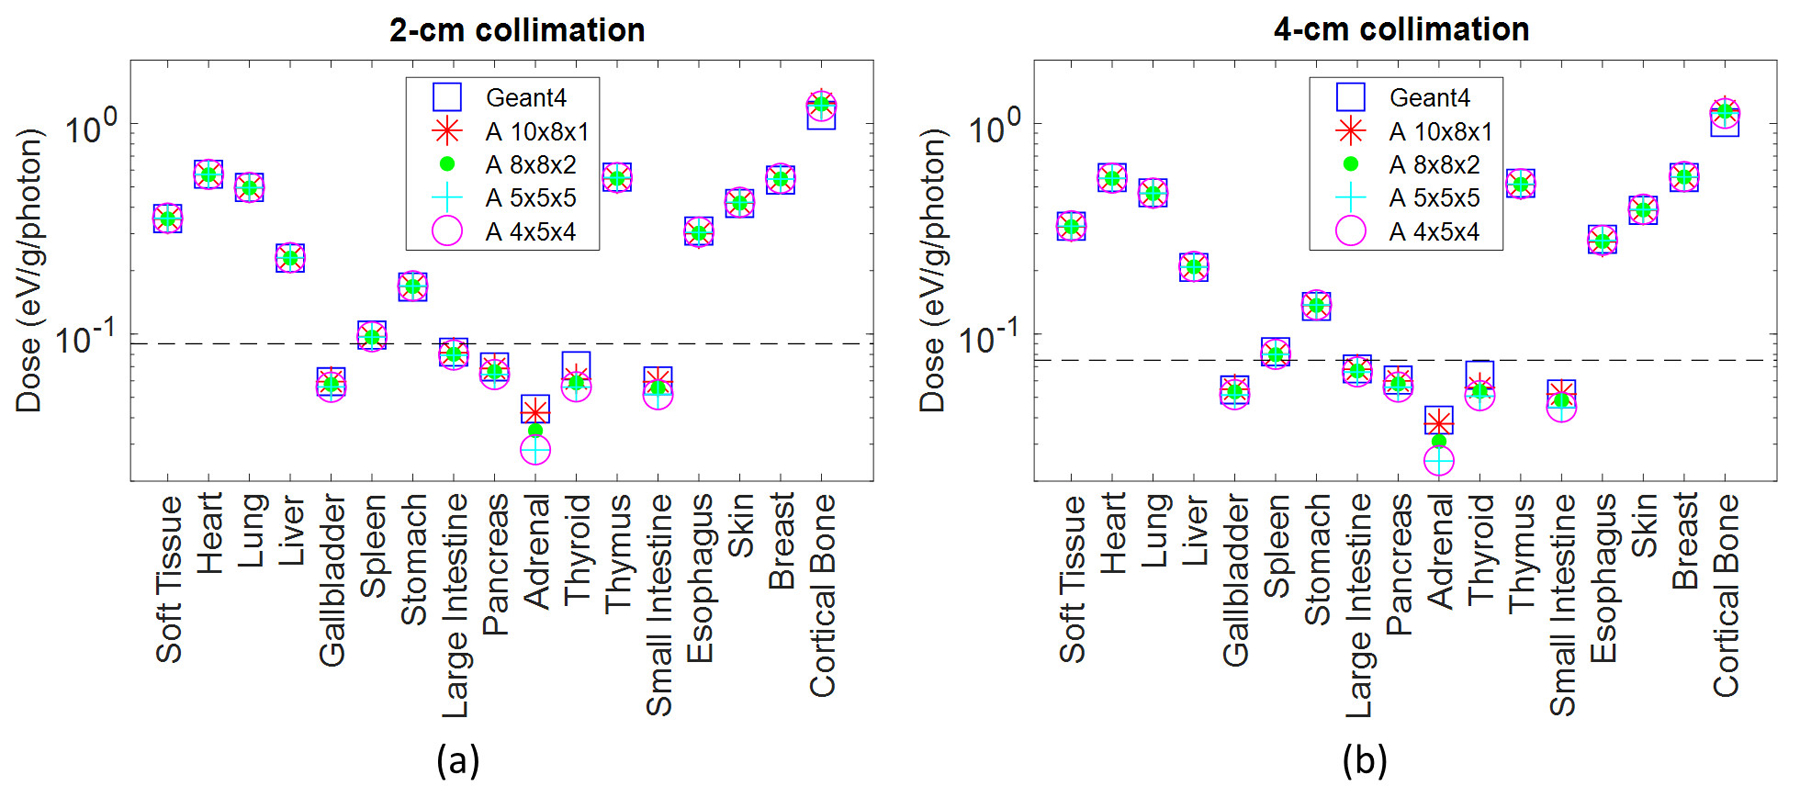
Dose in the 17 tissues or organs defined in the phantom for scanner modeling with 2- and 4-cm collimation. Soft tissue includes organs and tissues not specified in the TG 195 phantom model. The organs that absorb more than 0.1% of the total absorbed energy are above the dashed line. The ground truth Geant4 organ doses are plotted along with Acuros organ doses resulting from different voxel downsampling schemes.
Thinner voxels along the Z axis (8×8×2 and 10×8×1 mm3) generally resulted in higher accuracy for organs with low exposure, such as the adrenals. The error between Acuros and Geant4 for the adrenals was approximately 4% for the 10×8×1 mm3 voxel case and increased up to 36% for the 5×5×5 and 4×5×4 mm3 voxel dimensions. However, the deposited energy in the adrenals corresponds to 0.001% of the energy deposited to all organs, that is 8.3E3 eV/photon and 7.7E3 eV/photon for 2-cm and 4-cm collimation respectively, and the maximum absolute error for this organ was 0.03 eV/photon. The most irradiated organs are the ones above the dashed lines in Figure 4, and correspond to the organs with deposited energy > 0.1% of the total deposited energy in the phantom. Among those, the organ with the highest error between Acuros and Geant4 was the bone. For the 2-cm collimation, the bone error varied from 10.7% (4×5×4 mm3) to 14.2% (10×8×1 mm3), whereas it ranged from 10.5% to 14.0% for the 4-cm collimation. Across all other organs, the organ dose error varied between 0.1% (soft tissue) to 3.1% (spleen). The bone results demonstrate that the bone is the tissue most sensitive to the variation of the voxel downsampling. Isotropic voxels of 5×5×5 mm3 and 4×5×4 mm3 better model the bone tissue, whilst the error increases for 10×8×1 mm3 voxels. The improvement in bone accuracy with smaller voxels is likely due to the better phantom resolution along the axial plane (5×5 mm2 or 4×5 mm2 instead of 10×8 mm2), given that the estimation of the dose at the interface between soft tissue and bone (high density and high effective atomic number) can be critical. For the subsequent studies we chose isotropic voxels of 5×5×5 mm3 to improve accuracy for the most exposed organs and to reduce runtime. Specifically, the Acuros run time for the 4-cm collimation case was 35 seconds for the 10×8×1 and 4×5×4 mm3 sampling, and 22 seconds for the 8×8×2 and 5×5×5 mm3 voxels. For the 2-cm collimation case, where the number of total views is doubled, the run time for the 5×5×5 phantom linearly increased to 41 seconds.
RMSE values obtained for the studied levels of the downsampling are shown in Table 5.
Table 5.
RMSE for organs exposed to more than 0.1% of the total deposited energy.
| RMSE % (for organs > 0.1% total deposited energy) | ||||
|---|---|---|---|---|
| 4×5×4 mm3 | 5×5×5 mm3 | 8×8×2 mm3 | 10×8×1 mm3 | |
| 2-cm collimation | 3.1 | 3.2 | 3.8 | 4.0 |
| 4-cm collimation | 3.1 | 3.2 | 3.7 | 3.9 |
For both the 2-cm and 4-cm collimation configuration, the RMSE between the Geant4 and Acuros estimates was approximately 3.2% for isotropic voxel models (4×5×4 mm3 and 5×5×5 mm3) and approximately 4.0% otherwise.
3.2. Optimal views per rotation
The dependence of the run time and RMSE was studied in relation to the number of uniformly spaced projection views, keeping the voxel size constant (5 mm isotropic). Figure 5 plots the runtime and organ dose accuracy of Acuros for 4, 5, 8, 12, 18, 24, 30, 40 views per rotation. It shows that a good and conservative compromise between simulation time and accuracy, when accounting for scanner complexities, is reached when 18 views are modeled per rotation, while the run time increases linearly with the number of sources.
Figure 5.
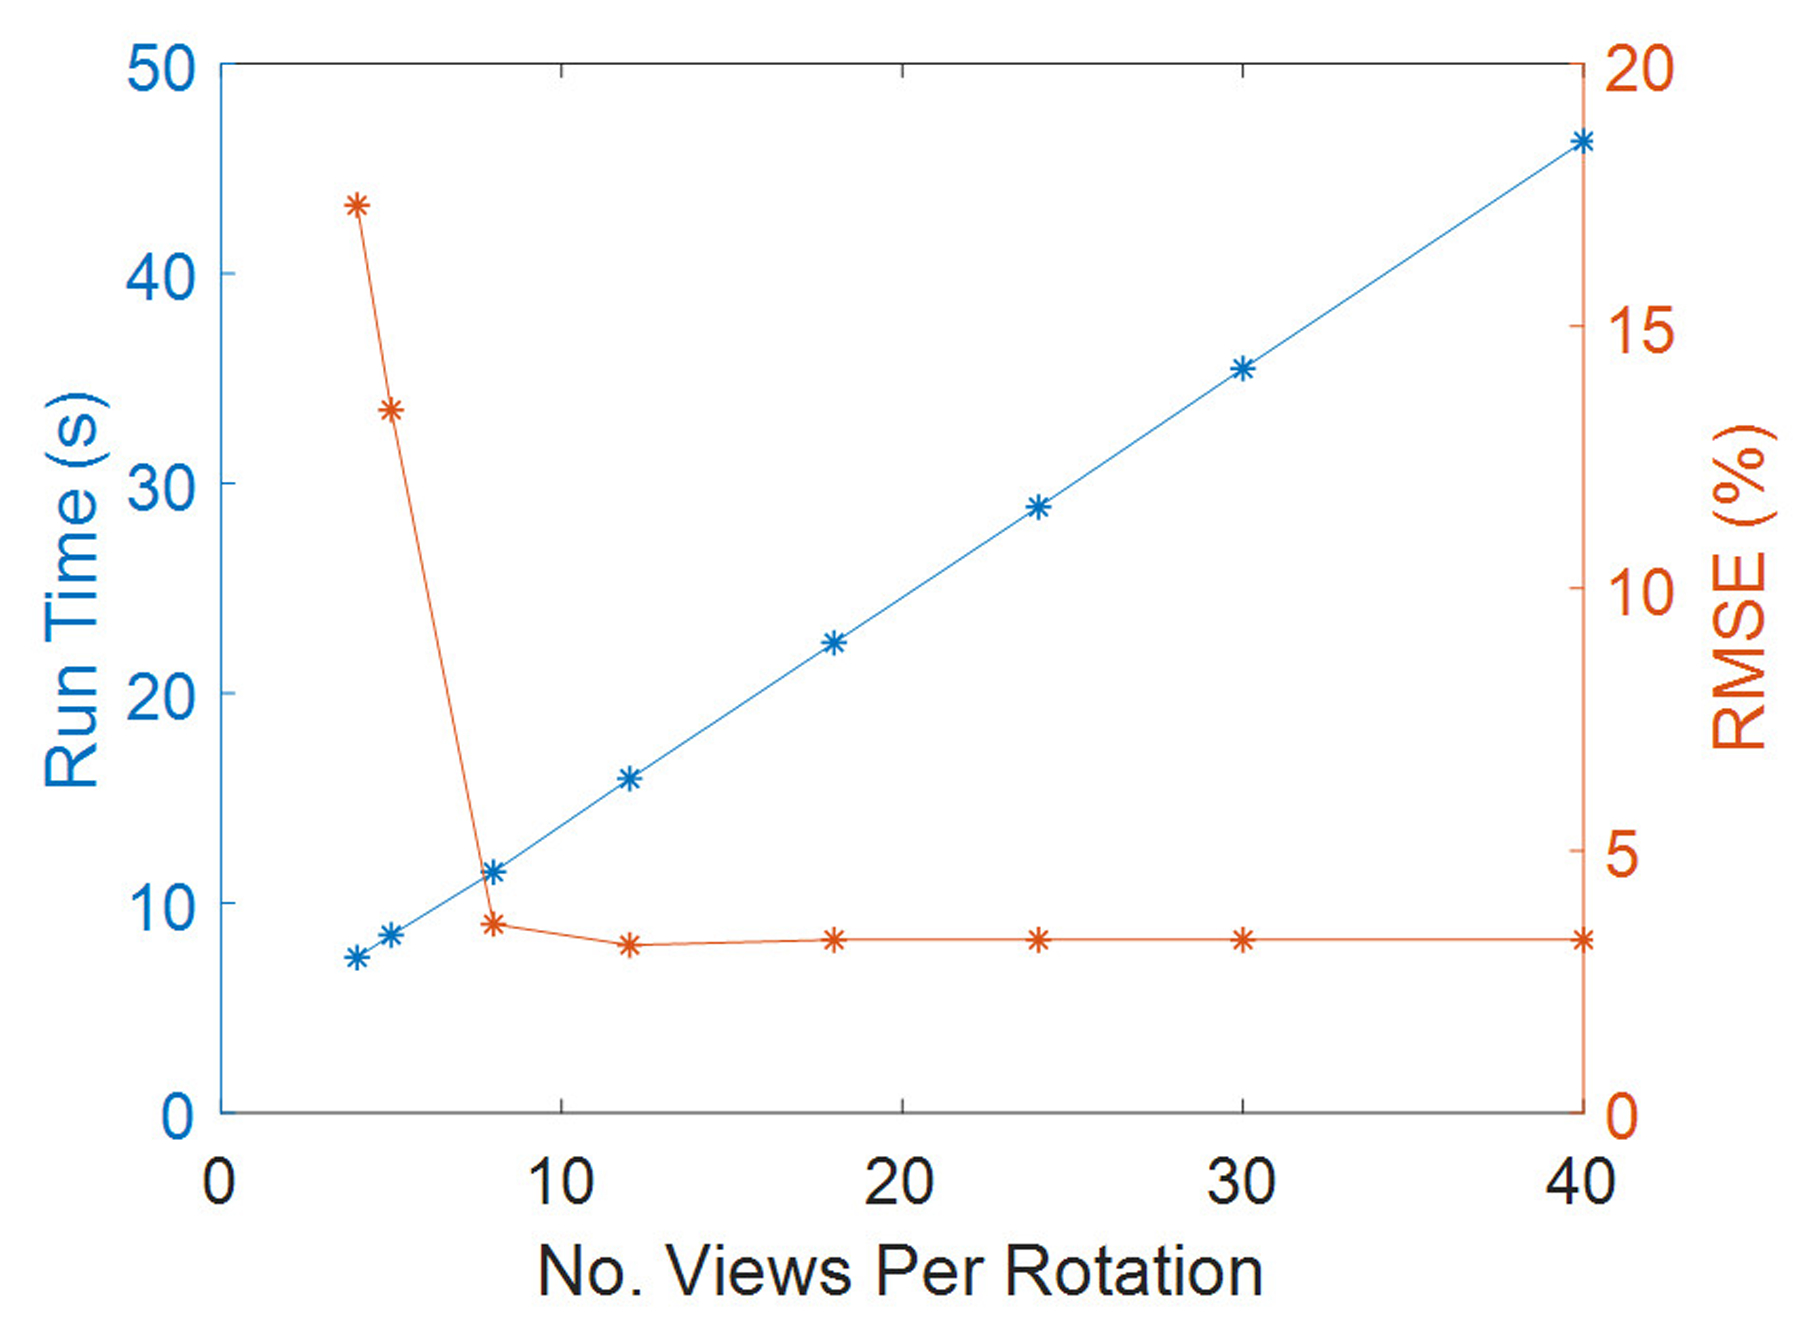
Run time and RMSE as a function of the number of the selected views per rotation for 4-cm collimation case.
Again, the bone was the organ with the highest error between Geant4 and Acuros, with approximately 10% error that was independent of the number of views per rotation. The breast was the organ most sensitive to the selected number of views, with errors of 35% (for 4 views/rotation) dropping to 1% (from 8 views/rot). To further quantify how the level of discretization of the number of projection views affected the results, simulations were repeated in Acuros for 200 views per rotation, as for Geant4. Consequently, overrange collimation adjustments and tube current modulation profiles were modeled accordingly. No improvements of the overall agreement for 18 and 200 views per rotation were observed.
3.3. Varying source spectra
RMSE for organs that absorb more than 0.1% of the total deposited energy was 4.2% and 3.5% for the spectra of 80 kV and 100 kV, respectively, while it increased to 5.7% for the 140-kV beam. The error increase might be due to the upper limit of 125 kV for the highest energy group currently modeled in Acuros. Of organs receiving more than 0.1% of the total deposited energy, the bone demonstrated the highest dose discrepancy between Acuros and Geant4, with Acuros overestimating the bone dose by approximately 10% with respect to Geant4, and followed by the esophagus, with dose error of approximately 5%. The dose maps are shown in Figure 6, 7, and 8. Figure 9 plots the dose in the 17 tissues or organs for the 80- and 140-kV beams, demonstrating high accuracy for the most exposed organs except for bone.
Figure 6.
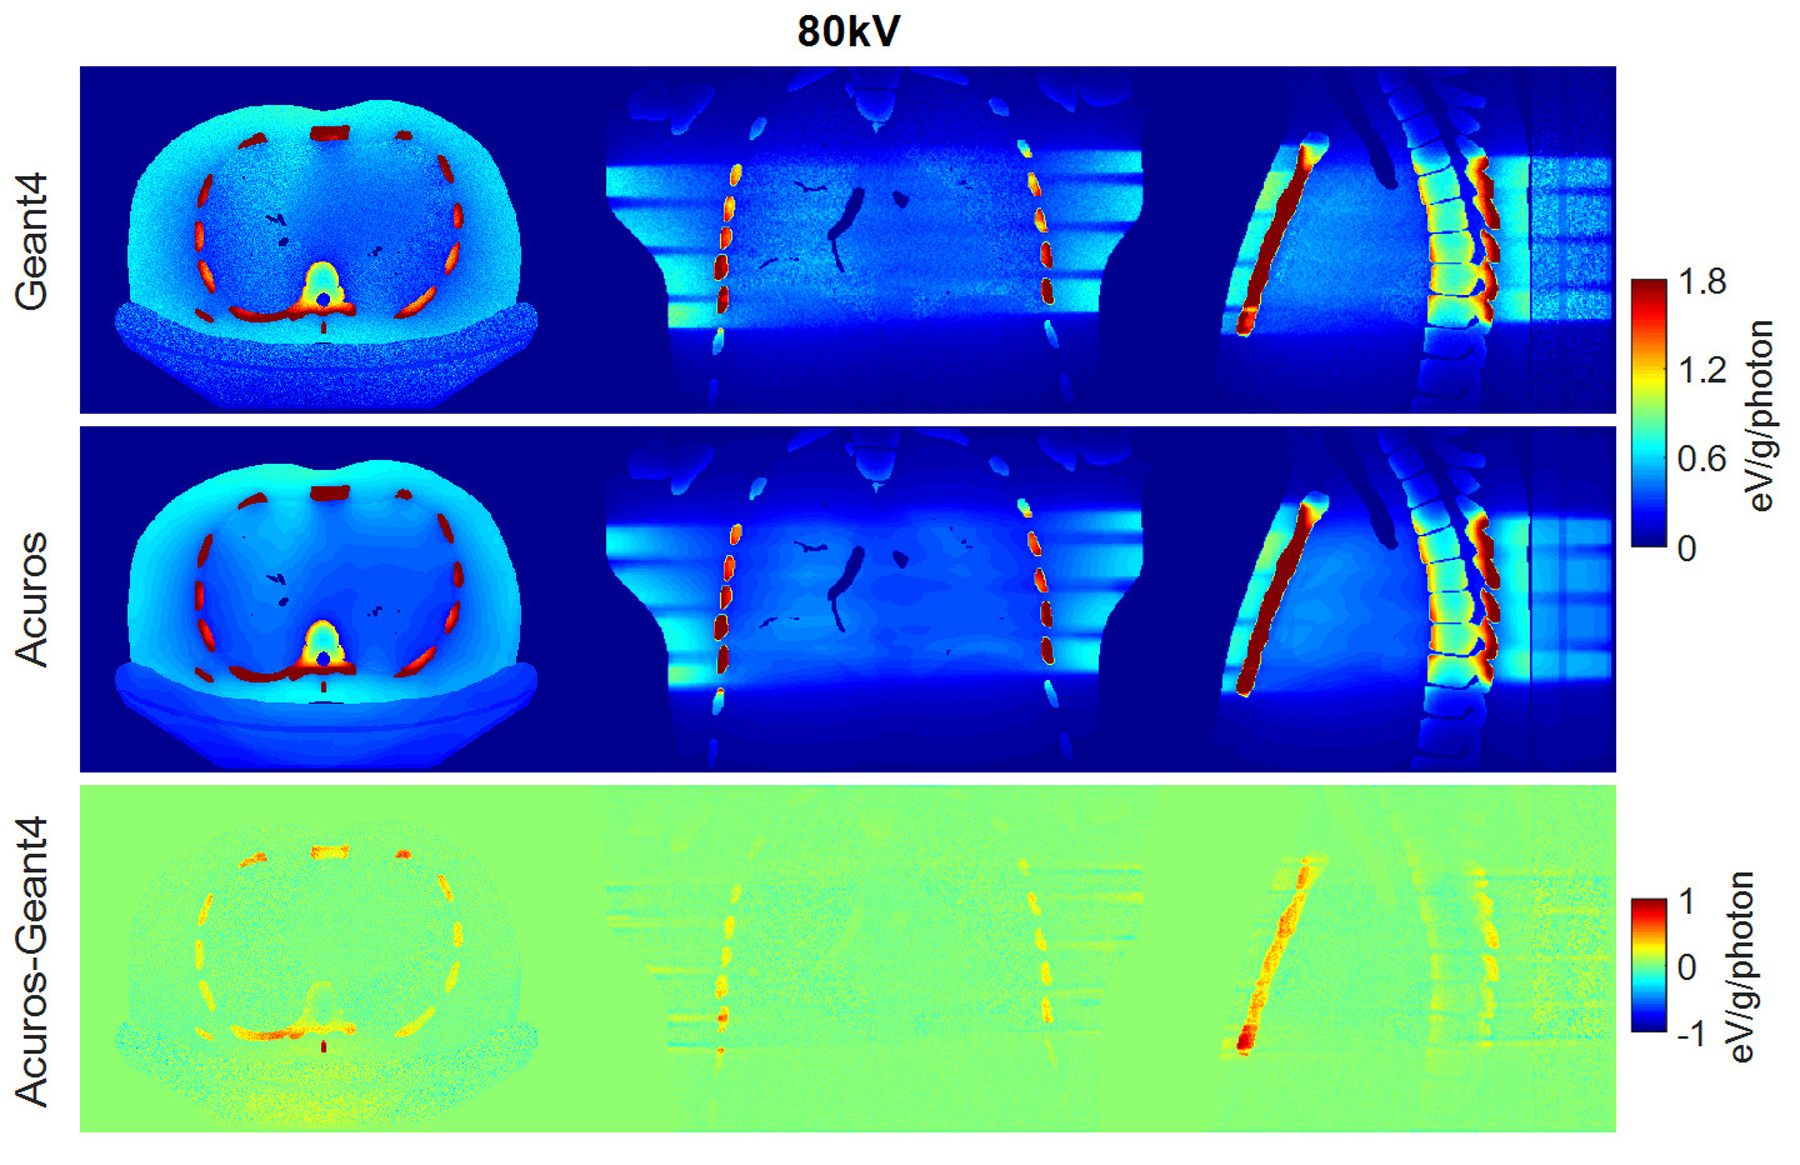
Dose maps in Geant4 (top) and Acuros (middle) for 80 kV, shown with window of [0, 1.8] eV/g/photon. Difference image Acuros-Geant4 (bottom), shown with window of [−1, 1], for the axial, coronal, and sagittal views, displayed from left to right.
Figure 7.
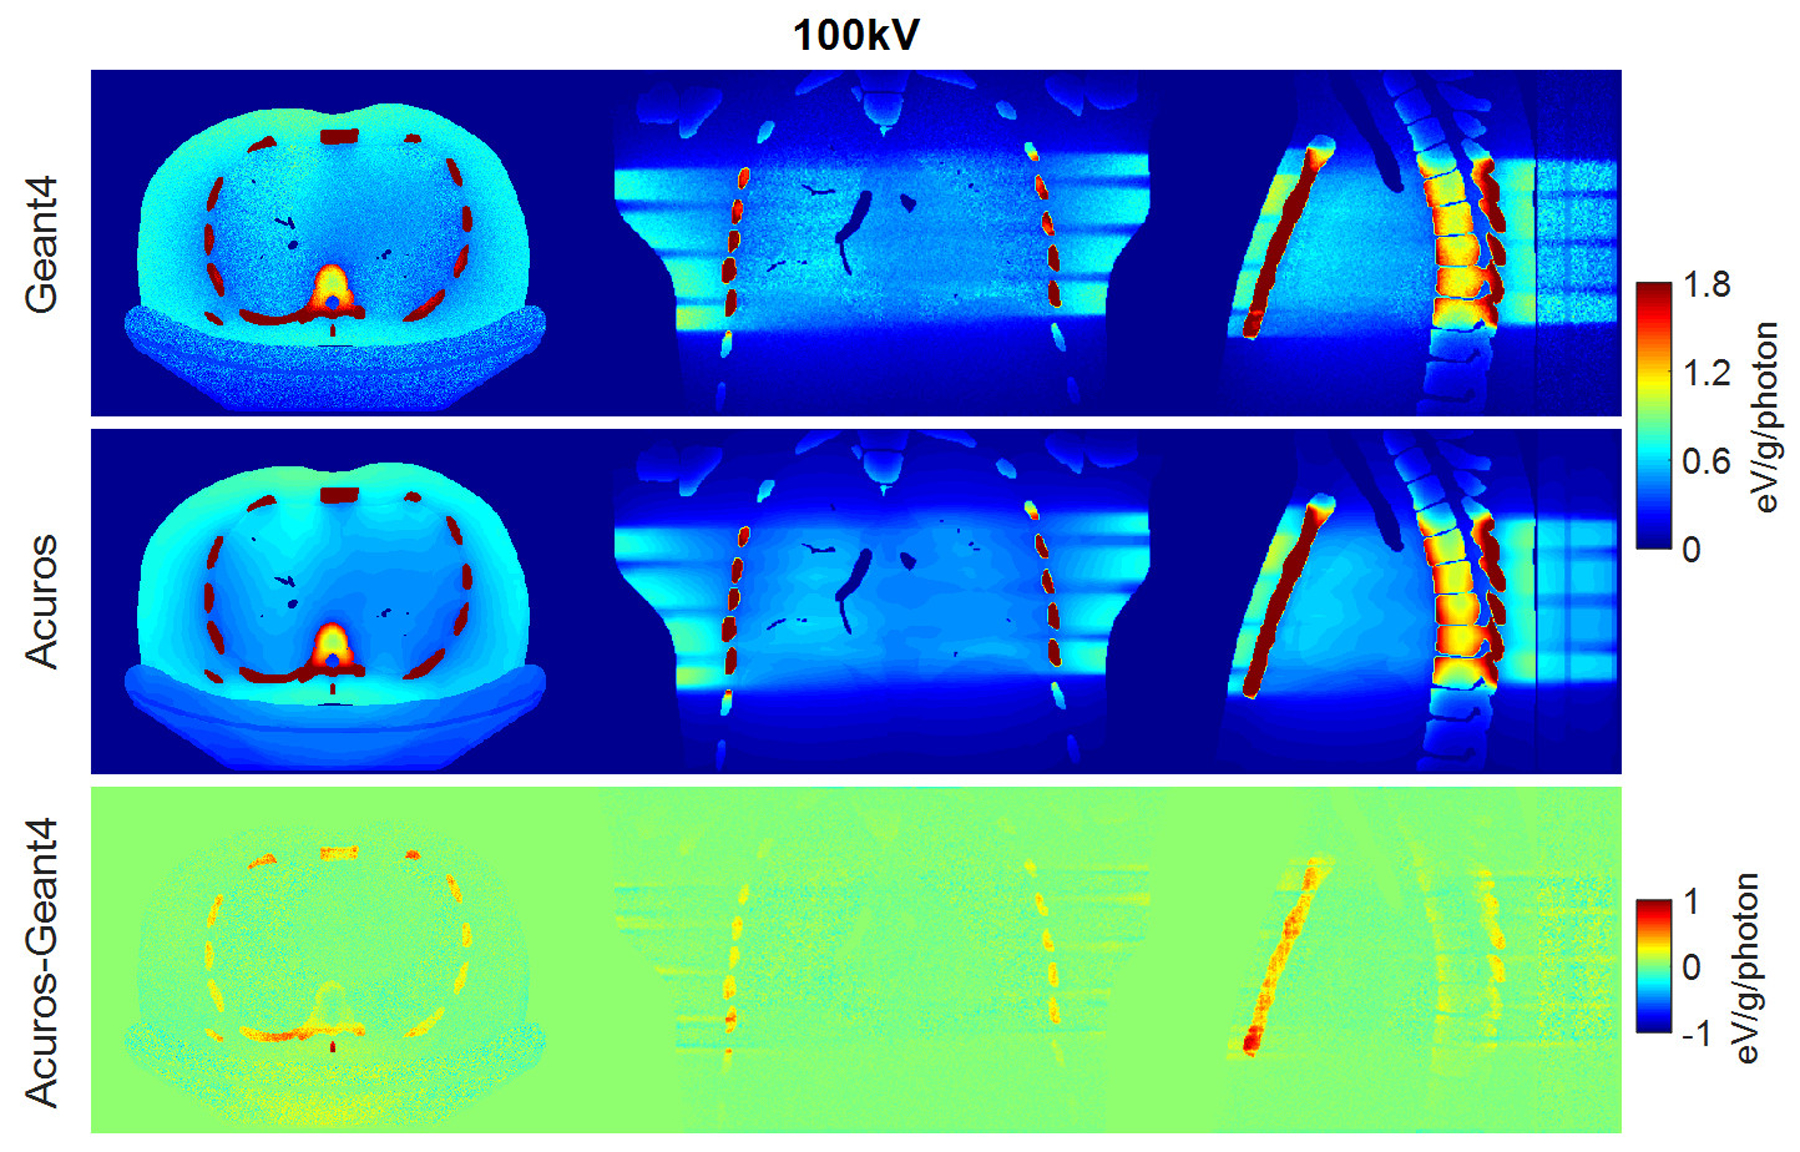
Dose maps in Geant4 (top) and Acuros (middle) for 100 kV, shown with window of [0, 1.8] eV/g/photon. Difference image Acuros-Geant4 (bottom), shown with window of [−1, 1], for the axial, coronal, and sagittal views, displayed from left to right.
Figure 8.
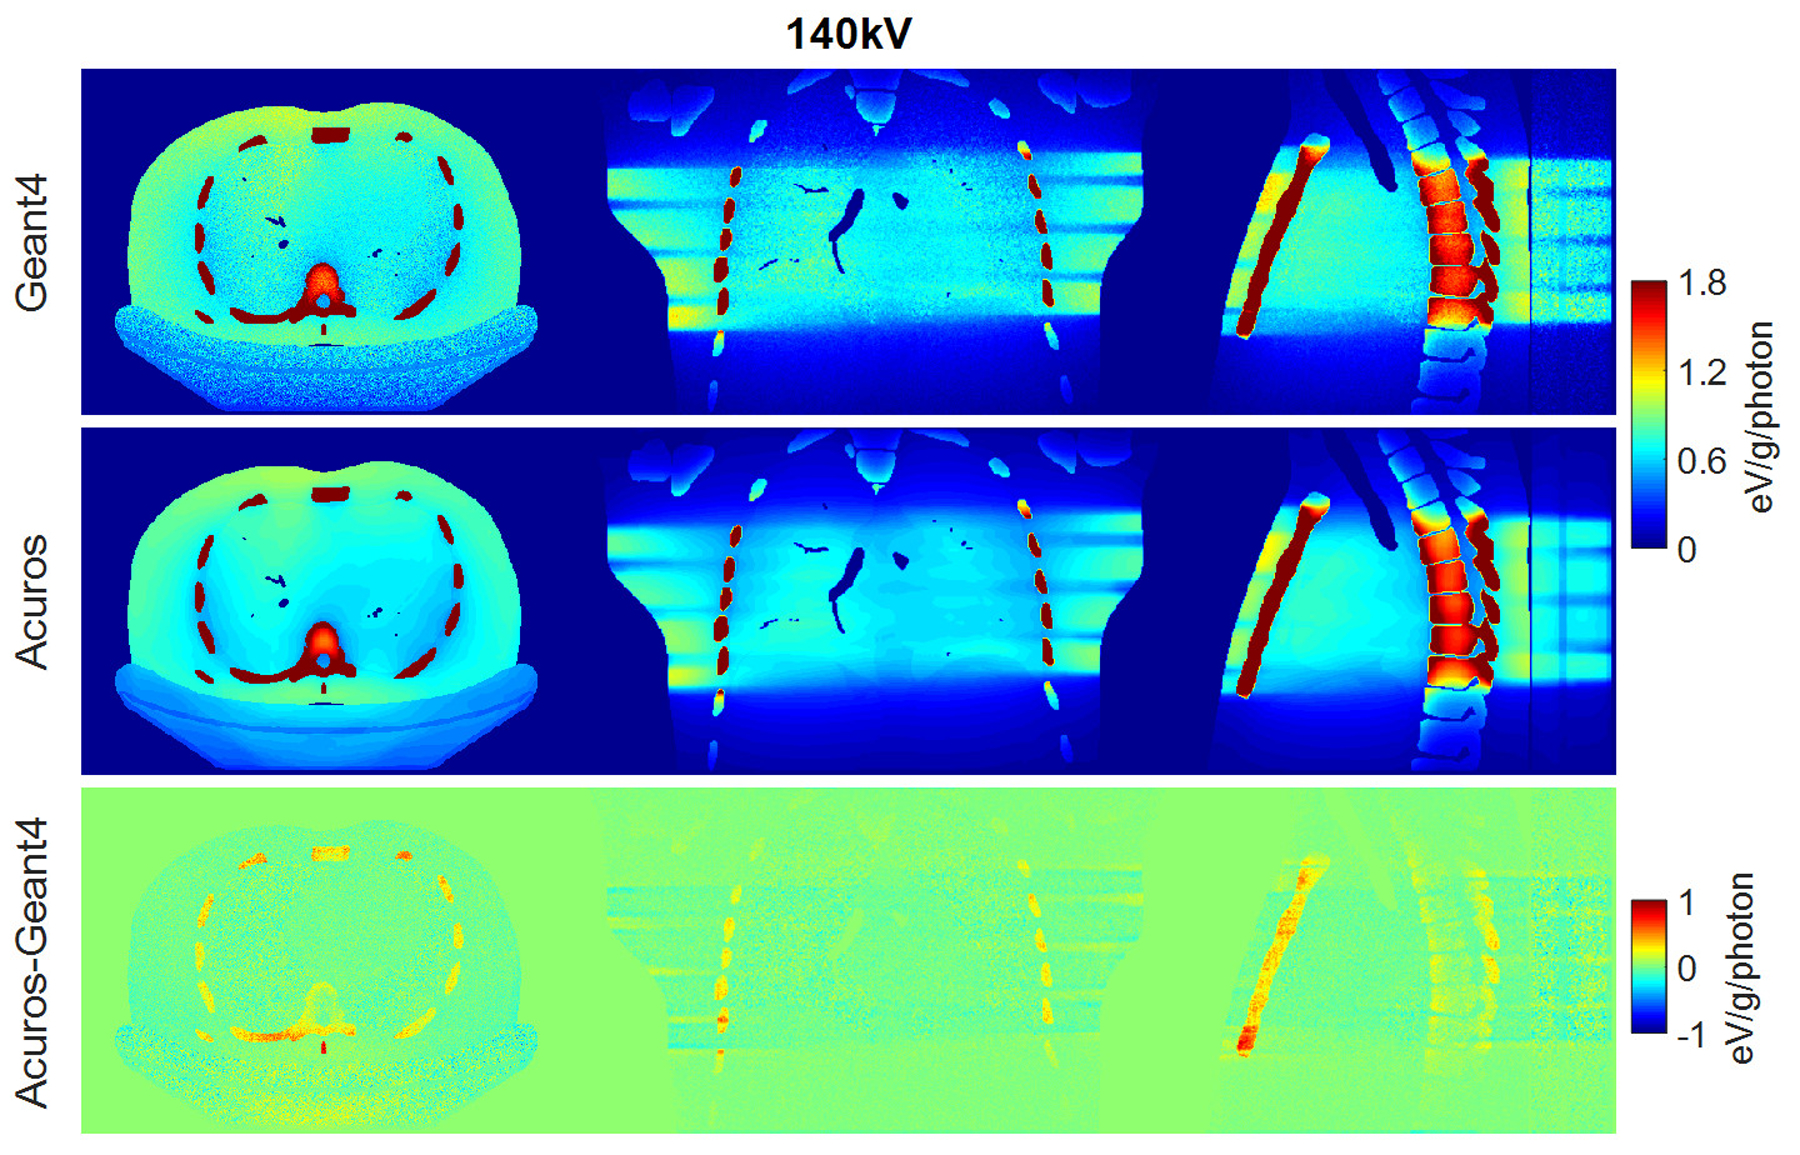
Dose maps in Geant4 (top) and Acuros (middle) for 140 kV, shown with window of [0, 1.8] eV/g/photon. Difference image Acuros-Geant4 (bottom), shown with window of [−1, 1], for the axial, coronal, and sagittal views, displayed from left to right.
Figure 9.
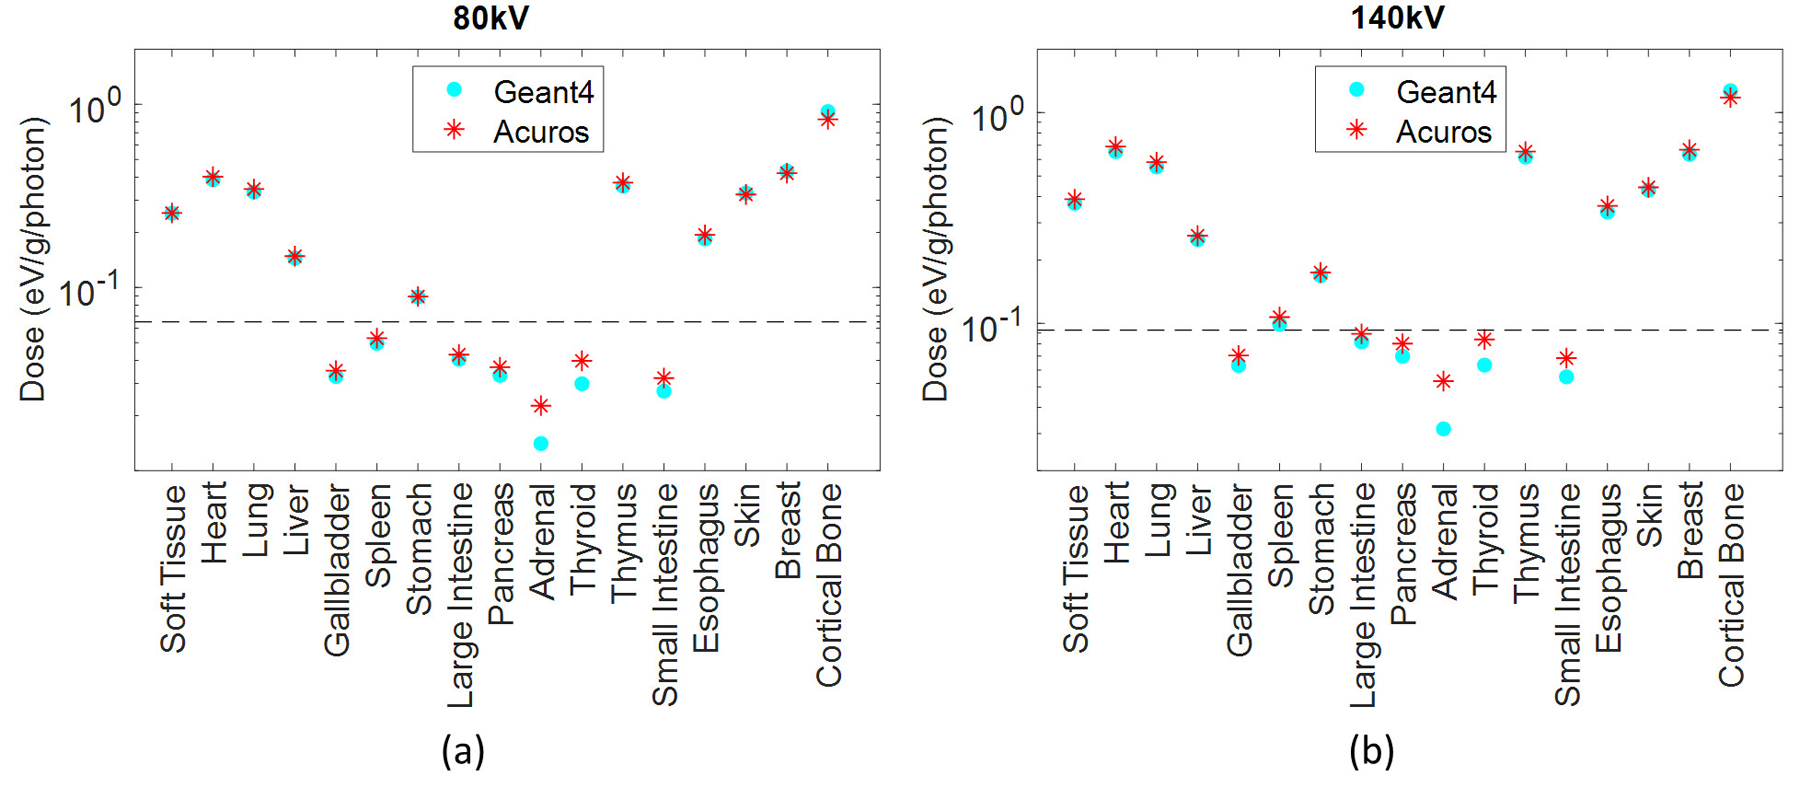
Dose in the 17 tissues or organs defined in the phantom for the (a) 80 kV and (b) 140 kV. The organs that absorb more than 0.1% of the total absorbed energy are above the dashed line.
3.4. Varying anthropomorphic phantoms
Good agreement was achieved for the different patient models. The RMSE was approx. 3.5% for all three phantoms. The bone entailed the highest errors among the most exposed organs, with errors of 11.2%, 9.6%, and 11.8% for the pediatric female, adult female, and adult male, respectively. The dose maps and the dose plot for the defined organs in the three phantoms are shown in Figure 10. The thyroid does not receive any dose for the adult phantoms due to the distance from the primary beam, but it receives a very low amount of dose for the pediatric phantom (Figure 10(d)). In this case, the thyroid is the least exposed organ and the one that shows the highest error between the two methods, with Acuros underestimating the dose by 38% compared to Geant4, and with a corresponding absolute error of 7E-3 eV/g/photon. Due to data overlapping in Figure 10(d), in some cases only the last plotted data is visible for some organs or tissues, such as skin.
Figure 10.
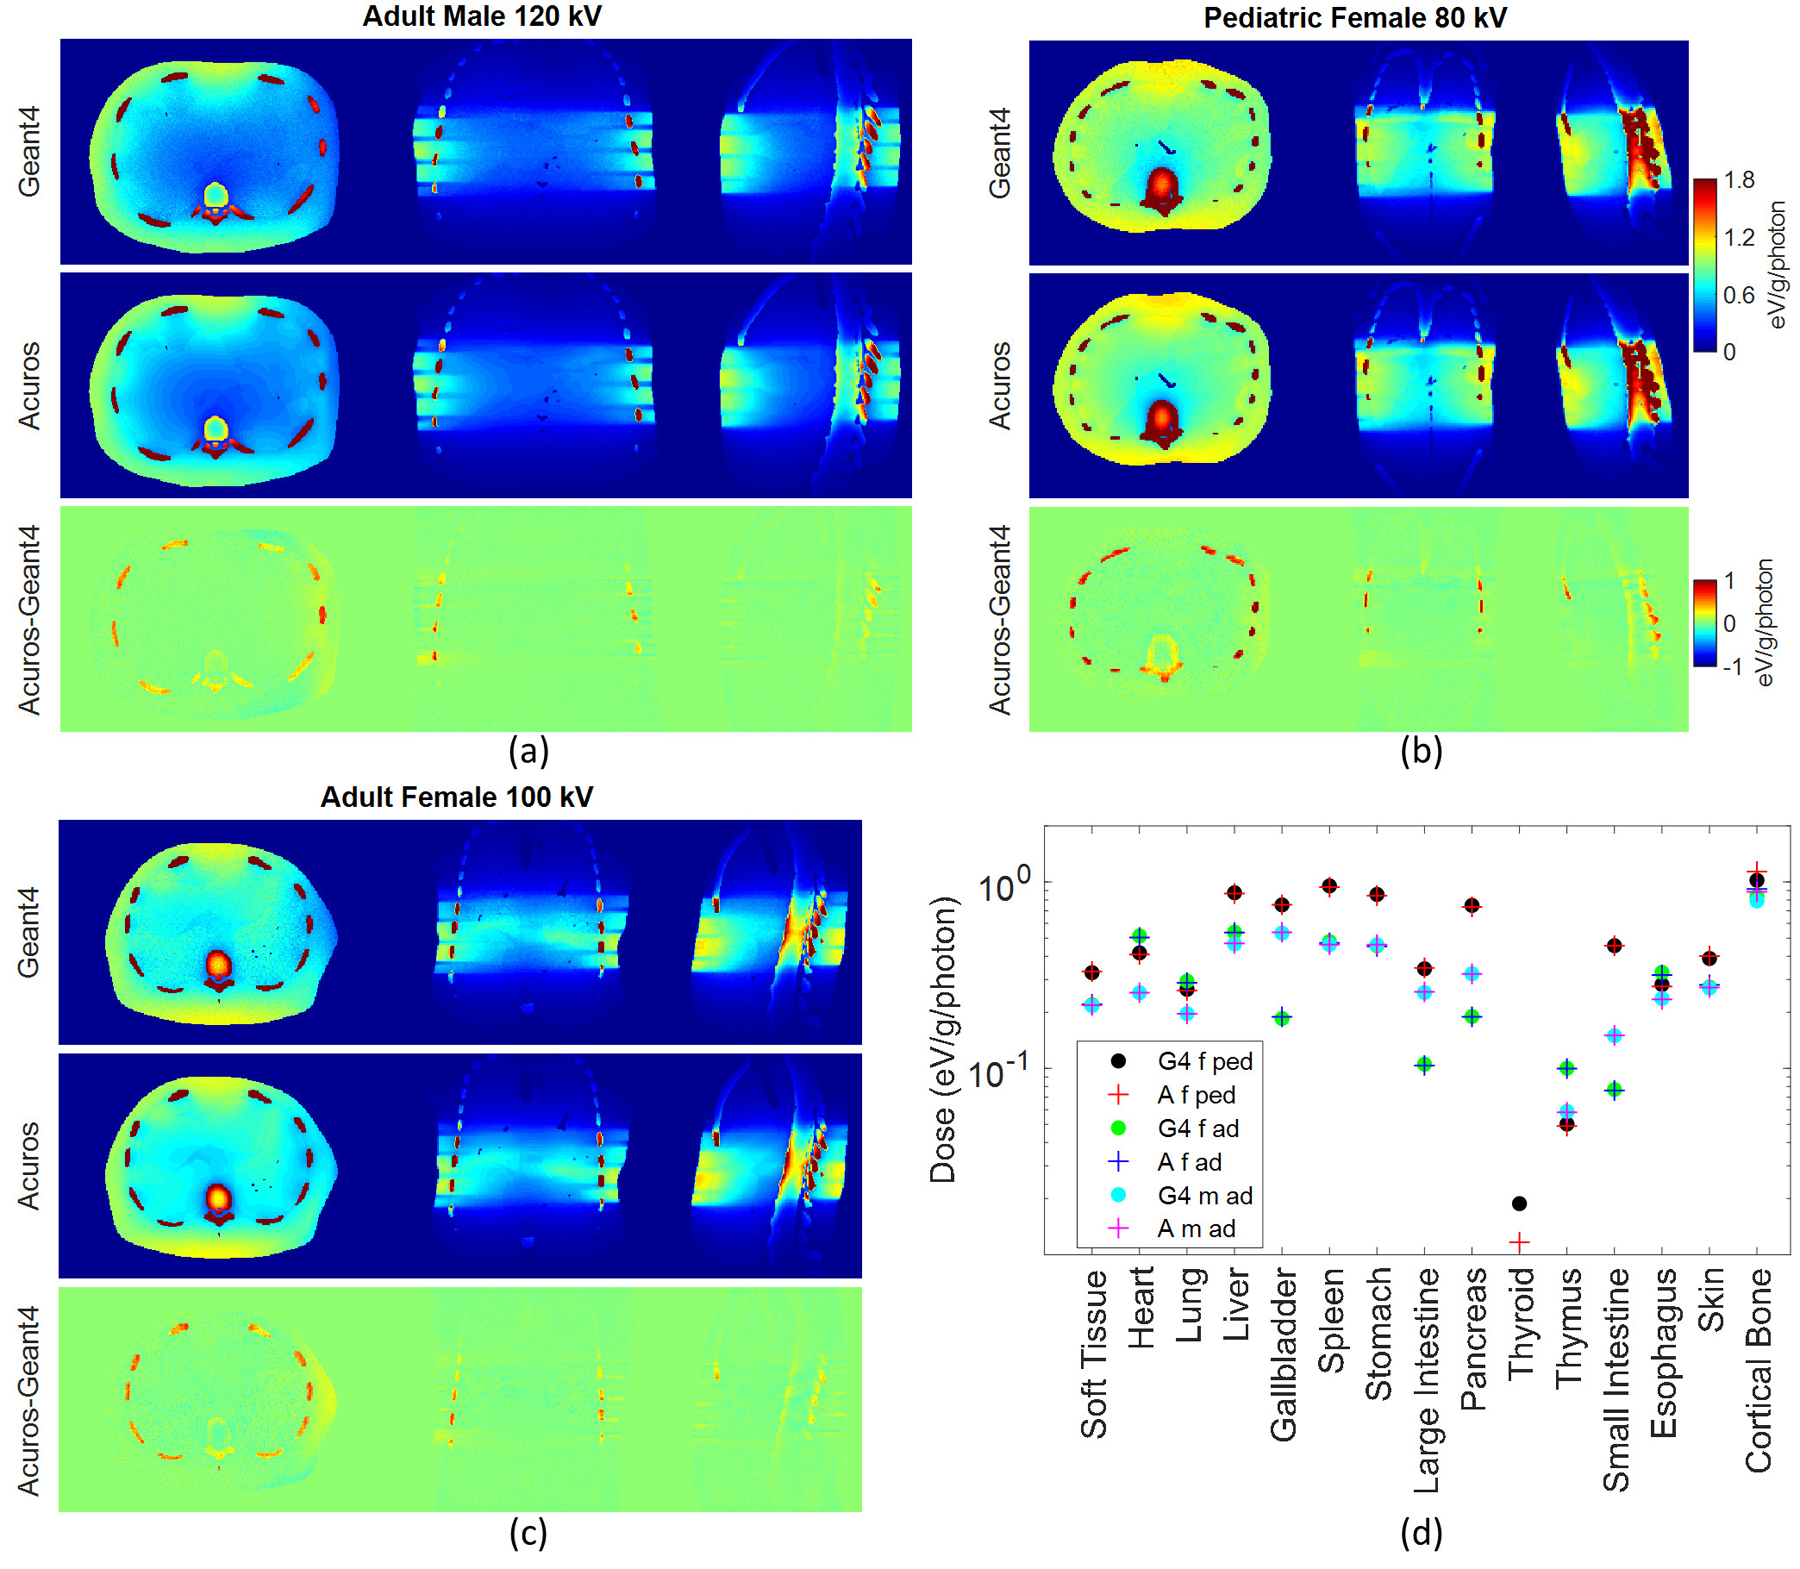
Dose maps in Geant4 and Acuros for (a) the adult male, (b) pediatric female, and (c) adult female, shown with window of [0, 1.8] eV/g/photon. Acuros-Geant4 image shown with window of [−1, 1]. Plot of the dose (d) in the 15 tissues or organs defined in the three XCAT-generated phantoms: female pediatric (f ped), female adult (f ad), male adult (m ad), for 80, 100, and 120 kV respectively, for Geant4 (G4) and Acuros (A).
3.5. Alternative method to calculate mass energy absorption coefficients using MC fitting
The previous results demonstrated highest Acuros error in bone regions, which may be caused by limitations of the mass energy absorption coefficients to account for complex effects, such as scatter and beam hardening. Section 2.4 described a potential improvement to the estimated mass energy absorption coefficients by fitting them to the MC results for the TG 195 phantom. The results of applying the alternative Ki,g mass energy absorption coefficients to the varying anthropomorphic phantoms are presented in Figure 11 and Table 6.
Figure 11.
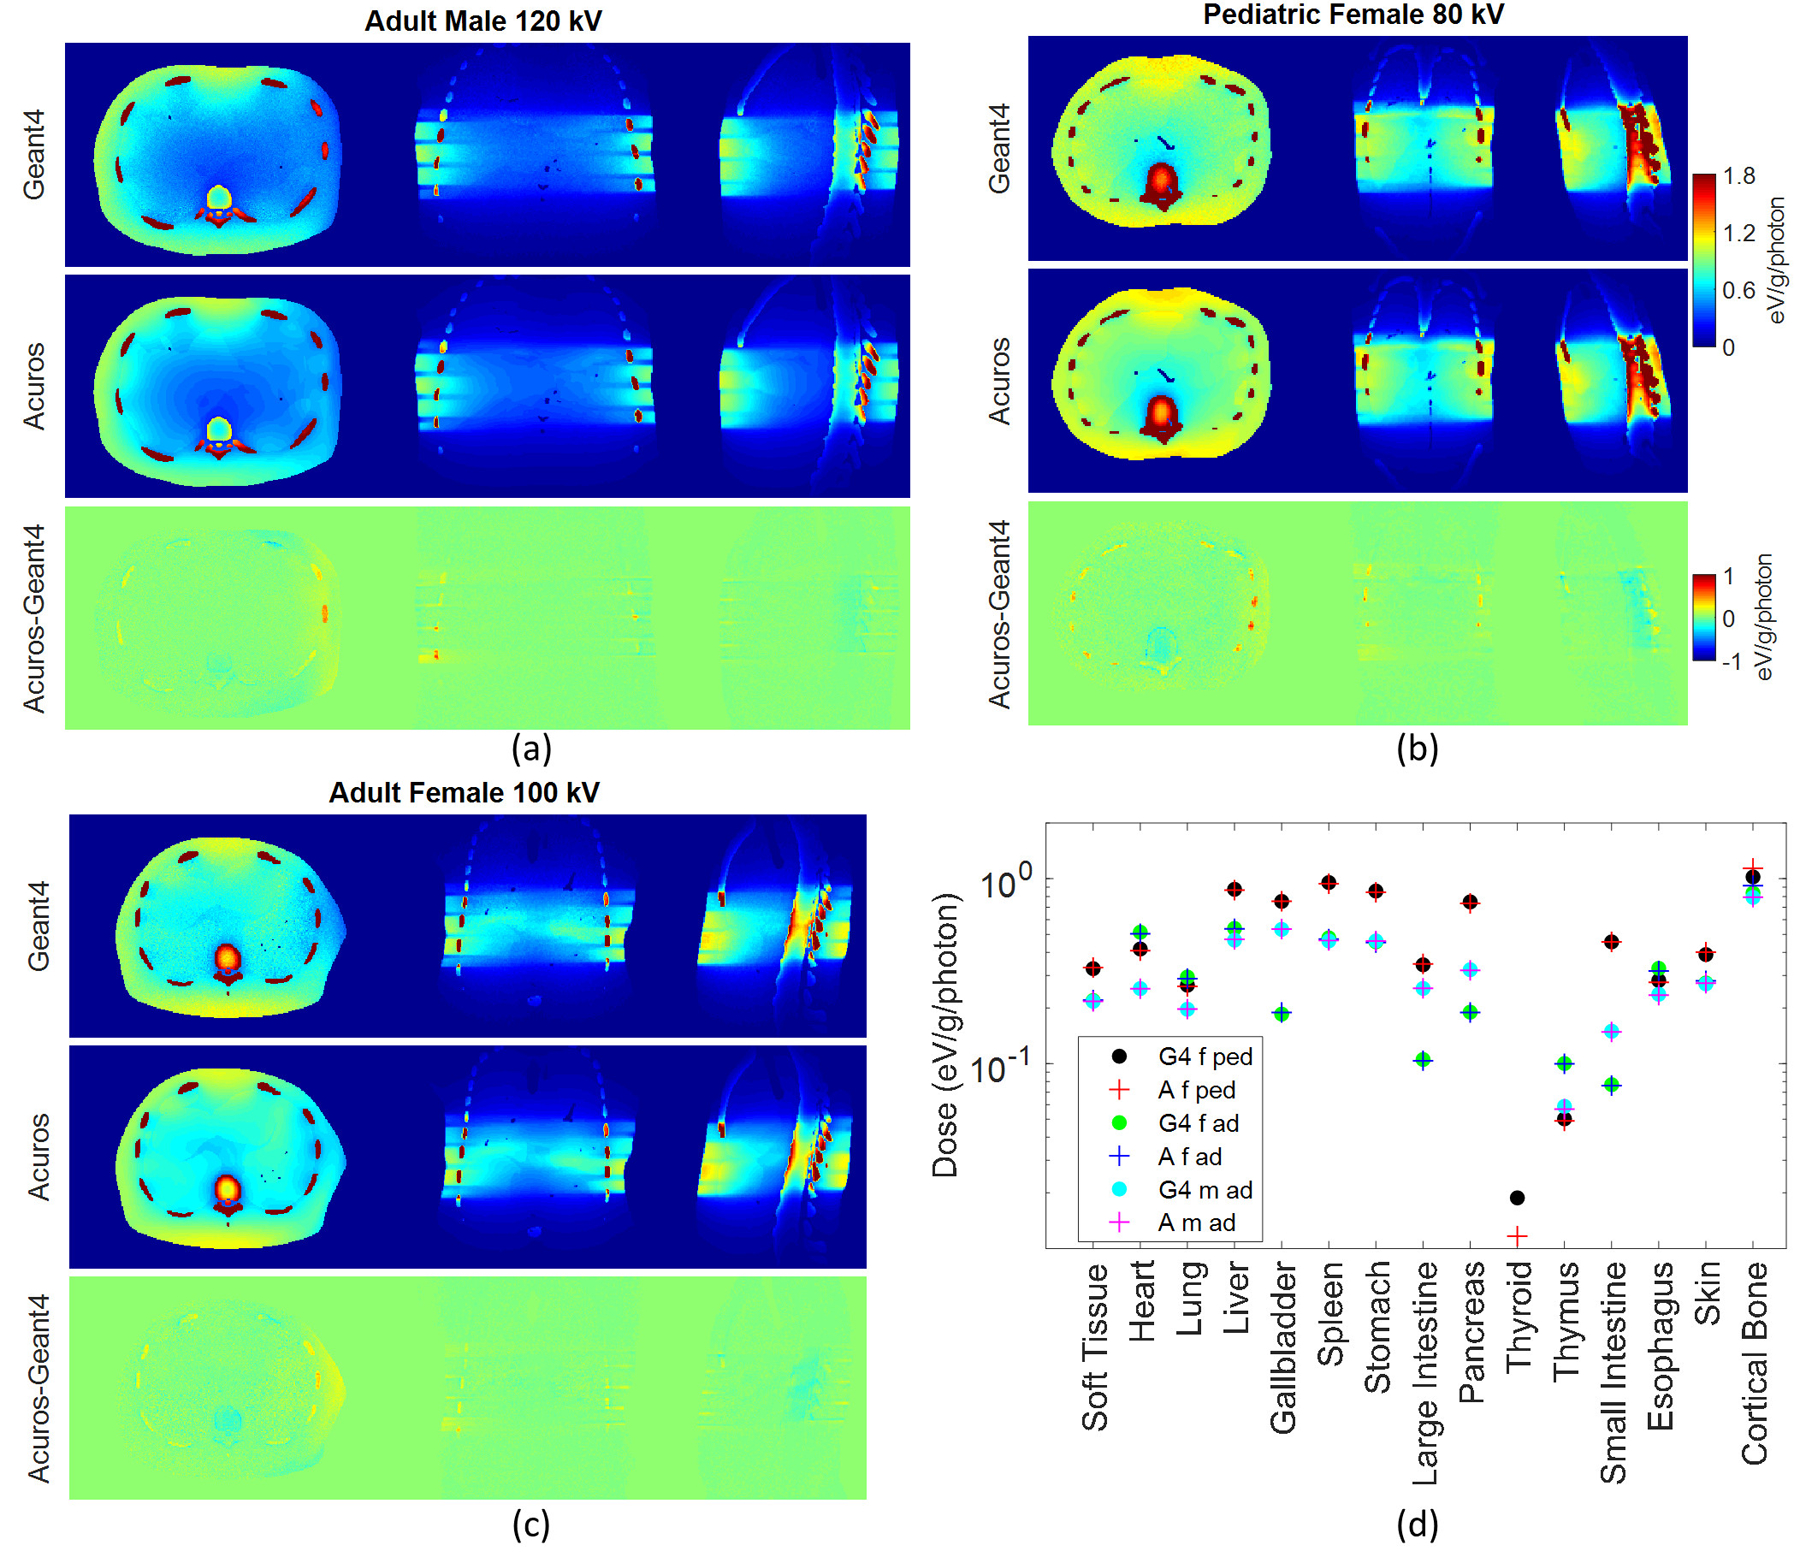
Dose maps in Geant4 and Acuros for (a) the adult male, (b) pediatric female, and (c) adult female, shown with window of [0, 1.8] eV/g/photon, with Acuros dose maps calculated with mass energy absorption coefficients obtained from MC fitting. Acuros-Geant4 image shown with window of [−1, 1]. Plot of the dose (d) in the 15 tissues or organs defined in the three XCAT-generated phantoms: female pediatric (f ped), female adult (f ad), male adult (m ad), for 80, 100, and 120 kV respectively, for Geant4 (G4) and Acuros (A).
Table 6.
RMSE (%) and maximum organ dose error (%) for the XCAT anthropomorphic phantoms when applying the method to calculate mass energy absorption coefficients described in Section 2.1 and Section 2.4.
| Adult Male | Pediatric Female | Adult Female | ||||
|---|---|---|---|---|---|---|
| Method Ki,g | RMSE % | Max Error % (organ) |
RMSE % | Max Error % (organ) |
RMSE % | Max Error % (organ) |
| Section 2.1 | 3.6 | 11.8 (bone) |
3.5 | 11.2 (bone) |
3.4 | 9.6 (bone) |
|
Section 2.4 (MC fitting) |
1.3 | 3.3 (thymus) |
1.5 | 3.7 (skin) |
1.7 | 2.8 (esophagus, skin) |
Figure 11 shows an improvement of the agreement between Acuros and Geant4 especially at the level of the bone region. Table 6 compares the results obtained from the original method to calculate mass energy absorption coefficients described in Section 2.1 against the alternative method described in Section 2.4 that uses MC fitting. For the latter method, results show good agreement between Acuros and Geant4, with RMSE of approximatively 1.5% and maximum organ dose error < 4% for all configurations. The dose error for the bone is < 1% for all cases, whilst, as previously highlighted, for the method described in Section 2.1 the bone entails the highest dose error of ≈10%. As expected, the fitting with MC solutions in the preliminary phase of the calculation of the Ki,g mass energy absorption coefficients increases the agreement between the two codes. Although the fitting procedure may weaken the validity of the method, it is worth observing that the Ki,g calculated by minimizing the residual errors with Monte Carlo are not sensitive to different test phantoms, as they have been computed using the TG 195 phantom but then applied to the XCAT models.
4. DISCUSSION
In this study, we compare Acuros against Monte Carlo while implementing complexities that are representative of modern scanners. Results show a general good agreement between Acuros and Geant4, with RMSE of about 3.5% for all cases except 140 kV (RMSE=5.7%), likely due to the upper limit of 125 keV for the highest energy group currently modeled in Acuros. The dose maps demonstrated the reduced dose at the edges of the phantom due to the bowtie filter and the reduced exposure at the beginning and at the end of the scan due to overrange collimation. Acuros shows an intrinsic dependence of organ dose on voxel size, especially when it comes to small organs that are not in the direct field of radiation but are only exposed because of the scatter. In this case, the thinner the voxel, the better the approximation. However, even though the error for some peripheral organs was high, the absolute error was very small (of the order of 4E-6 of the energy deposited in all body). On the other hand, for the most exposed organs the best agreement was reached when isotropic voxels were modeled. In this case the organ among the most exposed that was most sensitive to the selection of thin or isotropic voxels was the bone, with isotropic voxels providing highest accuracy. Of the most exposed organs, the bone was the tissue for which the highest differences in the dose maps were found, with Acuros overestimating the dose by approximately 10% compared to Geant4. Finally, isotropic voxels of 5×5×5 mm3 and 18 views per rotations appear to be a reasonable option for the TG 195 phantom. In general, the selection of these parameters will depend on the desired run time and the accuracy, but solely the level of the phantom voxelization is subject to memory constraints of the GPU.
In order to investigate an alternative method to improve the accuracy of the software, especially for the bone dose estimation, the Ki,g mass energy absorption coefficients, necessary to compute Acuros dose from the fluence, were calculated by minimizing the residual errors with Monte Carlo. The good agreement reached between Acuros and Geant4 (RMSE≈1.5%) showed that this approach can generalize across different test phantoms (different gender and size). Therefore, once the fitting to calculate the Ki,g mass energy absorption coefficients is performed for one anthropomorphic phantom, the Ki,g can be used across different experiments, without the need of repeating this calculation. This would compensate for the otherwise large error encountered at the level of bone structures. A possible limitation of these Ki,g mass energy absorption coefficients is their applicability on different scanners. The Ki,g account for the peak voltage of the beam and for the bowtie filter, but not for the added filtration to the x-ray tube, which determines the spectral distribution of the beam. However, given that the application of the software is only limited to medical diagnostic x-rays, we believe that these small changes in spectral shape will have a small effect on the estimated mass energy absorption coefficients, such that the estimated coefficients may generalize across scanners. On the other hand, the Ki,g mass energy absorption coefficients calculated in Section 2.1, without performing the MC fitting, are applicable to all sources and phantoms. Further improvements could be made by implementing adaptive mesh refinement, which selectively uses smaller voxels in regions of high dose gradient, such as near soft tissue / bone interfaces19.
A limitation of this study is that the phantoms did not include contrast materials such as iodine or barium. Future work will add contrast materials to the Acuros implementation and to the studied phantoms to investigate the Acuros assumption of local energy deposition of the secondary electrons generated when x-rays are absorbed by the contrast material. A long-term goal of this project is to provide accurate and rapid organ dose estimation using commonly available GPU hardware. The advantage of using Acuros over CPU-Monte Carlo is the low computational time (tens of seconds), with Acuros running on a GeForce GTX 1080 GPU, while Monte Carlo code Geant4 is running on a distributed cluster of CPUs. The simulation time for each projection view of the Geant4 code was of about one hour (no variance reduction techniques have been applied). The total CPU run time depended on the parallelization and no attempts were made to improve code efficiency. However, recent works on accelerated Monte Carlo codes running on GPUs have reported simulation times of down to a few seconds28,29.
Acuros is not subject to statistical fluctuations typical of Monte Carlo simulation, and consequently its dose maps are virtually free from photon noise. Furthermore, in this study, phantoms were already segmented into organs, facilitating the calculation of organ doses from the dose maps. But the ultimate goal of rapid, routine patient-specific CT organ dose estimation requires the development of segmentation algorithms to automatically segment organs from CT images. Additional efforts are underway to create voxelized phantoms from CT patient data and to automatically segment the organs using deep learning approaches29–31. Experimental studies with physical anthropomorphic phantoms composed of tissue-equivalent materials are ongoing to fully validate Acuros and the presented scanner models. At this regard, to compare measured doses with simulated doses, with the latter given in terms of dose per unit photon, a factor is needed to account for the number of photons emitted by the scanner during the procedure. This factor can be obtained from the ratio of the CTDIvol provided by the CT scanner during the CT examination and the CTDIvol estimated by simulating the CTDI phantom, as has been performed for previous Monte Carlo validation studies28.
5. CONCLUSIONS
This work compared Acuros against Monte Carlo code Geant4, showing a generally good agreement between the two methods with organ dose RMSE of about 3.5%, when scanner complexities such as bowtie filter, overrange collimation, and tube current modulation are implemented. A better agreement can be reached by estimating Acuros mass energy absorption coefficients through a fitting with Monte Carlo output, achieving RMSE of approximately 2%. The results demonstrate the ability of Acuros to generate accurate dose maps despite the discretization constraints of the LBTE solver. The main advantage of Acuros over CPU-Monte Carlo is the computational time saving, with average simulation time of approximately 30 seconds.
ACKNOWLEDGMENTS
This work was supported by NIH U01EB023822. The content is solely the responsibility of the authors and does not necessarily represent the official views of the National Institutes of Health. AM, TW, and PJ are or were employees of Varian Medical Systems.
REFERENCES
- 1.Brenner DJ, Elliston CD, Hall EJ, Berdon WE. Estimated Risks of Radiation-. Am Roentgen Ray Soc. 2001;176(February):289–296 [DOI] [PubMed] [Google Scholar]
- 2.Tepper SJ. Computed tomography - An increasing source of radiation exposure: Commentary. Headache. 2008;48(4):657. doi: 10.1111/j.1526-4610.2008.01071.x [DOI] [Google Scholar]
- 3.Einstein AJ, Henzlova MJ, Rajagopalan S. Estimating risk of cancer associated with radiation exposure from 64-slice computed tomography coronary angiography. J Am Med Assoc. 2007;298(3):317–323. doi: 10.1001/jama.298.3.317 [DOI] [PubMed] [Google Scholar]
- 4.McCollough CH, Leng S, Yu L, Cody DD, Boone JM, McNitt-Gray MF. CT dose index and patient dose : They are not the same thing. Radiology. 2011;259(2):311–316. doi: 10.1148/radiol.11101800 [DOI] [PMC free article] [PubMed] [Google Scholar]
- 5.Boone JM, Hendee WR, McNitt-Gray MF, Seltzer SE. Radiation exposure from CT scans: How to close our knowledge gaps, monitor and safeguard exposure - Proceedings and recommendations of the radiation dose summit, sponsored by NIBIB, February 24–25, 2011. Radiology. 2012;265(2):544–554. doi: 10.1148/radiol.12112201 [DOI] [PMC free article] [PubMed] [Google Scholar]
- 6.Seibert JA, Boone JM, Wootton-Gorges SL, Lamba R. Dose is not always what it seems: Where very misleading values can result from volume CT dose index and dose length product. J Am Coll Radiol. 2014;11(3):233–237. doi: 10.1016/j.jacr.2013.10.010 [DOI] [PubMed] [Google Scholar]
- 7.Dixon RL, Boone JM. Dose equations for tube current modulation in CT scanning and the interpretation of the associated CTDIvol. Med Phys. 2013;40(11). doi: 10.1118/1.4824918 [DOI] [PubMed] [Google Scholar]
- 8.Jia X, Xu XG. GPU technology is the hope for near real-time Monte Carlo dose calculations. Med Phys. 2015;42(4):1474–1476. doi: 10.1118/1.4903901 [DOI] [PubMed] [Google Scholar]
- 9.Badal A, Badano A. Accelerating Monte Carlo simulations of photon transport in a voxelized geometry using a massively parallel graphics processing unit. Med Phys. 2009;36(11):4878–4880. doi: 10.1118/1.3231824 [DOI] [PubMed] [Google Scholar]
- 10.Chen W, Kolditz D, Beister M, Bohle R, Kalender WA. Fast on-site Monte Carlo tool for dose calculations in CT applications. Med Phys. 2012;39(6):2985–2996. doi: 10.1118/1.4711748 [DOI] [PubMed] [Google Scholar]
- 11.Montanari D, Scolari E, Silvestri C, et al. Comprehensive evaluations of cone-beam CT dose in image-guided radiation therapy via GPU-based Monte Carlo simulations. Phys Med Biol. 2014;59(5):1239–1253. doi: 10.1088/0031-9155/59/5/1239 [DOI] [PubMed] [Google Scholar]
- 12.Wang A, Maslowski A, Wareing T, Star-Lack J, Schmidt TG. A fast, linear Boltzmann transport equation solver for computed tomography dose calculation (Acuros CTD). Med Phys. 2019;46(2):925–933. doi: 10.1002/mp.13305 [DOI] [PMC free article] [PubMed] [Google Scholar]
- 13.Sechopoulos I, Ali ESM, Badal A, et al. Monte Carlo reference data sets for imaging research: Executive summary of the report of AAPM Research Committee Task Group 195. Med Phys. 2015;42(10). doi: 10.1118/1.4928676 [DOI] [PubMed] [Google Scholar]
- 14.Norris ET, Liu X, Hsieh J. Deterministic absorbed dose estimation in computed tomography using a discrete ordinates method. Med Phys. 2015;42(7):4080–4087. doi: 10.1118/1.4922000 [DOI] [PubMed] [Google Scholar]
- 15.Agostinelli S, Allison J, Amako K, et al. GEANT4 - A simulation toolkit. Nucl Instruments Methods Phys Res Sect A Accel Spectrometers, Detect Assoc Equip. 2003;506(3):250–303. doi: 10.1016/S0168-9002(03)01368-8 [DOI] [Google Scholar]
- 16.Perkins ST, Cullen DE, Seltzer SM, Laboratory LLN. Tables and graphs of electron-interaction cross sections from 10 eV to 100 GeV derived from the LLNL Evaluated Electron Data Library (EEDL), Z = 1--100. Uclr--50400. 1991;Vol. 31:Medium: ED; Size: Pages: (500 p). doi: 10.2172/5691165 [DOI] [Google Scholar]
- 17.Plechaty E, Cullen D, Howerton R. Tables and graphs of photon interaction cross sections from 1.0 keV to 100 MeV derived from the LLL evaluated nuclear data library. Ucrl-50400. 1975;6 http://www.osti.gov/energycitations/product.biblio.jsp?osti_id=4033019 [Google Scholar]
- 18.Vassiliev ON, Wareing TA, McGhee J, Failla G, Salehpour MR, Mourtada F. Validation of a new grid-based Boltzmann equation solver for dose calculation in radiotherapy with photon beams. Phys Med Biol. 2010;55(3):581–598. doi: 10.1088/0031-9155/55/3/002 [DOI] [PubMed] [Google Scholar]
- 19.Bush K, Gagne IM, Zavgorodni S, Ansbacher W, Beckham W. Dosimetric validation of Acuros® XB with Monte Carlo methods for photon dose calculations. Med Phys. 2011;38(4):2208–2221. doi: 10.1118/1.3567146 [DOI] [PubMed] [Google Scholar]
- 20.Maslowski A, Wang A, Sun M, Wareing T, Davis I, Star-Lack J. Acuros CTS: A fast, linear Boltzmann transport equation solver for computed tomography scatter – Part I: Core algorithms and validation. Med Phys. 2018;45(5):1899–1913. doi: 10.1002/mp.12850 [DOI] [PMC free article] [PubMed] [Google Scholar]
- 21.Wang A, Maslowski A, Messmer P, et al. Acuros CTS: A fast, linear Boltzmann transport equation solver for computed tomography scatter – Part II: System modeling, scatter correction, and optimization. Med Phys. 2018;45(5):1914–1925. doi: 10.1002/mp.12849 [DOI] [PubMed] [Google Scholar]
- 22.Lewis EE, Miller WF. Computational Methods of Neutron Transport. New York, NY: John Wiley and Sons Inc.; 1984 [Google Scholar]
- 23.Lathrop KCB. Numerical solution of the Boltzmann transport equation. J Comput Phys. 1966;1:173–197 [Google Scholar]
- 24.Hubbell JH and Seltzer SM. Tables of X-Ray Mass Attenuation Coefficients and Mass Energy-Absorption Coefficients (version 1.4). 2004 [Google Scholar]
- 25.Yang K, Li Z, Li X, Liu B. Characterization of dynamic collimation mechanisms for helical CT scans with direct measurements. Phys Med Biol. 2019;64(21). doi: 10.1088/1361-6560/ab3eaa [DOI] [PubMed] [Google Scholar]
- 26.Gandhi D, Crotty DJ, Stevens GM, Schmidt TG. Technical Note: Phantom study to evaluate the dose and image quality effects of a computed tomography organ-based tube current modulation technique. Med Phys. 2015;42(11):6572–6578. doi: 10.1118/1.4933197 [DOI] [PubMed] [Google Scholar]
- 27.Segars WP, Sturgeon G, Mendonca S, Grimes J, Tsui BMW. 4D XCAT phantom for multimodality imaging research. Med Phys. 2010;37(9):4902–4915. doi: 10.1118/1.3480985 [DOI] [PMC free article] [PubMed] [Google Scholar]
- 28.Sharma S, Kapadia A, Fu W, Abadi E, Segars WP, Samei E. A real-time Monte Carlo tool for individualized dose estimations in clinical CT. Phys Med Biol. 2019;64(21). doi: 10.1088/1361-6560/ab467f [DOI] [PMC free article] [PubMed] [Google Scholar]
- 29.Peng Z, Fang X, Yan P, et al. A Method of Rapid Quantification of Patient-Specific Organ Doses for CT Using Deep-Learning based Multi-Organ Segmentation and GPU-accelerated Monte Carlo Dose Computing. Med Phys. 2020. doi: 10.1002/mp.14131 [DOI] [PubMed] [Google Scholar]
- 30.Offe M, Fraley D, Adamson P, Principi S, Wang A, Jordan P, Schmidt TG. Evaluation of deep learning segmentation for rapid, patient-specific CT organ dose estimation using an LBTE solver. Proc Vol 11312, Med Imaging 2020, Phys Med Imaging; 113124O 10.1117/122550314 [DOI] [Google Scholar]
- 31.Schmidt TG, Wang A, Coradi T, Haas B, Star-Lack J. Accuracy of patient-specific organ dose estimates obtained using an automated image segmentation algorithm. J Med Imaging, 3(4), 043502 (2016) 10.1117/1JMI34043502 [DOI] [PMC free article] [PubMed] [Google Scholar]


