Abstract
Gliomas are an intractable tumor in the central nervous system. The present study aimed to identify the differentially expressed genes (DEGs) between glioblastoma multiforme (GBM) and low-grade gliomas (LGG) in order to investigate the mechanisms of different grades of gliomas. The Cancer Genome Atlas (TCGA) database was used to identify DEGs between GBM and LGG, and 2641 genes have been found differentially expressed. Gene Ontology (GO) and Kyoto Encyclopedia of Genes and Genomes (KEGG) analyses were used to determine the related functions and pathways of DEGs. Protein–protein interaction (PPI) network extracted a total of 444 nodes and 1953 interactions, and identified the top 6 hub genes in gliomas. The microarray data of the datasets GSE52009 and GSE4412, which were obtained from Gene Expression Omnibus (GEO) database, were used to externally validate DEGs expression levels. Gene Expression Profiling Interactive Analysis (GEPIA) database which was based on TCGA was used to explore the survival of hub genes in LGG and GBM. Additionally, the Oncomine database and Chinese Glioma Genome Atlas (CGGA) database were used to validate the mRNA expression level and prognostic value of hub genes. Gene Set Enrichment Analysis (GSEA) identified further hub genes-related pathways. In summary, through biological information and survival analysis, 6 hub genes may be new biomarkers for diagnosis and for guiding the choice of treatment strategies for different grades of gliomas.
Keywords: bioinformatics analysis, differentially expressed genes, glioblastoma, survival analysis
1. Introduction
Gliomas are the most common primary tumor of the central nervous system.[1] According to the histopathological characteristics, gliomas can be divided into 4 grades from low to high malignant degree.[2] Low-grade gliomas (LGG) (astrocytomas, oligodendrogliomas, and oligoastrocytomas) are well-differentiated and have a 5-year survival rate of nearly 60%.[3] Despite many treatment strategies, glioblastoma multiforme (GBM) is one of the most lethal brain tumors with a median overall survival (OS) of 14.6 months.[4] Unfortunately, most LGG will progress to GBM within 5 to 10 years. In this process, the expression of many genes and molecular pathways change.[5] So far, O-6-methylguanine-DNA methyltransferase (MGMT) promoter methylation, EGFR alterations and isocitrate dehydrogenase 1 (IDH1) and isocitrate dehydrogenase 2 (IDH2) mutations have been identified as markers in molecular classification of glioblastomas.[6,7] Therefore, it is significant to explore new genes and molecular markers for the treatment of different grades of gliomas.
Gene expression profiling analyses have greatly promoted clinical oncology research, mainly in the following aspects: searching for tumor related genes, exploring molecular diagnosis, comparing therapeutic effects and predicting prognosis and recurrence of tumors.[8–10] In recent years, the application of microarray and high-throughput sequencing technology have enlarged gene expression profiling analysis to an unprecedented scale. At the same time, multiple databases and methods are used to study and verify the differentially expressed genes (DEGs), which makes bioinformatics analysis more accurate and reliable.[11,12] In addition, through the comparative analysis of DEGs, especially the study of signaling pathways and interaction networks, we can explore the occurrence, development and transformation mechanisms of malignant tumors.[13]
In this study, TCGA database was used to identify the DEGs between GBM and LGG.
Gene Ontology (GO) and Kyoto Encyclopedia of Genes and Genomes (KEGG) analyses were used to determine the related functions and pathways of DEGs. Protein–protein interaction (PPI) network extracted important nodes and interactions in gliomas, and identified top 6 hub genes. Subsequently, 2 clinical microarray data (GSE52009 and GSE4412) were obtained from Gene Expression Omnibus (GEO) database. The clinical value of the hub genes was further explored and verified by Gene Expression Profiling Interactive Analysis (GEPIA) and Gene Set Enrichment Analysis (GSEA) based on TCGA database.[14–16] In order to further improve the reliability of this study, Oncomine database and Chinese Glioma Genome Atlas (CGGA) database were introduced for external validation of the mRNA expression level and prognostic value of hub genes.[17,18]
2. Material and methods
2.1. Datasets and identification of DEGs
The mRNA expression profiles and clinical data of LGG and GBM patients were obtained from the TCGA data portal (https://portal.gdc.cancer.gov/repository), which grades II and III of gliomas were included in the TCGA-LGG project, whereas grade IV was separated in TCGA-GBM project. Moreover, the datasets from the National Center of Biotechnology Information (NCBI) GEO database (http://www.ncbi.nlm.nih.gov/geo/) was divided into LGG and GBM according to the TCGA standard. The gene expression level and clinical data from TCGA were used for identification of DEGs, and Gene expression profile of GSE52009 and GSE4412 from GEO was used to externally validate the hub gene expression level. The GSE52009, which was based on GPL6480 Agilent-014850 Whole Human Genome Microarray was uploaded by Jiang et al, contained 92 LGG samples and 24 GBM samples. The GSE4412, which was based on GPL96 Affymetrix Human Genome U133A Array was uploaded by Nelson SF, included 26 LGG samples and 59 GBM samples.[19] To clarify the DEGs between LGG and GBM, the fold change (FC) >2 (|log2FC| ≥1) and false discovery rate (FDR) < 0.05 were used as the threshold to identify DEGs. Heat map and volcano plot were generated using the R software package pheatmap and ggplot2, respectively.
2.2. Functional and pathway enrichment analysis
GO analysis was used to determine the functions including biological pathways (BP), cellular component (CC), and molecular function (MF).[20] KEGG pathway enrichment analysis was used to systematically describe relevant pathways for the genes.[21] The clusterProfiler package was used to perform GO analysis and KEGG pathway enrichment analysis. False discovery rate (FDR) of <0.05 was used as the cut-off value.
2.3. PPI network analysis
The online Search Tool the Retrieval of Interacting Genes (STRING) database (http://www.string-db.org) was used to demonstrate the interaction between various proteins,[22] and Cytoscape software (Version 3.7.2, http://www.cytoscape.org/) was used to reconstruct a PPI network. The mapped network was detected the possible relationship among DEGs. Due to the large number of DEGs while FC >2, we identified PPI network using FC>4. The cut-off criterion of interaction confidence score was set as >0.4. The important nodes and hub genes in the network were predicted and explored by CytoHubba, a plugin of Cytoscape, and the top 10 genes were selected from the results of each method. The final top 6 hub genes in different methods were selected for further analysis.
2.4. Oncomine database analysis
The expression level of hub genes was identified in the Oncomine database (https://www.oncomine.org), and analyzed the mRNA expression differences between LGG and GBM.[17] The threshold was determined according to the following values: P value of .05, fold change of 2.0.
2.5. GEPIA database analysis
GEPIA database was used to perform survival analysis which is based on TCGA database (http://gepia.cancer-pku.cn/).[15] Survival analyses were carried out to achieve Kaplan–Meier plots. The log-rank test was performed during Kaplan–Meier survival analysis. The two-tailed P value was used in this study, and a P value of less than .05 considered statistically significant.
2.6. CGGA database analysis
Chinese Glioma Genome Atlas (CGGA) data (http://www.cgga.org.cn/), a Chinese glioma database which included over 2000 samples from the Chinese cohort, was used for external validation the mRNA expression level and prognostic value of hub genes.[23] The results were downloaded from the CGGA website.
2.7. GSEA analysis
GSEA was conducted to further identify hub genes-related pathways. GSEA version 4.0.3 software (http://www.broadinstitute.org/gsea) was used to analyze data. The expression level of hub genes was used as the phenotype annotation, and patients in TCGA cohort were divided into low and high categories. The Molecular Signatures Database (MSigDB) of c2 (c2.cp.kegg.v7.1.symbols.gmt) was used to assess the functional differences between the low and high hub gene expression groups.[24] The number of permutations was set to 1000 and the phenotype labels were high and low expression. FDR <0.25 and P < .05 were set as the cut-off criteria to confirm significant gene sets.
3. Results
3.1. Identification of DEGs between LGG and GBM
Gene expression profiles from the TCGA database were conducted to analyze DEGs. A total of 529 LGG and 169 GBM samples was involved in our further analysis. Differentially expressed genes between GBM and LGG were identified as explained in the methods. The results revealed that a total of 2641 genes were identified to be differentially expressed, including 1428 up-regulated genes and 1213 down-regulated genes (Fig. 1A,B).
Figure 1.
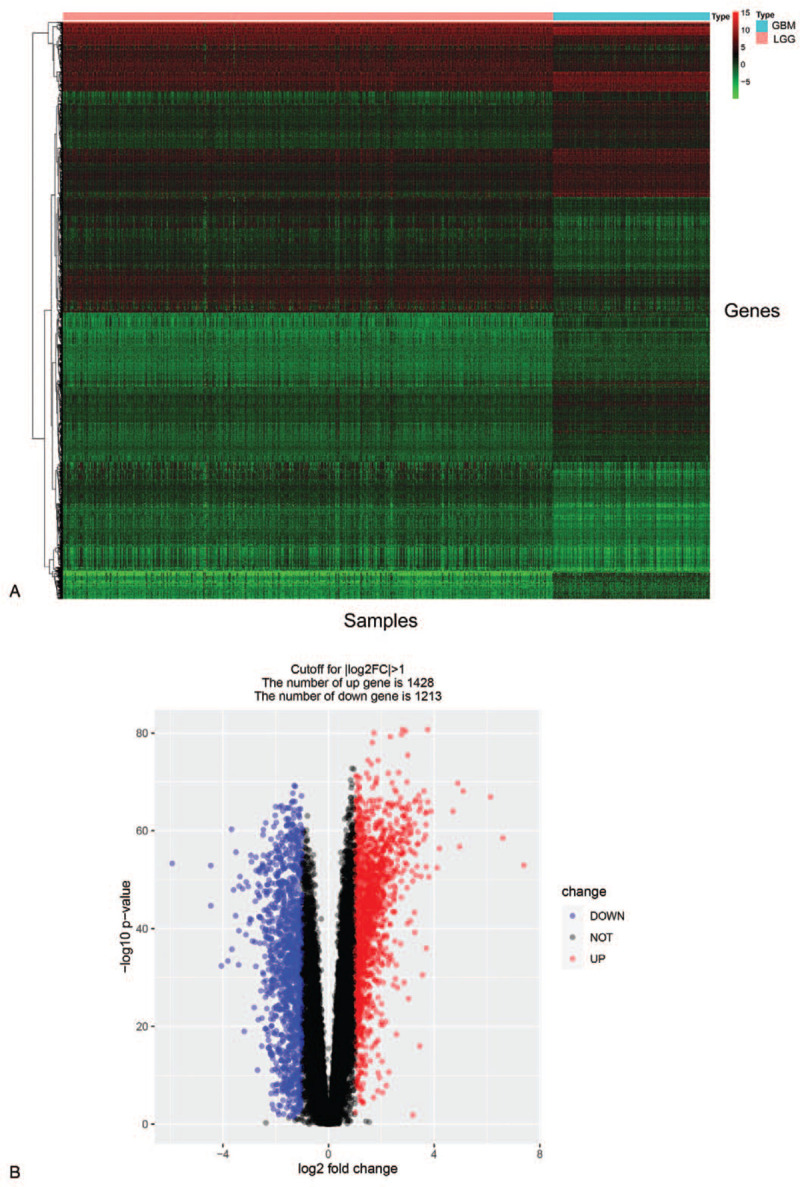
Identification of expression differences between LGG and GBM. (A) Heat-map overview of the differentially expressed genes. (B) Volcano plot of the differential mRNA expression analysis.
3.2. Functional and pathway enrichment analysis of DEGs
Total, up-regulated and down-regulated DEGs were used for GO and KEGG analysis, respectively. GO analysis showed genes associated with BP were mainly involved in regulation of trans-synaptic signaling in total DEGs, extracellular structure organization in up-regulated DEGs, modulation of chemical synaptic transmission in down-regulated DEGs. Genes associated with CC were mainly involved in synaptic membrane in total DEGs, collagen-containing extracellular matrix in up-regulated DEGs, and synaptic membrane in down-regulated DEGs. And genes associated with MF were mainly involved in channel activity in total DEGs, extracellular matrix structural constituent in up-regulated DEGs, channel activity in down-regulated DEGs (Fig. 2A, C, E). The detailed results were presented in Table 1.
Figure 2.
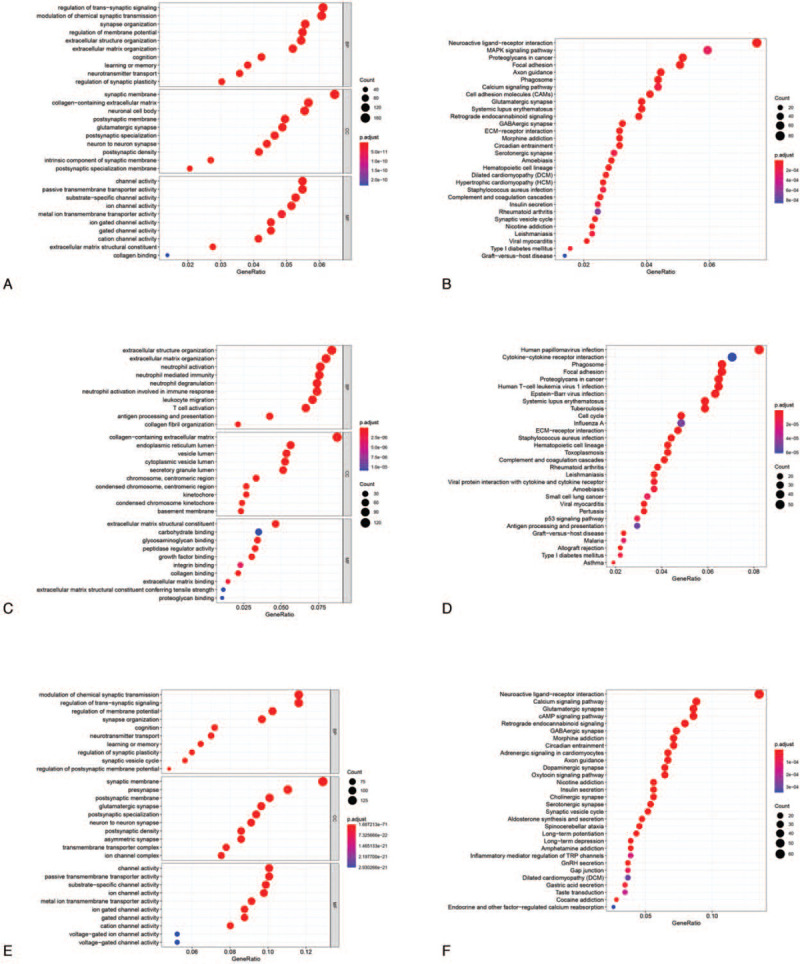
Functional enrichment analyses of (A) total, (C) up-regulated and (E) down-regulated DEGs (GBM vs LGG). Top 10 biological process, cellular component, and molecular function terms for the DEGs., DEGs. KEGG pathways enriched for the (B) total, (D) up-regulated and (F) down-regulated DEGs (GBM vs LGG).
Table 1.
Gene Ontology functional enrichment analyses of DEGs associated with LGG and GBM.
| Category | Description | Count | % | P value | |
| Total DEGs | |||||
| BP | GO:0099177 | Regulation of trans-synaptic signaling | 147 | 6.11 | 4.98E-26 |
| BP | GO:0050804 | Modulation of chemical synaptic transmission | 146 | 6.07 | 6.77E-26 |
| BP | GO:0050808 | Synapse organization | 134 | 5.57 | 8.23E-23 |
| BP | GO:0042391 | Regulation of membrane potential | 132 | 5.48 | 2.76E-19 |
| BP | GO:0043062 | Extracellular structure organization | 131 | 5.44 | 6.19E-20 |
| CC | GO:0097060 | Synaptic membrane | 163 | 6.46 | 1.50E-37 |
| CC | GO:0062023 | Collagen-containing extracellular matrix | 143 | 5.67 | 2.25E-29 |
| CC | GO:0043025 | Neuronal cell body | 140 | 5.55 | 1.53E-18 |
| CC | GO:0045211 | Postsynaptic membrane | 125 | 4.95 | 6.90E-30 |
| CC | GO:0098978 | Glutamatergic synapse | 123 | 4.88 | 3.15E-25 |
| MF | GO:0015267 | Channel activity | 131 | 5.49 | 9.84E-16 |
| MF | GO:0022803 | Passive transmembrane transporter activity | 131 | 5.49 | 1.00E-15 |
| MF | GO:0022838 | Substrate-specific channel activity | 126 | 5.28 | 9.84E-16 |
| MF | GO:0005216 | Ion channel activity | 123 | 5.15 | 9.84E-16 |
| MF | GO:0046873 | Metal ion transmembrane transporter activity | 116 | 4.86 | 2.48E-11 |
| Up regulated DEGs | |||||
| BP | GO:0043062 | Extracellular structure organization | 111 | 8.38 | 1.23E-31 |
| BP | GO:0030198 | Extracellular matrix organization | 106 | 8.01 | 1.25E-33 |
| BP | GO:0042119 | Neutrophil activation | 101 | 7.63 | 3.85E-19 |
| BP | GO:0002446 | Neutrophil mediated immunity | 100 | 7.55 | 1.19E-18 |
| BP | GO:0043312 | Neutrophil degranulation | 98 | 7.40 | 1.33E-18 |
| CC | GO:0062023 | Collagen-containing extracellular matrix | 121 | 8.75 | 6.04E-42 |
| CC | GO:0005788 | Endoplasmic reticulum lumen | 78 | 5.64 | 1.86E-21 |
| CC | GO:0031983 | Vesicle lumen | 74 | 5.35 | 1.63E-16 |
| CC | GO:0060205 | Cytoplasmic vesicle lumen | 73 | 5.28 | 3.16E-16 |
| CC | GO:0034774 | Secretory granule lumen | 71 | 5.13 | 2.94E-16 |
| MF | GO:0005201 | Extracellular matrix structural constituent | 61 | 4.64 | 8.74E-25 |
| MF | GO:0030246 | Carbohydrate binding | 46 | 3.50 | 1.09E-05 |
| MF | GO:0005539 | Glycosaminoglycan binding | 45 | 3.42 | 3.37E-07 |
| MF | GO:0061134 | Peptidase regulator activity | 43 | 3.27 | 6.38E-07 |
| MF | GO:0019838 | Growth factor binding | 40 | 3.04 | 6.69E-12 |
| Down regulated DEGs | |||||
| BP | GO:0050804 | Modulation of chemical synaptic transmission | 126 | 11.62 | 9.72E-51 |
| BP | GO:0099177 | Regulation of trans-synaptic signaling | 126 | 11.62 | 9.72E-51 |
| BP | GO:0042391 | Regulation of membrane potential | 111 | 10.24 | 7.42E-39 |
| BP | GO:0050808 | Synapse organization | 105 | 9.69 | 5.55E-37 |
| BP | GO:0050890 | Cognition | 78 | 7.20 | 7.79E-28 |
| CC | GO:0097060 | Synaptic membrane | 147 | 12.88 | 1.69E-71 |
| CC | GO:0098793 | Presynapse | 126 | 11.04 | 5.85E-46 |
| CC | GO:0045211 | Postsynaptic membrane | 115 | 10.08 | 6.77E-58 |
| CC | GO:0098978 | Glutamatergic synapse | 110 | 9.64 | 2.65E-49 |
| CC | GO:0099572 | Postsynaptic specialization | 107 | 9.38 | 7.56E-47 |
| MF | GO:0015267 | Channel activity | 108 | 10.06 | 1.05E-33 |
| MF | GO:0022803 | Passive transmembrane transporter activity | 108 | 10.06 | 1.08E-33 |
| MF | GO:0022838 | Substrate-specific channel activity | 106 | 9.88 | 1.09E-34 |
| MF | GO:0005216 | Ion channel activity | 105 | 9.79 | 5.81E-35 |
| MF | GO:0046873 | Metal ion transmembrane transporter activity | 98 | 9.13 | 1.81E-28 |
KEGG pathway enrichment analysis was conducted to further investigate the pathways among these DEGs. As shown in Figure 2B, D, F, the significantly enriched key pathways were neuroactive ligand-receptor interaction, cytokine-cytokine receptor interaction and neuroactive ligand-receptor interaction in total, up-regulated and down-regulated DEGs, respectively. The detailed results were presented in Table 2.
Table 2.
Top 10 most KEGG of total, up regulated and down regulated DEGs.
| Description | Count | % | P value | |
| Total DEGs | ||||
| hsa04080 | Neuroactive ligand-receptor interaction | 86 | 7.51 | 8.47E-07 |
| hsa04010 | MAPK signaling pathway | 68 | 5.94 | 0.000258 |
| hsa05205 | Proteoglycans in cancer | 59 | 5.15 | 8.47E-07 |
| hsa04510 | Focal adhesion | 58 | 5.07 | 8.47E-07 |
| hsa04360 | Axon guidance | 51 | 4.45 | 1.64E-05 |
| hsa04145 | Phagosome | 50 | 4.37 | 1.85E-07 |
| hsa04020 | Calcium signaling pathway | 50 | 4.37 | .000157 |
| hsa04514 | Cell adhesion molecules (CAMs) | 47 | 4.10 | 8.47E-07 |
| hsa04724 | Glutamatergic synapse | 44 | 3.84 | 1.49E-08 |
| hsa05322 | Systemic lupus erythematosus | 44 | 3.84 | 8.47E-07 |
| Up regulated DEGs | ||||
| hsa05165 | Human papillomavirus infection | 32 | 8.24 | 3.63E-11 |
| hsa04060 | Cytokine-cytokine receptor interaction | 30 | 7.06 | 7.45E-09 |
| hsa04145 | Phagosome | 28 | 6.62 | 7.45E-09 |
| hsa04510 | Focal adhesion | 45 | 6.62 | 2.81E-08 |
| hsa05205 | Proteoglycans in cancer | 22 | 6.47 | 5.05E-08 |
| hsa05166 | Human T-cell leukemia virus 1 infection | 29 | 6.47 | 5.05E-08 |
| hsa05169 | Epstein-Barr virus infection | 33 | 6.32 | 5.11E-08 |
| hsa05322 | Systemic lupus erythematosus | 25 | 5.88 | 5.24E-08 |
| hsa05152 | Tuberculosis | 44 | 5.88 | 1.16E-07 |
| hsa04110 | Cell cycle | 43 | 4.85 | 2.06E-07 |
| Down regulated DEGs | ||||
| hsa04080 | Neuroactive ligand-receptor interaction | 33 | 13.55 | 9.99E-17 |
| hsa04020 | Calcium signaling pathway | 41 | 8.82 | 5.36E-12 |
| hsa04724 | Glutamatergic synapse | 26 | 8.60 | 2.97E-11 |
| hsa04024 | cAMP signaling pathway | 24 | 8.60 | 1.33E-10 |
| hsa04723 | Retrograde endocannabinoid signaling | 40 | 7.96 | 7.85E-10 |
| hsa04727 | GABAergic synapse | 30 | 7.31 | 1.25E-09 |
| hsa05032 | Morphine addiction | 31 | 7.10 | 5.96E-09 |
| hsa04713 | Circadian entrainment | 20 | 7.10 | 1.09E-08 |
| hsa04261 | Adrenergic signaling in cardiomyocytes | 30 | 6.67 | 4.99E-08 |
| hsa04360 | Axon guidance | 18 | 6.67 | 6.05E-08 |
3.3. Hub genes screening from PPI network
Protein interaction analysis could clarify the important protein and biological modules. PPI network construction was conducted using STRING tool and Cytoscape software. A total of 444 nodes and 1953 interactions were screened from the PPI network (Fig. 3A). CytoHubba contained several algorithms (Table 3), and the top 10 hub genes using MCC, DEGREE, and EPC algorithm were shown in Figure 3B–D. We chose the top 6 hub nodes as hub genes for further analysis, including TIMP metallopeptidase inhibitor 1 (TIMP1), fibronectin 1 (FN1), collagen type I alpha 1 chain (COL1A1), periostin (POSTN), matrix metallopeptidase 9 (MMP9), C-X-C motif chemokine ligand 8 (CXCL8).
Figure 3.
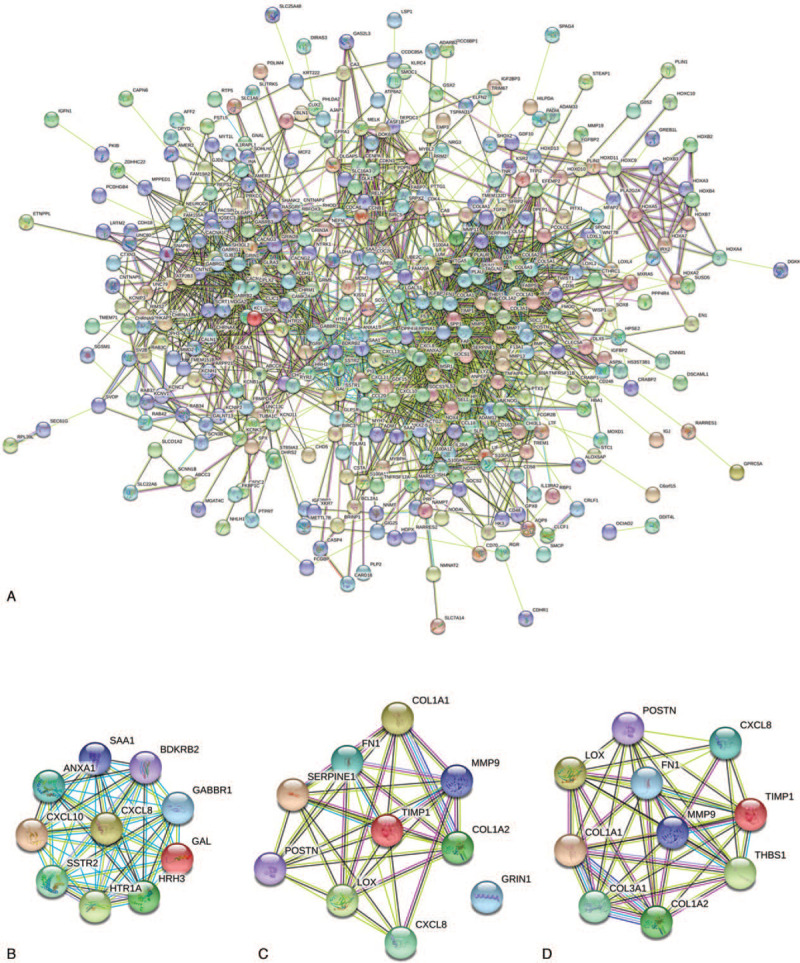
PPI network analysis and hub genes identification. (A) Protein-protein interaction networks of the DEGs. The hub genes depended on (B) MMC, (C) DEGREE and (D) EPC algorithms.
Table 3.
Hub genes for DEGs ranked in cytoHubba using different methods.
| Rank methods in cytoHubba | ||||||||||
| Catalog | MCC | MNC | Degree | EPC | BottleNeck | EcCentricity | Closeness | Radiality | Betweenness | Stress |
| Hub gene top 10 | CXCL8 | FN1 | FN1 | FN1 | CXCL8 | CXCL8 | CXCL8 | CXCL8 | CXCL8 | CXCL8 |
| GABBR1 | CXCL8 | CXCL8 | MMP9 | FN1 | FN1 | FN1 | FN1 | FN1 | FN1 | |
| HTR1A | MMP9 | MMP9 | CXCL8 | MMP9 | MMP9 | MMP9 | MMP9 | MMP9 | MMP9 | |
| ANXA1 | TIMP1 | TIMP1 | COL1A2 | GRM5 | GRM5 | TIMP1 | TIMP1 | GRM5 | GRM5 | |
| SAA1 | COL1A1 | GRIN1 | TIMP1 | POSTN | POSTN | COL1A1 | GRM5 | GRIN1 | GRIN1 | |
| BDKRB2 | COL1A2 | COL1A1 | COL1A1 | TIMP1 | TIMP1 | GRM5 | ANXA1 | LOX | GABBR1 | |
| HRH3 | GRIN1 | COL1A2 | POSTN | KCNJ9 | MDM2 | LOX | CXCL10 | KCNJ9 | KCNJ9 | |
| CXCL10 | POSTN | POSTN | COL3A1 | MDM2 | NTRK1 | POSTN | LOX | TIMP1 | LOX | |
| GAL | SERPINE1 | LOX | LOX | LOX | GRIN1 | SERPINE1 | SERPINE1 | MDM2 | HTR1A | |
| SSTR2 | SPP1 | SERPINE1 | THBS1 | NTRK1 | SNAI2 | SPP1 | SPP1 | SDC1 | HRH3 | |
3.4. Gene expression level in TCGA and GEO databases
To demonstrate the mRNA expression level in LGG and GBM, we first visualized the expression level in TCGA. As shown in Figure 4A, hub genes were significantly higher in GBM. We further analyzed 6 hub genes using GSE52009 and GSE4412 datasets. Similarly, hub gene mRNA expression levels were higher in GBM tissues, compared to LGG tissues (Fig. 4B,C).
Figure 4.
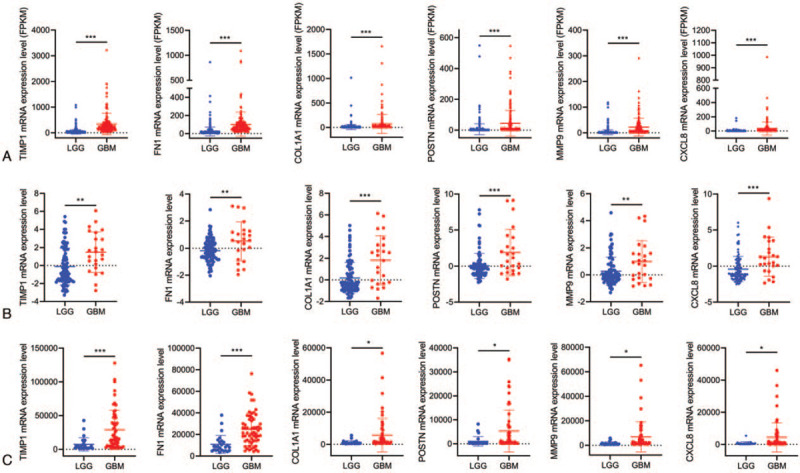
Top 6 hub genes mRNA expression levels in TCGA and GEO database between LGG and GBM. (A) TCGA; (B) GSE52009; (C) GSE4412. Differences between groups were analyzed by the Student t test, ∗P < 0.05; ∗∗P < 0.01, ∗∗∗P < 0.001.
3.5. The mRNA expression levels of hub genes in Oncomine database
Oncomine, an online microarray database, was used to validate the expression levels of hub genes in LGG and GBM. There we showed six representative datasets for analyzing hub genes. As shown in Figure 5A, TIMP1 in GBM was high expression in Sun, Liang, Bredel, and Freije datasets. FN1 was more highly expressed in GBM from vandenBoom, Nutt, Sun, and Bredel datasets (Fig. 5B). Up-regulation of COL1A1 was found in GBM based on Sun, vandenBoom, Bredel, and Freije datasets (Fig. 5C). Moreover, POSTN expression level was decreased in LGG tissues from Liang, Sun, Nutt, and Freije datasets (Fig. 5D). Compared to GBM, MMP9 was reduced in LGG, demonstrated by Liang, Bredel, Nutt, and Sun datasets (Fig. 5E). As for CXCL8, Liang, vandenBoom, Freije, and Sun datasets showed high expression levels in GBM, compared to LGG (Fig. 5F).
Figure 5.
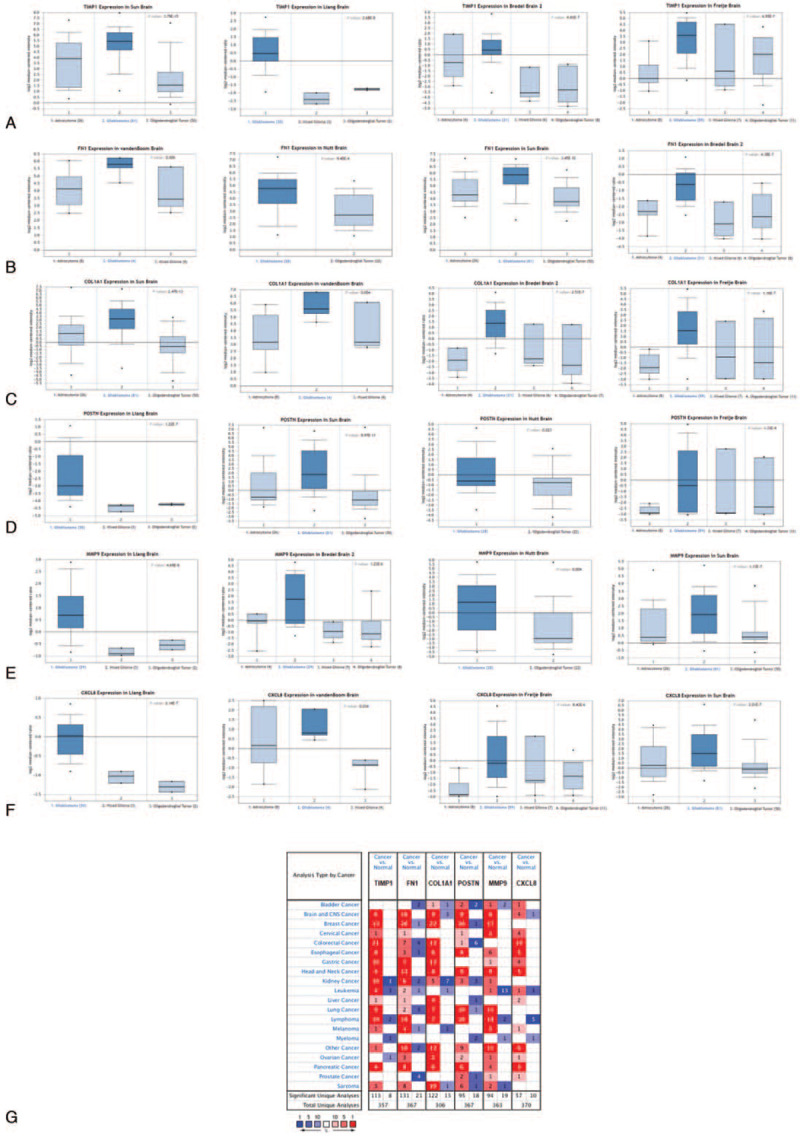
Top 6 hub gene mRNA expression levels in Oncomine database. (A) TIMP1; (B) FN1; (C) COL1A1; (D) POSTN; (E) MMP9; (F) CXCL8; (G) The hub genes in human cancers, the number in the colored cell represents the number of studies meeting thresholds. The more stressed red (over-expression) or blue (under-expression) indicates a more highly significant relationship. Differences between groups were analyzed by the Student t test or one way ANOVA.
Besides, we used Oncomine dataset to analyze the hub genes expression level differences between tumor and normal tissues. As shown in Figure 5G, the database contained a total of 357, 367, 306, 367, 363, and 370 unique analyses for TIMP1, FN1, COL1A1, POSTN, MMP9, and CXCL8, respectively. In all types of tumors, TIMP1 was ranked with the top 10% of all genes showing statistically significant differences in 121 studies, with 113 studies demonstrated higher expression levels in tumor than normal tissues. Up-regulation of FN1 was found in tumor in 131 studies. 122 significant unique analyses revealed that the mRNA expression level of COL1A1 was higher in tumor. Compared to normal tissues, POSTN was up-regulated in tumors among 95 studies, while reduced expression was found in 18 studies. Higher expression of MMP9 was found in most cancers. As for CXCL8, only 67 studies were listed, and 57 studies showed high level of CXCL8 in tumor tissues. And all hub genes were up-regulated among brain and CNS cancer. Altogether, the transcriptional expression levels of hub genes were significantly up-regulated in GBM, compared to LGG and tumor tissues, compared to normal tissues.
3.6. The Kaplan–Meier plotter of hub genes
The website, http://gepia.cancer-pku.cn/, could provide the prognostic data of the hub genes based on TCGA database. And we found that expression of TIMP1 (HR=3, P = 7.8 × 10⁻⁹) was associated with worse OS for LGG patients, as well as FN1 (HR = 1.8, P = .0022), COL1A1 (HR = 2, P = .00028), POSTN (HR = 1.7, P = .0065), not MMP9 (HR = 1.4, P = .093) and CXCL8 (HR = 1.3, P = .13) (Fig. 6A–F). Only FN1 and CXCL8 expression levels were associated with worse OS for GBM patients (HR = 1.5, P = .028, HR = 1.4, P = .049), respectively. Furthermore, POSTN expression had a trend for evaluating the prognosis of GBM patients (Fig. 6G–L).
Figure 6.
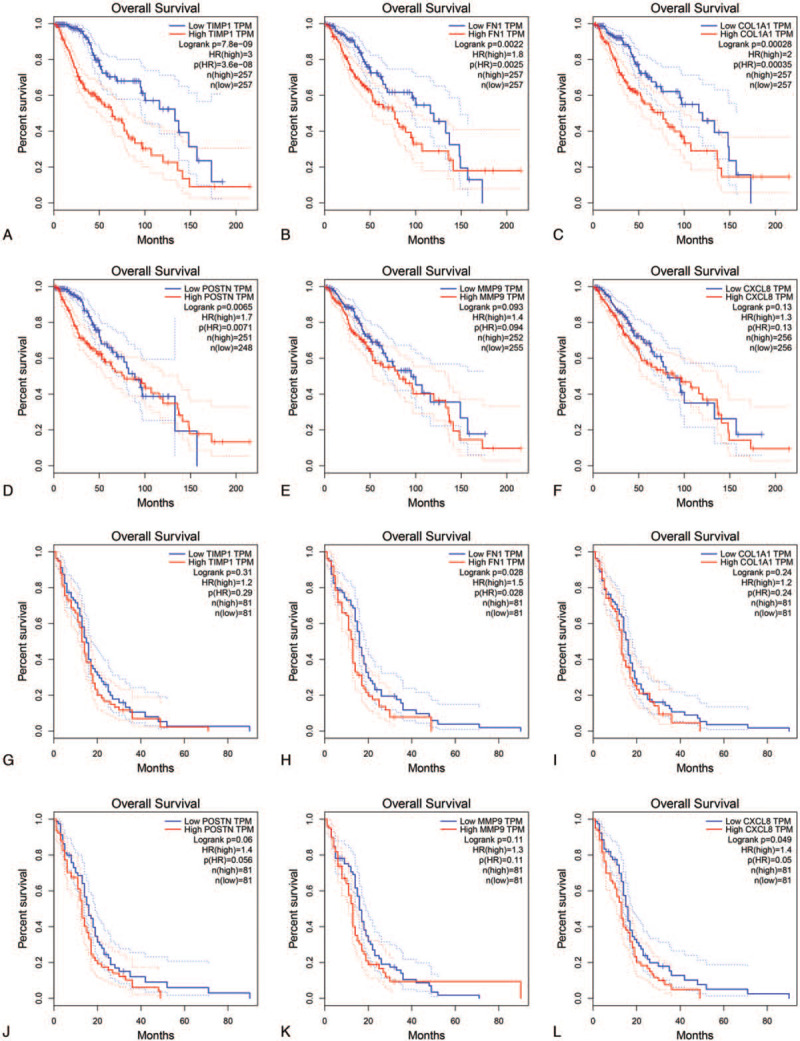
Kaplan-Meier plotters and log-rank tests for the prognostic value of the hub genes in LGG (A-F, A, TIMP1; B, FN1; C, COL1A1; D, POSTN; E, MMP9; F, CXCL8) and GBM (G-L, G, TIMP1; H, FN1; I, COL1A1; J, POSTN; K, MMP9; L, CXCL8).
3.7. Validation in the CGGA database
Next, we used CGGA database, which is based on a Chinese glioma patient information, to validate hub genes expression levels and prognostic value. This database has 3 datasets, including mRNAseq-325, mRNAseq-693 and mRNA array-301. mRNAseq-325 contained 325 samples which involved 182 LGG, 139 GBM and 4 unclear patients (accession number: PRJCA001746, platform: Illumina HiSeq2000 or 2500), mRNAseq-693 contained 693 samples which involved 443 LGG, 249 GBM, and 1 unclear patients (accession number: PRJCA001747, platform: Illumina HiSeq) and mRNA array-301 contained 301 patients which involved 174 LGG, 124 GBM and 2 unclear patients (platform: Agilent Whole Human Genome). We found that 6 hub genes were associated with tumor grade, except for POSTN in grade II and III (Fig. 7).
Figure 7.
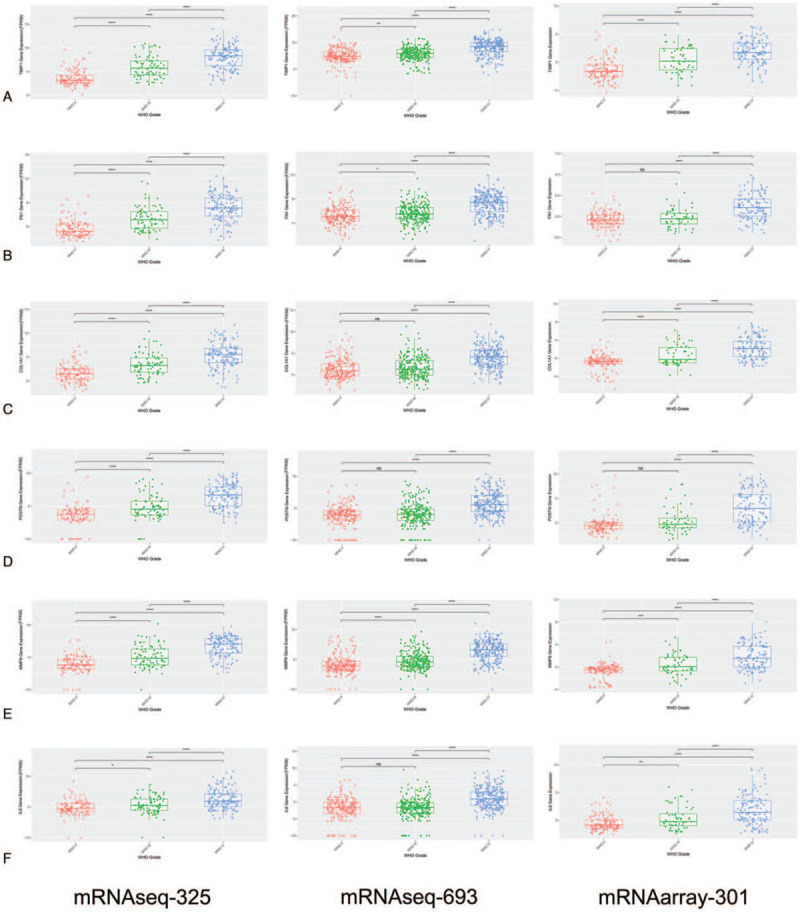
The hub genes mRNA expression levels in CGGA database. (A) TIMP1; (B) FN1; (C) COL1A1; (D) POSTN; (E) MMP9; (F) CXCL8. Differences between groups were analyzed by the Student t test, ∗P < 0.05; ∗∗P < 0.01, ∗∗∗P < 0.001, ns, not significant.
As shown in Figure 8, the Kaplan–Meier survival analysis showed that all 6 hub genes were significantly associated with OS, a higher expression level in patients with shorter OS. Furthermore, we evaluated the prognostic value of hub genes in different tumor grade groups. Statistically significant difference was found in patients with grade III and IV group, and no difference was found in tumor grade II group for TIMP1, as well as FN1 and MMP9 (Fig. 8A, B, E). For COL1A1, it only showed the prognostic value in patients with tumor grade II (Fig. 8C). POSTN could predict patients with tumor grade II and III, which was similar with TCGA database (Fig. 8D). The expression level of CXCL8 showed the statistically significant difference in patients with tumor grade IV, which met the same result in TCGA database (Fig. 8F).
Figure 8.
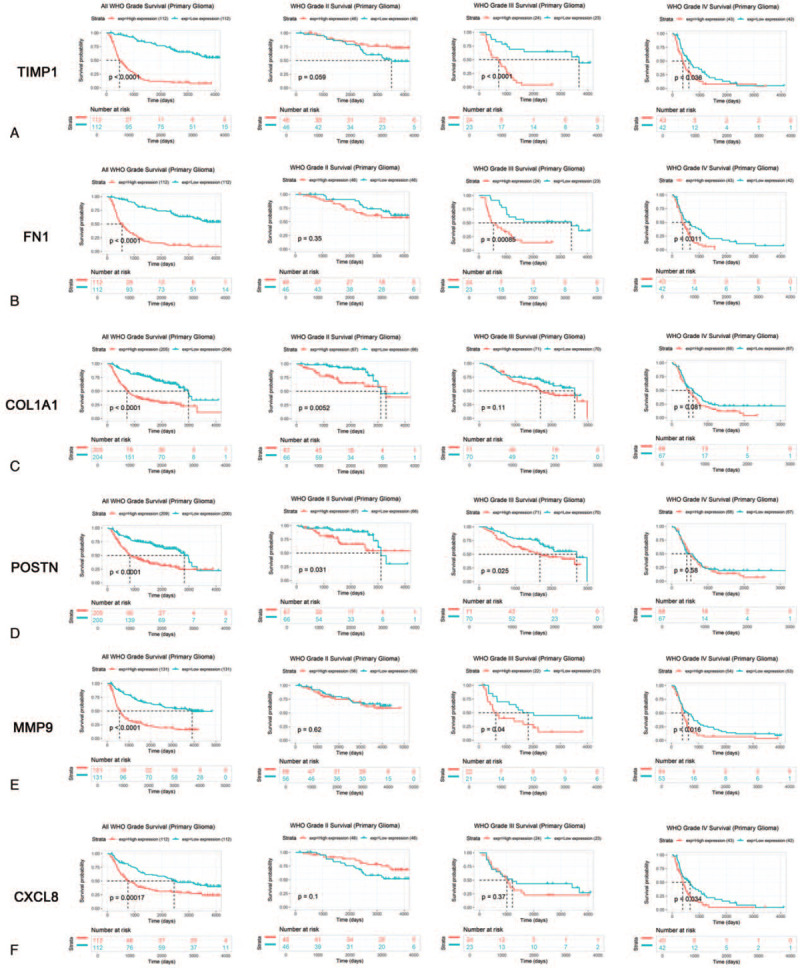
Kaplan-Meier plotters and log-rank tests for the prognostic value of hub genes in CGGA database. (A) TIMP1; (B) FN1; (C) COL1A1; (D) POSTN; (E) MMP9; (F) CXCL8.
3.8. Identification of hub genes associated biological pathways
GSEA analysis was performed to determine the biologic characteristics of hub genes using TCGA database. As shown in Figure 9A, TIMP1 regulated biology process mainly associated with sugar metabolism, glutathione metabolism, and leukocyte transendothelial migration, indicating that TIMP1 might regulate metabolism and cell metastasis. Similar results were obtained in COL1A1, POSTN, MMP9, and CXCL8 group (Fig. 9C–F). It was interesting to find that FN1 might function in cell cycle-related pathways, including glycan biosynthesis, cell cycle, and cell apoptosis (Fig. 9B).
Figure 9.
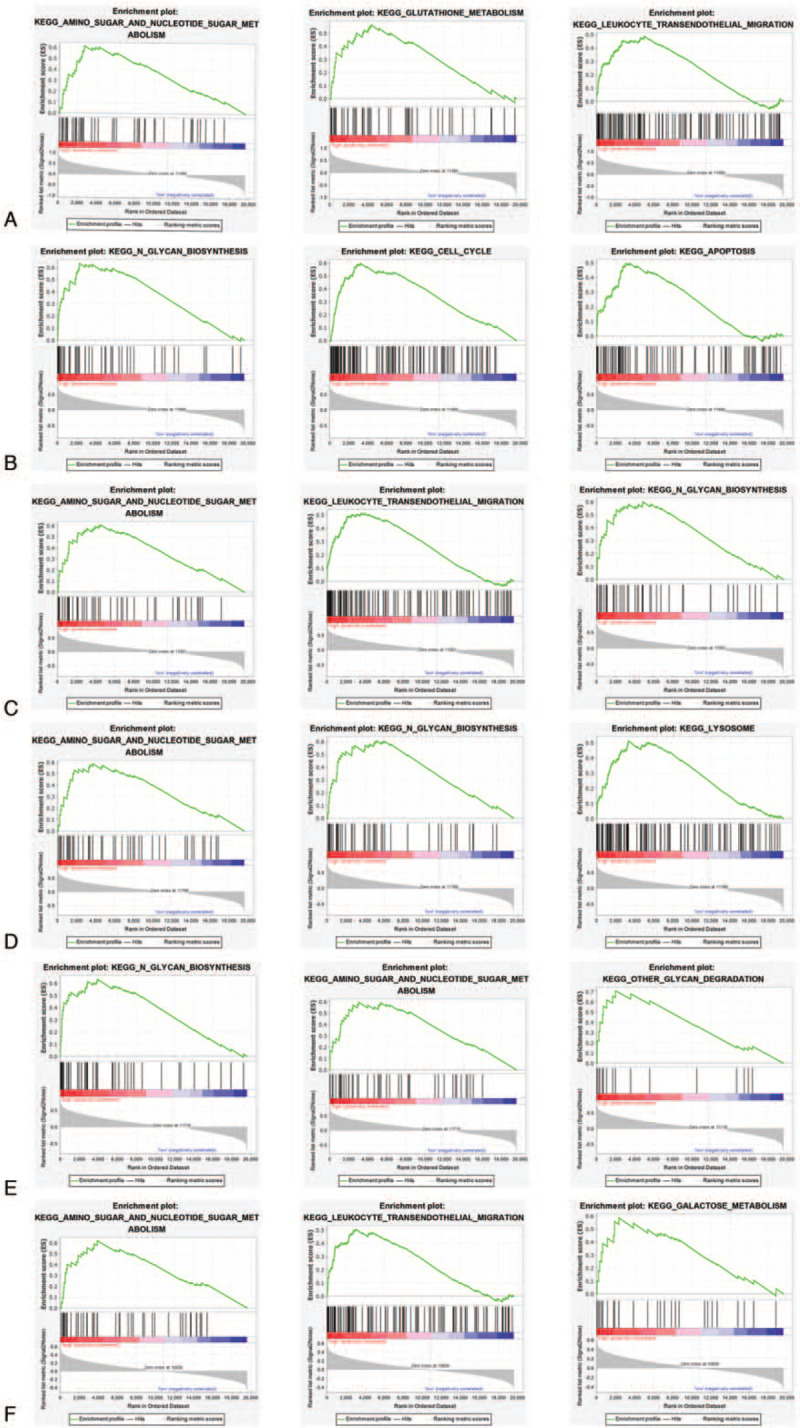
Signaling pathways associated with hub genes predicted by GSEA. (A) TIMP1; (B) FN1; (C) COL1A1; (D) POSTN; (E) MMP9; (F) CXCL8.
4. Discussion
The formation of tumor and the increase of malignant degree are caused by the accumulation of many gene alterations.[25] As a common malignant tumor in the brain, up to 70% of LGG transform into HGG within 10 years. This transformation process involves changes in many genes and molecular pathways.[5] This study is conducted to determine the DEGs between LGG and GBM through bioinformatics analysis. And further explore and study the molecular functional pathways involved in these DEGs, as well as their impact on tumor prognosis. Therefore, it is possible to use these DEGs as biomarkers and therapeutic targets in clinical practice, which can help the diagnosis and treatment of gliomas, and improve the prognosis of GBM.
The 5-year survival rate and overall survival time of patients with LGG and GBM are significantly different.[26] GBM grows rapidly, has high invasiveness, is easy to cause neurological symptoms, not sensitive to chemotherapy, and easy to relapse after treatment.[4] GBM can be divided into primary and secondary GBM, which are difficult to be differentiated histologically. Secondary GBM develops from LGG. Existing studies have shown that IDH mutation is a clear molecular marker for the diagnosis of secondary GBM, and it is more accurate than clinical and pathological diagnostic criteria.[7] In addition, TP53 mutation and 19q deletion are more common gene changes in secondary GBM.[8,28] Although there are some differences between primary and secondary GBM, they still have similar gene expression profiles.[27] However, there are great differences between LGG and GBM in terms of biological behavior, histology, and gene expression profiles.[28] Therefore, it is necessary to use the existing biological information analysis to further explore the differences between LGG and GBM, and help clinical diagnosis and treatment.
We used GO analysis to further clarify the functions of DEGs in biological pathways, cellular component and molecular function. Down-regulated DEGs are mainly related to the synaptic membrane structure and the activity of membrane channel, and participate in the regulation of trans-synaptic signaling. This result revealed that the down-regulated DEGs between LGG and GBM control the biological behavior of gliomas by regulating signals among different neurons. However, the up-regulated DEGs increased the malignant degree of glioblastoma mainly by changing the extracellular matrix, cytokines, and microenvironment. The above results showed that up-regulated and down-regulated DEGs changed the molecular functions, signal transduction and biological behavior of LGG and GBM through different biological pathways. The results of KEGG pathway analysis are consistent with GO analysis. The significantly enriched key pathways were cytokine-cytokine receptor interaction and neuroactive ligand-receptor interaction in up-regulated and down-regulated DEGs, respectively.
PPI network analysis was used to reveal the interactions between proteins encoded by DEGs. We identified PPI network using FC>4 to focus on DEGs with more clinical significance. Similarly, we set the cut-off criterion of interaction confidence to be greater than 0.4. The important nodes and hub DEGs in the PPI network were predicted and explored by CytoHubba. Finally, we screened out the 6 most important DEGs from PPI network analysis, and made a detailed and in-depth study on them. The 6 hub genes we focused on have been described above, as shown below: TIMP1, FN1, COL1A1, POSTN, MMP9, and CXCL8.
The expression level of TIMP1 increased significantly in malignant tumors, which can inhibit the apoptosis of tumor cells. The high expression of this gene correlates with a poor prognosis of the patients.[29] In malignant gliomas, TIMP1 is related to the decomposition of extracellular matrix and can promote the invasion and movement of tumor cells.[30] Fibronectin-1 encoded by FN1 is an important cell adhesion molecule in the extracellular matrix. Fibronectin-1 has the functions of regulating cell adhesion, growth and differentiation, promoting cell migration and proliferation, as well as ion exchange and information transfer.[31] FN1 plays an important role in the invasion and metastasis of malignant tumors, and it is also one of the current research hotspots. At present, there is a few studies focusing on FN1 and gliomas.[32] The COL1A1 gene provides instructions for making part of a large molecule called type I collagen.[33] A recent study has shown that this gene is related to the poor prognosis of malignant gliomas.[34] By knocking down of COL1A1 in invasive gliomas, the progression of tumor can be reduced and the survival rate of experimental animals can be significantly improved.[35] POSTN encodes an unstructured extracellular matrix protein called periostin. The protein can interact with multiple integrins and participate in cell proliferation, cell migration, and epithelial-mesenchymal transition.[35] This gene is expressed in the process of inflammation and many kinds of cancers, and is related to the resistance to antiangiogenic therapy and poor prognosis of gliomas.[36,37] The overexpression of MMP9 can also promote the invasion and progression of gliomas, and is related to poor prognosis.[38–40] High expression of CXCL8 in gliomas with release more cytokines, stimulate inflammation, promote cell proliferation, and lead to tumor progression.[41] The mechanism by which CXCL8 works is related to inflammatory stimulation, tumor angiogenesis, and JAK/STAT1/HIF-1α/Snail pathway activation.[42,43]
Oncomine database is one of the largest cancer gene chip databases in the world, and is committed to the data standardization and analysis of gene expression profile data of tumor samples.[17] Oncomine database can be used to analyze gene expression differences, predict co-expressed genes, and classify according to the clinical information such as tumor staging and tissue types.[44] CGGA database is the largest functional genomics database of gliomas in Asia. Its information covers matched samples of different pathological types and malignant degrees. In this study, the expression level and prognostic value of hub genes were validated by the above 2 databases.[23] Through multiple databases and multiple methods of interactive verification, we can improve the reliability and accuracy of bioinformatics analysis in this study, and reduce the research deviation caused by single database analysis.
However, there are several limitations in this study. The results above, identified in TCGA database and validated in GEO, Onocomine database, and CGGA datasets, were not validated using new tissue samples. Second, the functions of hub genes were not functionally tested, which would be conducted in our further studies.
5. Conclusion
This study carried out a systematic bioinformatics analysis of DEGs between LGG and GBM. The results provide potential biomarkers and therapeutic targets for gliomas. However, further experimental verification is needed to directly determine the role of these DEGs in glioma.
Author contributions
BX designed the study, collected the data, performed the bioinformatics analysis, analyzed the data and wrote the manuscript.
Writing – original draft: Baowei Xu.
Footnotes
Abbreviations: BP = biological pathways, CC = cellular component, CGGA = Chinese Glioma Genome Atlas, COL1A1 = collagen type I alpha 1 chain, CXCL8 = C-X-C motif chemokine ligand 8, DEG = differentially expressed gene, FDR = false discovery rate, FN1 = fibronectin 1, GBM = glioblastoma multiforme, GEO = Gene Expression Omnibus, GO = Gene Ontology, GSEA = Gene Set Enrichment Analysis, KEGG = Kyoto Encyclopedia of Genes and Genomes, LGG = low-grade glioma, MF = molecular function, MMP9 = matrix metallopeptidase 9, OS = overall survival, POSTN = periostin, PPI = protein–protein interaction, TCGA = The Cancer Genome Atlas, TIMP1 = TIMP metallopeptidase inhibitor 1.
How to cite this article: Xu B. Prediction and analysis of hub genes between glioblastoma and low-grade glioma using bioinformatics analysis. Medicine. 2021;100:3(e23513).
The datasets analyzed during the current study are available as follows:
1. The Cancer Genome Atlas (TCGA) database (https://tcgadata.nci.nih.gov/tcga/).
2. National Center of Biotechnology Information's GEO database (www.ncbi.nlm.nih.gov/geo/) with the accession numbers GSE4421 and GSE52009.
3. The online Search Tool the Retrieval of Interacting Genes (STRING) database (http://www.string-db.org).
4. The Oncomine database (https://www.oncomine.org).
5. Gene Expression Profiling Interactive Analysis (GEPIA) database (http://gepia.cancer-pku.cn/).
6. Chinese Glioma Genome Atlas (CGGA) data (http://www.cgga.org.cn/).
The author declare that he has no competing interests.
The datasets generated during and/or analyzed during the current study are publicly available.
References
- [1].Quinn, Ostrom, Haley, et al. CBTRUS statistical report: primary brain and other central nervous system tumors diagnosed in the United States in 2011-2015. Neuro-oncology 2018;iii1–86. [Google Scholar]
- [2].Venneti S, Huse JT. The evolving molecular genetics of low-grade glioma. Adv Anatom Pathol 2015;22:94–101. [DOI] [PMC free article] [PubMed] [Google Scholar]
- [3].Claus EB, Black PM. Survival rates and patterns of care for patients diagnosed with supratentorial low-grade gliomas: data from the SEER program, 1973-2001. Cancer 2006;106:1358–63. [DOI] [PubMed] [Google Scholar]
- [4].Perry JR, Laperriere N, O’Callaghan CJ, et al. Short-course radiation plus temozolomide in elderly patients with glioblastoma. N Engl J Med 2017;376:1027–37. [DOI] [PubMed] [Google Scholar]
- [5].Gustavo DL, Loraine C, Cassia R. Gliomas and the vascular fragility of the blood brain barrier. Front Cell Neurosci 2014;8:418. [DOI] [PMC free article] [PubMed] [Google Scholar]
- [6].RH D, JD, SF, et al. Prognostic value of O-6-methylguanine-DNA methyltransferase (MGMT) protein expression in glioblastoma excluding nontumour cells from the analysis. Neuropathol Appl Neurobiol 2018;44:172–84. [DOI] [PubMed] [Google Scholar]
- [7].Eckel-Passow JE, Lachance DH, Molinaro AM, et al. Glioma groups based on 1p/19q, IDH, and TERT promoter mutations in tumors. N Engl J Med 2015;372(26.): [DOI] [PMC free article] [PubMed] [Google Scholar]
- [8].Kim YW, Liu TJ, Koul D, et al. Identification of novel synergistic targets for rational drug combinations with PI3 kinase inhibitors using siRNA synthetic lethality screening against GBM. Neuro Oncology 2011;13:367–75. [DOI] [PMC free article] [PubMed] [Google Scholar]
- [9].García-Escudero R, Paramio JM. Gene expression profiling as a tool for basic analysis and clinical application of human cancer. Mol Carcinog 2008;47:573–9. [DOI] [PubMed] [Google Scholar]
- [10].Weeraratna AT. Discovering causes and cures for cancer from gene expression analysis. Ageing Res Rev 2005;4:0–563. [DOI] [PubMed] [Google Scholar]
- [11].Li J, Lu Y, Akbani R, et al. TCPA: a resource for cancer functional proteomics data. Nat Methods 2013;10:1046–7. [DOI] [PMC free article] [PubMed] [Google Scholar]
- [12].Cheng W, Ren X, Zhang C, et al. Bioinformatic profiling identifies an immune-related risk signature for glioblastoma. Neurology 2016;10.1212/WNL.0000000000002770. [DOI] [PubMed] [Google Scholar]
- [13].Jiang CM, Wang XH, Shu J, et al. Analysis of differentially expressed genes based on microarray data of glioma. Int J Clin Exp Med 2015;8:17321–32. [PMC free article] [PubMed] [Google Scholar]
- [14].Subramanian A, Kuehn H, Gould J, et al. GSEA-P: a desktop application for Gene Set Enrichment Analysis. Bioinformatics 2007;23:3251–3. [DOI] [PubMed] [Google Scholar]
- [15].Tang Z, Li C, Kang B, et al. GEPIA: a web server for cancer and normal gene expression profiling and interactive analyses. Nucleic Acids Res 2017;(W1):W1. [DOI] [PMC free article] [PubMed] [Google Scholar]
- [16].Liu M, Xu Z, Du Z, et al. The Identification of key genes and pathways in glioma by bioinformatics analysis. J Immunol Res 2017;2017:1–9. [DOI] [PMC free article] [PubMed] [Google Scholar]
- [17].Rhodes DR, Kalyana-Sundaram S, Mahavisno V, et al. Oncomine 3.0: genes pathways, and networks in a collection of 18,000 cancer gene expression profiles. Neoplasia 2007;9:166–80. [DOI] [PMC free article] [PubMed] [Google Scholar]
- [18].Yang P, Yan W, Zhang W, et al. Whole-genome messenger RNA profiling reveals genes involved in malignant progression of glioma. Zhonghua Yi Xue Za Zhi 2013;93:5–7. [PubMed] [Google Scholar]
- [19].Freije WA, Castro-Vargas FE, Fang Z, et al. Gene expression profiling of gliomas strongly predicts survival. Cancer Res 2004;64:6503–10. [DOI] [PubMed] [Google Scholar]
- [20].Ashburner MM, Ball CAC, Blake JAJ, et al. Gene ontology: tool for the unification of biology. The gene ontology consortium. Nat Genet 2000;25:25–9. [DOI] [PMC free article] [PubMed] [Google Scholar]
- [21].Minoru K, Susumu G. KEGG: Kyoto encyclopedia of genes and genomes. Nucleic Acids Res 2000;1. [DOI] [PMC free article] [PubMed] [Google Scholar]
- [22].Damian S, Andrea F, Stefan W, et al. STRING v10: protein-protein interaction networks, integrated over the tree of life. Nucleic Acids Res 2015;43:447–52. [DOI] [PMC free article] [PubMed] [Google Scholar]
- [23].Shen F, Guo Q, Hu Q, et al. RelB, a good prognosis predictor, links cell cycle and migration to glioma tumorigenesis. Oncol Lett 2018;15:4404–10. [DOI] [PMC free article] [PubMed] [Google Scholar]
- [24].Vecchi M, Nuciforo P, Romagnoli S, et al. Gene expression analysis of early and advanced gastric cancers. Oncogene 2007;26:4284–94. [DOI] [PubMed] [Google Scholar]
- [25].Carter SL, Eklund AC, Kohane IS, et al. A signature of chromosomal instability inferred from gene expression profiles predicts clinical outcome in multiple human cancers. Nat Genet 2006;38:1043–8. [DOI] [PubMed] [Google Scholar]
- [26].Werner JM, Kuhl S, Stavrinou P, et al. Expression of FAS-L differs from primary to relapsed low-grade gliomas and predicts progression-free survival. Anticancer Res 2017;37:6639–48. [DOI] [PubMed] [Google Scholar]
- [27].Ohgaki H, Kleihues P. The definition of primary and secondary glioblastoma. Clin Cancer Res 2013;19:764–72. [DOI] [PubMed] [Google Scholar]
- [28].Reon BJ, Jordan A, Ying Z, et al. Expression of lncRNAs in low-grade gliomas and glioblastoma multiforme: an in silico analysis. PLoS Med 2016;13:e1002192. [DOI] [PMC free article] [PubMed] [Google Scholar]
- [29].Yi L, Jiang-fei W, Guang-zu G, et al. Plasma levels of tissue inhibitor of matrix metalloproteinase-1correlate with diagnosis and prognosis of glioma patients. Chin J Med 2013;126:4295–300. [PubMed] [Google Scholar]
- [30].Singh MK, Bhattacharya D, Chaudhuri S, et al. T11TS inhibits glioma angiogenesis by modulation of MMPs, TIMPs, with related integrin αv and TGF-β1 expressions. Tumor Biol 2013;35: [DOI] [PubMed] [Google Scholar]
- [31].Ohnishi T, Hiraga S, Izumoto S, et al. Role of fibronectin-stimulated tumor cell migration in glioma invasion in vivo: clinical significance of fibronectin and fibronectin receptor expressed in human glioma tissues. Clin Exp Metastasis 1998;16:729–41. [DOI] [PubMed] [Google Scholar]
- [32].Jian, Gong, Zhao-Xia, et al. miRNA1271 inhibits cell proliferation in neuroglioma by targeting fibronectin 1. Mol Med Rep 2017;16:143–50. [DOI] [PMC free article] [PubMed] [Google Scholar]
- [33].Lee EX, Lam DH, Wu C, et al. Glioma gene therapy using induced pluripotent stem cell derived neural stem cells. Mol Pharmaceut 2011;8:1515–24. [DOI] [PubMed] [Google Scholar]
- [34].Koji Y, Hideki M, Ryusuke H, et al. Quantification of proneural gene-expression signature of gliomas and glioblastoma-derived spheres. Neuro Oncol 2014;suppl_3: sul_3. [Google Scholar]
- [35].Andrea C, Patrick JD, Anna EA, et al. TMIC-58. the cellular and molecular basis for mesenchymal transformation in gliomas. Neuro Oncol 2019;Supplement_6: Sulement_6. [Google Scholar]
- [36].Young PS, Yuji P, John dG. AI-23Periostin regulates tumor resistance to antiangiogenic therapy through emt and angiogenesis-related mechanisms in glioma stem cell models. Neuro Oncol 2014;suppl_5: sul_5. [Google Scholar]
- [37].Park SY, Piao Y, Jeong KJ, et al. Periostin (POSTN) regulates tumor resistance to antiangiogenic therapy in glioma models. MolCancer Therapeut 2016;15:2187–97. [DOI] [PMC free article] [PubMed] [Google Scholar]
- [38].Cai H, Wang J, Xi S, et al. Tenascin-cmediated vasculogenic mimicry formation via regulation of MMP2/MMP9 in glioma. Cell Death Dis 2019;10:879. [DOI] [PMC free article] [PubMed] [Google Scholar]
- [39].Emeline T, Françoise B, Patrizia F, et al. MMP2 and MMP9 as candidate biomarkers to monitor bevacizumab therapy in high-grade glioma. Neuro Oncol 2015;8. [DOI] [PMC free article] [PubMed] [Google Scholar]
- [40].Feng S, Miao G, Han Y, et al. CARMA3 is overexpressed in human glioma and promotes cell invasion through MMP9 regulation in A172 cell line. Tumor Biol 2014;35:149–54. [DOI] [PubMed] [Google Scholar]
- [41].Braganhol E, Kukulski F, Lévesque SA, et al. Nucleotide receptors control IL-8/CXCL8 and MCP-1/CCL2 secretions as well as proliferation in human glioma cells. Biochim Biophys Acta 2014;1852:120–30. [DOI] [PubMed] [Google Scholar]
- [42].Chen Z, Mou L, Pan Y, et al. CXCL8 promotes glioma progression by activating the JAK/STAT1/HIF-1α/snail signaling axis. OncoTargets Therapy 2019;12:8125–38. [DOI] [PMC free article] [PubMed] [Google Scholar] [Retracted]
- [43].Brat DJ, Bellail AC, Meir EGV. The role of interleukin-8 and its receptors in gliomagenesis and tumoral angiogenesis. Neuro Oncol 2005;7:122–33. [DOI] [PMC free article] [PubMed] [Google Scholar]
- [44].Chinnaiyan A. Oncomine and caBIG advance cancer bioinformatics - the scientist - magazine of the life sciences. Scientist 2010;19. [Google Scholar]


