Abstract
The aim of this study was to evaluate the association of non-hepatic hyperammonemia (NHH) with the prognosis of critically ill patients with NHH.
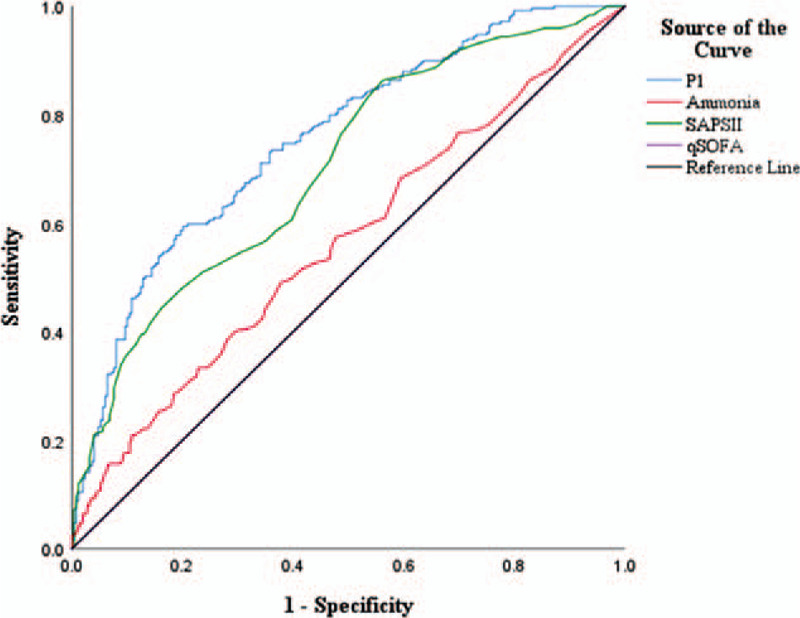
According to the serum ammonia level, the patients with NHH (n = 498) were retrieved by us. The risk factors of the mortality with NHH patients were investigated by conducting univariate and multivariate logistic regression analyses. A nomogram to predict the risk of hospital mortality was constructed. Receiver operating characteristic curve (ROC) analysis was conducted to compare nomogram (ammonia into a prognostic model, P1) with the simplified acute physiology II (SAPSII) and quick sequential organ failure assessment (qSOFA).
Five independent factors for the mortality in patients with NHH were identified, including age, platelets, bun, hemoglobin, and ammonia. Models P1 using ammonia showed good prediction power. The AUROC of P1 (AUROC, 0.755 [95% CI, 0.713–0.796]) was higher than that of qSOFA (AUROC, 0.500 [95% CI, 0.449–0.551]), and SAPS II (AUROC, 0.703[95% CI, 0.658–0.748]).
Ammonia was an independent prognostic predictor of mortality for NHH patients. We developed a nomogram that can predict hospital mortality with patients. Nomogram had superior discriminative power to qSOFA and SAPS II, indicating that the nomogram may have clinical utility.
Keywords: age, ammonia, hemoglobin, non-hepatic hyperammonemia, platelets
1. Introduction
Blood ammonia, a substance derived from the catabolism of various amino acids in human tissues, is produced by the ammonia absorbed in the intestine entering the bloodstream. The liver represents the primary detoxifying organ for ammonia, which is a neurotoxin. It is possible for elevated blood ammonia to cause hepatic encephalopathy.[1] However, hyperammonemia encephalopathy can progress from confusion to coma with cerebral edema, and brain stem herniation. For the patients in the intensive care unit, hyperammonemia is associated with high mortality.[2] Elevated blood ammonia without a history of liver disease is defined as non-hepatic hyperammonemia (non-hepatic hyperammonemia, NHH). NHH occurs in up to 73% of critically ill patients. Related to multiple-organ damage, NHH prolongs the ICU stay and results in higher mortality.[3]
At present, the study on non-hepatic hyperammonemia remains limited, and most of them focus on the risk factors for patients with non-hepatic hyperammonemia, which is attributed to multiple myeloma,[4] valproate,[5] sepsis, and kidney disease and gastrointestinal bleeding.[6,7] Despite the high occurrence, and mortality among the patients with non-hepatic hyperammonemia, a prognostic tool is still not applied to predict the mortality of non-hepatic hyperammonemia.
The aim of this study was to evaluate the association of non-hepatic hyperammonemia with the prognosis of critically ill patients, identify the risk factors for the premature death of non-hepatic hyperammonemia patients and reduce mortality in the patients with non-hepatic hyperammonemia.
2. Materials and methods
2.1. General information
A retrospective study was performed at the ICU of Chifeng Municipal Hospital from March 2012 to February 2018. Data retrieved through the hospital's electronic case system. Inclusion criteria:
-
1.
Aged between 18 and 89;
-
2.
Admission for over 24 h;
-
3.
The blood ammonia level of over 35 umol/L was treated as hyperammonemia. Exclusion criteria: Excluded patients with liver disease.
2.2. Data retrieval method
The worst laboratory test and the mean value of vital signs during the first 24 h of ICU admission were collected. Such as age, gender, heart rate (HR), systolic pressure (SBP), diastolic pressure (DBP), and respiratory rate (RR), the maximum level of blood ammonia during hospitalization and the biochemical examinations (alanine aminotransferase (ALT), aspartate aminotransferase (AST), albumin (ALB), total bilirubin (Tbil), PTT, INR, PT, WBC, hemoglobin (HGB), platelets (PLT), BUN, creatinine (Cr), glucose (Glu), and ammonia), SPO2 of patients within 24 h of admission, and SAPS II score, qSOFA score of patients, length of stay hospital (LOS), and hospital mortality.
2.3. Statistical analysis
The single-sample Kolmogorov–Smirnov test was conducted to determine data distribution. The characteristics of patients were described using the median (interquartile range [IQR]), or frequency and percentage, as appropriate. In order for prediction of the mortality of non-hepatic hyperammonemia, univariate, and multivariable competing risk regression, on the basis of the results from the final regression analysis, a nomogram for hospital mortality probability was constructed. The performance of the nomogram was assessed by discrimination. The discriminative ability of the model was determined by the area under the receiver operating characteristic curve. A non-parametric test (Mann–Whitney U test or Kruskal–Wallis test) was used for comparisons between the non-hyperammonemia groups and the relationship between serum ammonia and age. P < .05 was treated as statistically significant. All statistical analyses were conducted using SPSS 25 software and R software.
3. Results
3.1. Baseline characteristics and outcomes
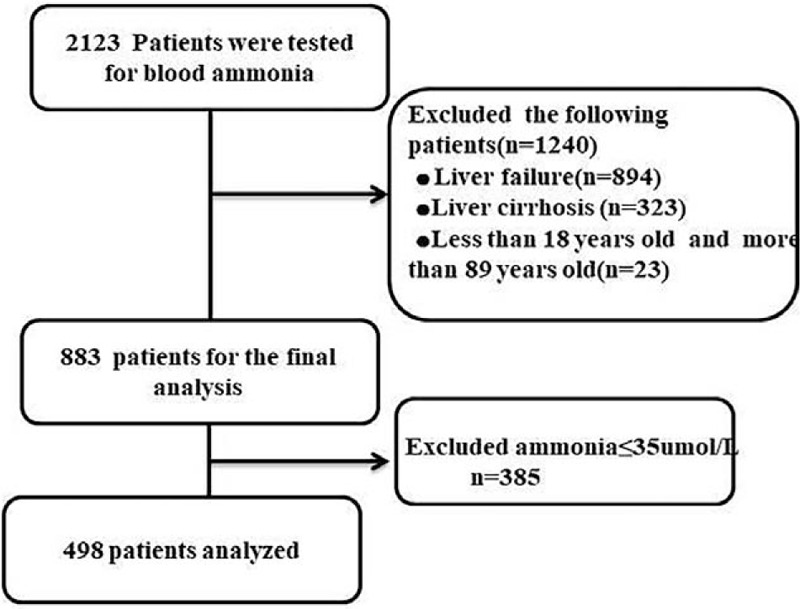
A total of 2123 patients with blood ammonia level tested were retrieved in the Department of Critical Care Medicine, Chifeng Municipal Hospital, China, and totally of 1217 patients with liver disease were excluded. Twenty-three patients were excluded due to age limit, 385 patients were excluded for ammonia in no excess of 35 umol/L, and 498 patients were analyzed. The missing values are lower than 10%, and the mean value interpolation method was applied to process the missing values (Fig. 1).
Figure 1.

Flow chart of study Data Search.
In total, 498 patients meeting the inclusion above criteria were identified. The patients with hospital admission were characterized, as shown in Table 1. The average age on admission is 60.13 (50.26-70.40) years, and 57.63% of the cohort are male. 50% of the patients died in hospitalization.
Table 1.
Characteristics of Study Population.
| Characteristics | |
| Age, years | 60.13 (50.26–70.40) |
| Male sex | 287 (57.63%) |
| Ammonia (umol/L) | 53 (42.75–73) |
| ALT (IU/L) | 21 (14–30) |
| AST (IU/L) | 32 (21–63) |
| Tbil (mg/dL) | 0.7 (0.4–1.92) |
| ALB (g/L) | 3.0 (2.5–3.6) |
| Cr (mg/dL) | 1.2 (0.8–2.2) |
| Glu (mg/dL) | 145 (115–185) |
| HGB (g/dL) | 9.8 (8.6–11.2) |
| PLT (×109 /L) | 175 (110–251.25) |
| APTT (s) | 36.35 (29.1–45.75) |
| INR | 1.3 (1.1–1.5) |
| PT (s) | 15.5 (13.6–17.91) |
| BUN (mg/dL) | 24 (15–44) |
| WBC (×109/L) | 11.4 (7.88–16.4) |
| HR | 106.48 (92–121) |
| SBP (mm Hg) | 91 (81–102) |
| DBP (mm Hg) | 43.17 (34–52) |
| RR | 27 (23–32) |
| SPO2 (mm Hg) | 93 (90–96) |
| qSOFA | 2 (1–2) |
| SAPSII | 37 (29–47) |
| LOS | 13 (6–23) |
| Hospital mortality (%) | 249 (50.0%) |
3.2. Ammonia was an independent prognostic predictor in patients
In univariate competing risk models, the indicators of mortality of the patients with non-hepatic hyperammonemia were identified, as shown in Table 2, which reveals that age, AST, Tbil, ALB, Cr, HGB, PLT, APTT, INR, PT, BUN, ammonia were associated with the mortality of the patients with non-hepatic hyperammonemia (P < .05 or P < .01). The significant results of the above-mentioned univariate analysis (P < .05) were inputted into a multivariate logistic regression analysis model for correction, which led to the finding that, ammonia (OR = 1.036; 95% CI: 1.021–1.052; P < .001), bun (OR = 1.018; 95% CI: 1.007–1.029; P = .001), HGB (OR = 0.873; 95% CI: 0.780–0.978; P = .019), PLT (OR = 0.977; 95% CI: 0.966–0.999; P = .002), and age (OR = 1.036; 95% CI:1.021–1.052; P < .001) were independent factors associated with the mortality of the patients with non-hepatic hyperammonemia (Table 2).
Table 2.
Univariate and multivariate analysis of risk factors to hospital mortality.
| Univariate analysis | Multivariate analysis | |||||||
| 95.0% CI | 95.0% CI | |||||||
| P | OR | Lower | Upper | P | OR | Lower | Upper | |
| Age, years | <.001 | 1.036 | 1.023 | 1.050 | <.001 | 1.036 | 1.021 | 1.052 |
| Gender | .276 | 0.821 | 0.575 | 1.172 | ||||
| Ammonia | .003 | 1.007 | 1.003 | 1.012 | .031 | 1.006 | 1.001 | 1.011 |
| ALT (IU/L) | .749 | 1.003 | 0.985 | 1.022 | ||||
| AST (IU/L) | .019 | 1.002 | 1.000 | 1.003 | ||||
| Tbil (mg/dL) | .001 | 1.088 | 1.035 | 1.144 | ||||
| ALB (g/L) | <.001 | 0.579 | 0.453 | 0.741 | ||||
| Glu (mg/dL) | .704 | 1.000 | 0.999 | 1.002 | ||||
| HGB (g/dL) | <.001 | 0.761 | 0.689 | 0.840 | .019 | 0.873 | 0.780 | 0.978 |
| PLT (×109 /L) | <.001 | 0.997 | 0.995 | 0.998 | .002 | 0.977 | 0.966 | 0.999 |
| APTT (s) | .002 | 1.011 | 1.004 | 1.019 | ||||
| INR | <.001 | 2.121 | 1.401 | 3.211 | ||||
| PT (s) | .004 | 1.047 | 1.015 | 1.080 | ||||
| Cr (mg/dL) | .001 | 1.183 | 1.069 | 1.309 | ||||
| BUN (mg/dL) | <.001 | 1.026 | 1.018 | 1.035 | .001 | 1.018 | 1.007 | 1.029 |
| WBC (×109/L) | .318 | 1.008 | 0.992 | 1.025 | ||||
| SPO2 (mm Hg) | .967 | 0.011 | 0.942 | 0.992 | ||||
3.3. Development of the prognostic scoring model
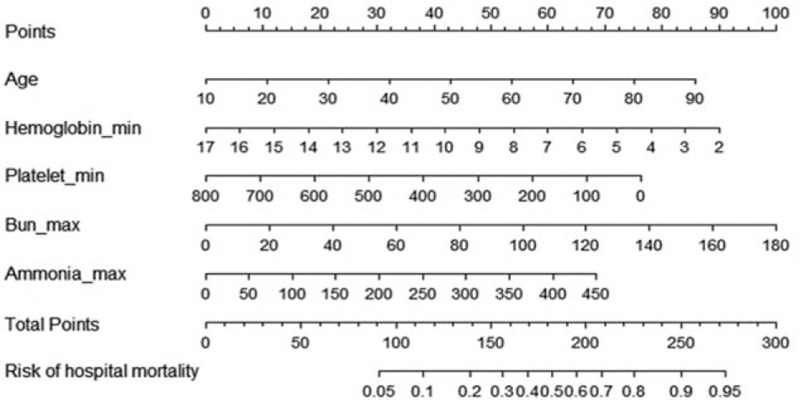
Based on the five independent prognostic factors selected by logstic's proportional hazard regression analysis, we established a scoring model (PI), a nomogram was constructed. To calculate a risk score, we assigned each of the five prognostic variables a number of points that were proportional to its regression coefficient. The value of each of these variables was given a score on the point scale axis. A total score could be easily calculated by adding every single score, and by projecting the total score to the lower total point scale, we were able to estimate the probability of hospital mortality in patients with NHH in critically ill patients (Fig. 2).
Figure 2.

ROC for the factors with significant difference in the multi-logistic Regression.
3.4. Discrimination of the nomogram
To further confirm the reliability of the nomogram (modle PI), the ROC curve was plotted and the area under the curve (AUC) was calculated. In addition, sensitivity and specificity were determined according to Youden's index, as shown in Figure 3. According to the results, the AUC values, specificity, and sensitivity of the above qSOFA, SAPS II, ammonia, PI affecting the prognosis of patients with non-hepatic hyperammonemia were as follows: ammonia (AUC: 0.564 sensitivity: 49.0%, specificity:62.2%), Qsofa (AUC:0.500, sensitivity:54.2%, specificity:25.3%), SAPS II (AUC:0.703, sensitivity:86.3%, specificity: 43.8%), P1 (AUC: 0.755, sensitivity:57.8%, specificity: 81.0%) (Table 3).
Figure 3.

A nomogram predicting the risk of hospital mortality in critically ill patients without liver disease. The value of each of variable was given a score on the point scale axis. A total score could be easily calculated by adding each single score. We were able to estimate the probability of hospital mortality in critically ill patients without liver disease.
Table 3.
ROC for the factors with significant difference in the multi-logistic Regression [(n)%].
| AUC | P | 95%CI | Sensitivity | Specificity | |
| Ammonia | 0.564 | .013 | 0.514–0.614 | 0.490 | 0.622 |
| qSOFA | 0.5.00 | 1.000 | 0.449–0.551 | 0.542 | 0.253 |
| SAPSII | 0.703 | <.001 | 0.658–0.748 | 0.863 | 0.438 |
| P1 | 0.755 | <.001 | 0.713–0.796 | 0.578 | 0.810 |
3.5. The relationship between serum ammonia and age
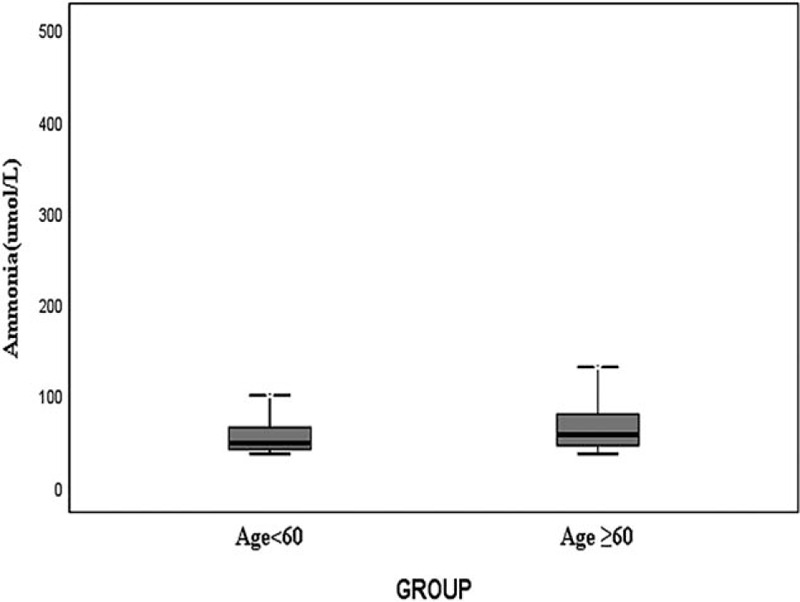
Patients were divided into the age ≥60 group (n = 251), age <60 group (n = 247), As shown in Figure 4, patients with higher age were associated with higher serum ammonia levels. Serum ammonia levels in age ≥60 group was significantly higher than in age <60 group (P < .001) (Fig. 4).
Figure 4.

Relationship between serum ammonia and age, P < .001.
4. Discussion
In this study, our focus is to evaluate the association of non-hepatic hyperammonemia with the prognosis of critically ill patients. The key findings of our study are as follows:
-
1.
non-hepatic hyperammonemia patients showed higher mortality.
-
2.
Ammonia was independent factor associated with mortality among the patients with non-hepatic hyperammonemia.
-
3.
Ammonia into a prognostic model PI exhibited a better predictive ability of mortality among the patients with non-hepatic than qSOFA and SAPS II.
From Table 1, it can be seen that the mortality of patients with non-hepatic hyperammonemia was 50%, which is high and consistent with the previous study.[2] In univariate competing risk models, the analytical results demonstrated that ammonia, AST, Tbil, ALB, PLT, APTT, INR, and PT were associated with death in the patients with non-hepatic hyperammonemia. However, as revealed by the multivariate logistic regression analysis model, the above-mentioned indicators were not independent risk factor in the death of patients with non-hepatic hyperammonemia except for platelets and ammonia, it was indicated that they were not the primary risk factors for death in the patients with non-hepatic hyperammonemia. Platelets were independent of death among the patients with non-hepatic hyperammonemia, which is possibly attributed to severe infections, blood diseases, and other diseases.[8,9]
In univariate and multivariate competing risk models, there were a correlation Cr BUN and the death of patients with non-hepatic hyperammonemia. It is because renal function deteriorates, the excretion capacity of blood ammonia declines, and the urea level increases in the human body,[10] patients with poor kidney function and elevated BUN levels are more likely to cause non-hepatic hyperammonemia and more likely to die. Based on the results of univariate and multivariate analysis, it was considered that BUN was associated with poor renal function. In addition, it may be related to factors such as fasting, excessive protein intake, and other factors.[11] Unfortunately, this study failed to retrieve relevant information. HGB was identified as an independent risk factor for the death of patients with non-hepatic hyperammonemia. HGB reduction attributed to severe infection with patients and increased hemoglobin consumption was taken into consideration.[12] The infected patients were susceptible to non-hepatic hyperammonemia as confirmed by Yazan et al.[6] In addition, HGB reduction is speculated to be associated with gastrointestinal bleeding in patients. Gastrointestinal bleeding is one of the important factors leading to elevated blood ammonia levels.[13] A large amount of blood is broken down in the intestine to produce a large amount of ammonia; it is absorbed into the blood in the intestine. Therefore, patients with more serious infections and gastrointestinal bleeding have lower HGB levels, higher blood ammonia levels, worse conditions, and higher mortality rates. One of the most important research findings shows that ammonia was an independent risk factor for patient death. Besides, age was an independent prognostic factor for NHH patients. Through our further analysis, we found that the older the patient, the higher the serum ammonia level. Therefore, we need to strengthen the monitoring of serum ammonia levels in elderly patients. In this study, we created a simple intuitive graph of a statistical predictive model P1 based on the above five independent risk factors that quantified the risk of critically ill patients with NHH, and thereby may support clinicians when making treatment recommendations for patients. Ammonia into a prognostic model P1predict mortality in the patients with non-hepatic hyperammonemia better than SAPSII and qSOFA, the SAPS II score could provide valuable information on prognosis to patients than others, it was demonstrated by Hee et al in the study on the clinical implications of the initial SAPS II in veno-arterial extracorporeal oxygenation,[14] and the results of the study by chen Yufeng et al showed that the OR value and 95% CI of APACHE II in patients with non-hepatic hyperammonemia in the intensive care unit were 0.542 (0.369, 0.797).[15] However, we have found that the predictive power of model P1 for patients with non-hepatic hyperammonemia was significantly higher than SAPS II, and P1 showed the highest specificity of 81.0% in predicting mortality in patients with non-hepatic hyperammonemia in our research results.
Several limitations in the present study must be acknowledged. First, our study is retrospective in nature and bears the inherent limitations of such study design. For instance, the result shows a linkage between non-hepatic hyperammonemia and mortality, but the causal relationship of them cannot be determined based on the present study. Since there is no strong evidence indicating that the correction of lowering blood ammonia levels will improve clinical outcomes in critically ill patients, hyperammonemia may be a reflection of the severity of illness rather than the cause of death. It could be further verification by a prospective study cohort. Second, this is a single center study and the result may not be generalizable to other institutions. Third, as we included all critically ill patients for analysis, heterogeneity of the study population may arise.
5. Conclusion
In summary, ammonia was an independent prognostic predictor of mortality for patients in the intensive care unit. We have developed a novel nomogram for predicting the prognosis of critically ill patients with NHH. The nomogram is easy to use, is highly accurate. This nomogram might help clinicians to early assess of patient prognosis and give active and effective treatment measures to reduce patient mortality.
Author contributions
Yun Li, Qi Zhou, and Yi Sun contribute to the conception and design of the work; and interpret of data for the work. Jian-Nan Song, Xi-Zhe Zhang, and Xue-Zhao Chen revised the paper and made the final version of the paper with Yun Li, Qi Zhou, and Yi Sun.
Conceptualization: Yun Li, Qi Zhou, Yi Sun.
Data curation: Xue-Zhao Chen, Jian-Nan Song.
Formal analysis: Yi Sun.
Investigation: Yun Li, Yi Sun.
Methodology: Yun Li, Qi Zhou.
Software: Xue-Zhao Chen, Jian-Nan Song, Xi Zhe Zhang.
Supervision: Qi Zhou, Yi Sun.
Visualization: Qi Zhou, Jian-Nan Song, Xi Zhe Zhang.
Writing – original draft: Yun Li, Qi Zhou, Yi Sun.
Footnotes
Abbreviations: ALT = alanine aminotransferase, AST = aspartate aminotransferase, BUN = blood urea nitrogen, Cr = creatinine, DBP = diastolic blood pressure, HR = Heart rate (HR), ICU = intensive care unit, INR = international normalized ratio, LOS = length of hospital stay, NHH = non-hepatic hyperammonemia, PT = prothrombin time, PTT = partial thromboplastin time, qSOFA = quick sequential organ failure assessment, RR = respiratory rate, SAPSII = patients’ simplified acute physiology score, SBP = systolic blood pressure, T = temperature, WBC = white blood cell count.
How to cite this article: Li Y, Zhou Q, Song JN, Chen XZ, Zhang XZ, Sun Y. Analysis of clinical prognosis in patients with non-hepatic hyperammonemia. Medicine. 2021;100:3(e24157).
YL and QZ contributed equally to this work.
Ethical statements: This work has been performed according to the Code of Ethics of the World Medical Association (Declaration of Helsinki) and has been also approved by the ethical committee at the Chifeng Municipal Hospital.
The authors have no conflict of interest to disclose.
The datasets generated during and/or analyzed during the present study are available from the corresponding author on reasonable request.
ALB = albumin, ALT = alanine aminotransferase, AST = aspartate aminotransferase, Cr = creatinine, DBP = diastolic pressure, Glu = glucose, HGB = hemoglobin, HR = heart rate, LOS = length of hospital stay, PLT = platelets, qSOFA = quick sequential organ failure assessment score, RR = respiratory rate, SAPSII = simplified acute physiology II score, SBP = systolic pressure, Tbil = total bilirubin.
ALB = albumin hemoglobin, ALT = alanine aminotransferase, AST = aspartate aminotransferase, Cr = creatinine, Glu = glucose, HGB = hemoglobin, PLT = platelets, Tbil = total bilirubin.
P1 = model incorporating ammonia, hemoglobin, platelet, bun, age. qSOFA = quick sequential organ failure assessment, SAPSII = simplified acute physiology II score.
References
- [1].Rekha C, Phanidhar S, Sagar AV, et al. Role of Helicobacter pylori and hyperammonemia in subclinical hepatic encephalopathy in cirrhosis of liver. Indian J Clin Biochem 2007;22:136–9. [DOI] [PMC free article] [PubMed] [Google Scholar]
- [2].Prado FA, Delfino VD, Grion CM, et al. Hyperammonemia in ICU patients: a frequent finding associated with high mortality. J Hepatol 2015;62:1216–8. [DOI] [PubMed] [Google Scholar]
- [3].Larangeira AS, Tanita MT, Dias MA, et al. Analysis of cerebral blood flow and intracranial hypertension in critical patients with non-hepatic hyperammonemia. Metab Brain Dis 2018;33:1335–42. [DOI] [PubMed] [Google Scholar]
- [4].Pham AQ, Reagan JL, Castillo JJ. Multiple myeloma-induced hyperammonemic encephalopathy: an entity associated with high in-patient mortality. Leuk Res 2013;37:1229–32. [DOI] [PubMed] [Google Scholar]
- [5].Zaccara G, Campostrini R, Paganini M, et al. Long-term treatment with sodium valproate: monitoring of venous ammonia concentrations and adverse effects. Ther Drug Monit 1987;9:34–40. [DOI] [PubMed] [Google Scholar]
- [6].Numan Y, Jawaid Y, Hirzallah H, et al. Ammonia vs. lactic acid in predicting positivity of microbial culture in sepsis: the ALPS pilot study. J Clin Med 2018;7:182. [DOI] [PMC free article] [PubMed] [Google Scholar]
- [7].Bordin EH. Blood ammonia determination as a diagnostic tool in the differentiation of upper gastrointestinal bleeding. Gastroenterology 1959;37:457–9. [PubMed] [Google Scholar]
- [8].Span AHM, Dam-Mieras MCE, Mullers W, et al. The effect of virus infection on the adherence of leukocytes or platelets to endothelial cells. Eur J Clin Invest 2008;21:331–8. [DOI] [PubMed] [Google Scholar]
- [9].Tomczynska M, Salata I, Bijak M, et al. The potential contribution and role of a blood platelets in autoimmune thyroid diseases. J Cell Mol Med 2018;22:6386–90. [DOI] [PMC free article] [PubMed] [Google Scholar]
- [10].Watford M, Lane SF, Hogue DE. The synthesis of glucose and ammonia by kidney tubules isolated from suckling and early-weaned lambs. Comp Biochem Physiol B 1987;86:689–91. [DOI] [PubMed] [Google Scholar]
- [11].Courtenay ES, Capp MW, Record MT. Thermodynamics of interactions of urea and guanidinium salts with protein surface: relationship between solute effects on protein processes and changes in water-accessible surface area. Protein Sci 2009;10:2485–97. [DOI] [PMC free article] [PubMed] [Google Scholar]
- [12].Yang L, Sun Y, Li G, et al. Is hemoglobin A1c and perioperative hyperglycemia predictive of periprosthetic joint infection following total joint arthroplasty?: a systematic review and meta-analysis. Medicine 2017;96: [DOI] [PMC free article] [PubMed] [Google Scholar]
- [13].Tomizawa M, Shinozaki F, Hasegawa R, et al. Patient characteristics with high or low blood urea nitrogen in upper gastrointestinal bleeding. World J Gastroenterol 2015;21:7500–5. [DOI] [PMC free article] [PubMed] [Google Scholar]
- [14].Lee HS, Kim HS, Lee SH, et al. Clinical implications of the initial SAPS II in veno-arterial extracorporeal oxygenation. J Thorac Dis 2019;11:68–83. [DOI] [PMC free article] [PubMed] [Google Scholar]
- [15].Chen Y, Zhang Y, Zhu Q, et al. Analysis of the occurrence and prognosis of non-hepatic hyperammonemia in the intensive care unit. Medicine 2019;11:11. [Google Scholar]


