

Abstract
Purpose
To better define the contributions of somatosensory and auditory feedback in vocal motor control, a laryngeal perturbation experiment was conducted with and without masking of auditory feedback.
Method
Eighteen native speakers of English produced a sustained vowel while their larynx was physically and externally displaced on a subset of trials. For the condition with auditory masking, speech-shaped noise was played via earphones at 90 dB SPL. Responses to the laryngeal perturbation were compared to responses by the same participants to an auditory perturbation experiment that involved a 100-cent downward shift in fundamental frequency (f o). Responses were also examined in relation to a measure of auditory acuity.
Results
Compensatory responses to the laryngeal perturbation were observed with and without auditory masking. The level of compensation was greatest in the laryngeal perturbation condition without auditory masking, followed by the condition with auditory masking; the level of compensation was smallest in the auditory perturbation experiment. No relationship was found between the degree of compensation to auditory versus laryngeal perturbations, and the variation in responses in both perturbation experiments was not related to auditory acuity.
Conclusions
The findings indicate that somatosensory and auditory feedback control mechanisms work together to compensate for laryngeal perturbations, resulting in the greatest degree of compensation when both sources of feedback are available. In contrast, these two control mechanisms work in competition in response to auditory perturbations, resulting in an overall smaller degree of compensation.
Supplemental Material
Current computational models of speech motor control divide processes, including those responsible for the control of voice, into several distinct control subsystems. For example, the directions into velocities of articulators (DIVA) model of speech production (Guenther, 2016; Guenther et al., 2006) specifies three main components of speech motor control: feedforward control, auditory feedback control, and somatosensory feedback control. According to the model, vocalization begins with the readout of a set of learned targets that are sent to the three controllers. The feedforward controller then sends motor commands to the speech articulators as specified in the “motor target.” The motor target is a time series of articulator positions and velocities that move the articulators to produce the acoustic signal for the vocalization. As the vocalization occurs, the auditory feedback controller compares the “auditory target” to auditory feedback and, if an error is detected, sends a corrective command to the speech articulators. Finally, the somatosensory feedback controller compares the “somatosensory target” to the current somatosensory state of the vocal tract and sends corrective commands if the configuration deviates from the target. Although details in implementation differ, a similar division of motor control processes into feedforward, auditory feedback, and somatosensory feedback processes is inherent to the State Feedback Control model (Houde & Nagarajan, 2011), Hierarchichal State Feedback Control model (Hickok, 2012), and Feedback-Aware Control of Tasks in Speech model (Parrell et al., 2019).
The current study aims to characterize the contributions of the auditory and somatosensory feedback control subsystems to the control of voice. One commonly used method of probing the role of feedback control during vocalization is to unpredictably perturb a speaker's sensory feedback on a certain percentage of production trials and observe the subsequent changes in voice output to these perturbations compared to unperturbed trials. For example, auditory feedback has been perturbed by shifting the fundamental frequency (f o) of a participant's voice (associated with the auditory perception of pitch) played back to them via headphones in near real time via a digital signal processing system or computer. This unexpected artificial shift in perceived f o elicits a compensatory response to oppose the change so that their auditory feedback more closely matches the intended target (Burnett et al., 1998; Burnett et al., 1997; Larson et al., 2000).
Similarly, it's possible to apply a perturbation in the somatosensory domain (i.e., by perturbing the speech articulators). It is useful to consider the differential effects, in terms of auditory and somatosensory feedback control mechanisms, of applying a somatosensory perturbation versus applying an auditory perturbation in the models referenced above. When the position of a speech articulator is perturbed, both the articulator's position and the corresponding acoustic signal are moved away from their target values, leading to auditory and somatosensory error signals that are consistent with each other, causing both the auditory and somatosensory feedback controllers to counteract the perturbation in a cooperative fashion. In contrast, when a perturbation is applied only to the auditory signal, an auditory error is heard, but the somatosensory system senses no error at first since the articulators remain in the correct positions. The auditory feedback controller sends motor commands that correct the perceived auditory error, but these movements have the effect of moving the articulators away from their desired positions. In response, the somatosensory feedback controller generates motor commands that attempt to move the articulators back to where they were before the auditory feedback controller caused them to deviate from their target positions. In other words, when an auditory perturbation is applied, the somatosensory feedback controller's commands are in competition with the auditory feedback controller's commands, contrasting with the cooperation between these two feedback controllers when a somatosensory perturbation is applied.
As a result of these interactions, the responses to auditory perturbations rarely result in complete compensation, with participants typically achieving approximately 15%–50% compensation of an f o perturbation (Bauer & Larson, 2003; Larson et al., 2000; Liu & Larson, 2007). According to the DIVA model (and consistent with the State Feedback Control, Hierarchical State Feedback Control, and Feedback-Aware Control of Tasks in Speech models), the incomplete compensation seen in auditory perturbation experiments is due to the somatosensory feedback controller counteracting the compensatory behavior of the auditory feedback controller. For example, if the auditory feedback controller detects that f o is higher than the intended target, it will send corrective commands to lower f o. The somatosensory feedback controller will then detect that the adjusted configuration of the larynx is producing an f o lower than intended and will send motor commands to raise the speaker's f o, thereby partially counteracting the compensatory adjustments made by the auditory feedback controller. This idea was supported by an investigation by Larson et al. (2008) that examined vocal responses to auditory perturbations when applying anesthesia to the vocal folds relative to normal kinesthesia and found stronger compensatory responses when the vocal folds were anesthetized. The results from auditory feedback perturbation paradigms thus reflect a combination of competing auditory and somatosensory feedback control mechanisms.
The partial compensation seen in auditory perturbation experiments contrasts with the near-complete compensation often seen in response to physical perturbations of the larynx, which we will term “laryngeal perturbations.” To our knowledge, only two experiments to date have examined f o responses to laryngeal perturbations (Loucks et al., 2005; Sapir et al., 2000). In both of these studies, investigators used laryngeal perturbations to examine somatosensory feedback mechanisms during sustained vowel production. When the mechanical perturbation was applied to the larynx, f o rapidly decreased (stimulus response) and then gradually increased toward the speaker's baseline f o (compensatory response). In comparison to the auditory perturbation paradigm, compensation was closer to complete (66%–75%) in response to these laryngeal perturbations. According to the models described above, this correction is again a combination of the auditory and somatosensory feedback controllers, but, in this case, working in tandem since the f o error perceived through audition is in the same direction as the f o error perceived through somatosensation. In both of these studies, the change in f o was audible to the participant, so it is impossible to dissociate the roles of these two feedback control subsystems in correcting for physical perturbations of the larynx.
Further support for the interaction between auditory and somatosensory feedback control comes from studies of sustained perturbations (i.e., sensorimotor adaptation tasks). Katseff et al. (2011) examined the effect of increasing the magnitude of a formant perturbation on the degree of compensation and showed a greater degree of compensation for small shifts in compared to large shifts. The decreasing compensation was interpreted as a trade-off between auditory and somatosensory feedback control—a larger weighting placed on auditory feedback control for small discrepancies between auditory and somatosensory feedback and a larger weighting on somatosensory feedback control for large discrepancies. Another study examined both auditory and somatosensory perturbations in the same group of participants and showed that individuals seemed to have a stable preference for either auditory or somatosensory feedback (Lametti et al., 2012). Specifically, participants completed blocks of a word production task, during which their feedback was artificially shifted through auditory feedback (formant shifts heard in earphones), somatosensory feedback (physical displacement of the jaw), or a combination of the two. The results showed that individuals responded strongly to one feedback perturbation modality while simultaneously responding less strongly to the other. However, both of these studies were performed in articulatory (formant) space and with sustained perturbations designed to elicit sensorimotor adaptation, which are more suited to understanding speech (as opposed to voice) and feedforward control (vs. feedback control). It is unclear if individuals will also show a trade-off between or a preference for feedback modalities in the context of unexpected perturbations in vocal motor control.
Several current models of speech motor control (Guenther, 2016; Hickok, 2012; Houde & Nagarajan, 2011; Parrell et al., 2019) predict that speakers with finer acuity have a smaller acceptable target range for feedback and therefore are more likely to detect and correct for errors when feedback is perturbed. Although some past sensorimotor adaptation studies have found significant correlations between auditory acuity and adaptive responses to formant perturbations (e.g., Martin et al., 2018; Villacorta et al., 2007), there are others that have not (Abur et al., 2018; Feng et al., 2011). Furthermore, to the best of our knowledge, only one prior study reported examining the same relationship for within-trial reflexive responses to formant perturbations and found no relationship (Cai et al., 2012), and no other published studies have explored the relationship between auditory acuity and reflexive responses to perturbations of f o.
The current study aims to dissociate the roles of auditory and somatosensory feedback control systems in laryngeal perturbation studies by investigating responses to laryngeal perturbations under conditions with and without auditory feedback masking. By eliminating auditory feedback, the former condition isolates the contribution of somatosensory feedback control mechanisms to the compensatory response to the perturbation. Furthermore, we measured auditory acuity as well as responses to a purely auditory perturbation of f o in the same participants to compare and contrast responses by the auditory and somatosensory feedback subsystems. Laryngeal perturbations (Experiment 1) were delivered by a pneumatic device that displaced the larynx during a sustained vowel task, which had the effect of reducing participants' f o. Auditory perturbations (Experiment 2) were also applied in a sustained vowel task and were characterized by a downward shift in f o that approximately matched the acoustic effect of the laryngeal perturbation. Together, these experiments were used to examine (a) the magnitude of responses to laryngeal perturbations (with and without access to auditory feedback), (b) the timing of responses to laryngeal perturbations (with and without access to auditory feedback), (c) the relationship between the magnitude of responses to laryngeal and auditory perturbations, and (d) the relationship between auditory acuity and responses to perturbations in both sensory domains. Based on the theoretical considerations outlined above, we hypothesized that masking auditory feedback during laryngeal perturbations would result in smaller compensatory responses compared to the condition without auditory masking, since the former involves only somatosensory feedback control mechanisms, whereas the latter involves both the auditory and somatosensory feedback control mechanisms working in tandem. In addition, we expected that auditory perturbations would be associated with smaller compensatory responses relative to both laryngeal perturbation conditions since, in the auditory perturbation condition, the auditory and somatosensory feedback controllers effectively compete with each other. Finally, we hypothesized that auditory acuity would be positively correlated with the magnitude of compensatory responses in both the laryngeal perturbation (with normal auditory feedback) and auditory perturbation experiments since higher auditory acuity should allow better detection of deviations of the auditory signal induced by the perturbations.
Method
Participants
Eighteen participants (11 women, seven men) between the ages of 18 and 34 years (M = 22.4, SD = 3.8) took part in this study. All participants were native English speakers and had no history of speech, language, hearing, voice, or neurological disorders. Participants were not included if they had received more than 1 year of tonal language instruction. Furthermore, participants were not included if they had significant formal singing training, operationally defined as receiving more than 5 years of singing instruction before the age of 18 years and/or more than 2 years of singing instruction after the age of 18 years. All participants passed a hearing screening using pure-tone audiometry at 25 dB HL for frequencies ranging from 250 to 4000 Hz bilaterally. All participants provided written informed consent in accordance with the Boston University Institutional Review Board.
Equipment
Figure 1 shows the setup of the experimental equipment. The experiments were conducted in a soundproof booth (Eckel C-14) with participants seated at a desk facing a computer monitor (Dell 2009wt) and a keyboard. The monitor was used to provide visual stimuli for trial progression and to present visual feedback about participants' loudness levels during the perturbation experiments. A MOTU Microbook IIc was the interface by which audio signals were provided to and received from participants. Two Behringer Mixers (UB802) were used as amplifiers for the microphone and headphone signals independently before returning to the MOTU (microphone) or reaching the participant (headphones). All trial progression and data collection were controlled from a custom MATLAB (Mathworks, 2017) script on the experimental computer. The Audapter toolbox (Cai et al., 2008; Tourville et al., 2013) was used in conjunction with the MATLAB script to handle the audio input and output from the MOTU (collected at 48-kHz sampling rate).
Figure 1.
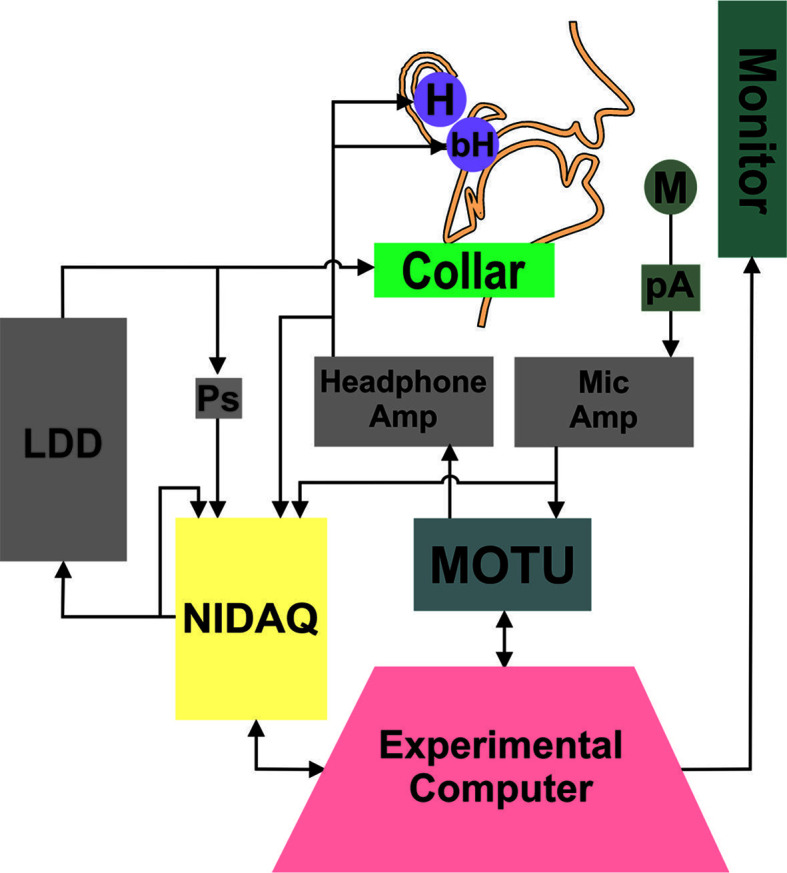
Diagram of experimental setup. The experimental computer presented the visual stimuli and feedback during the trial, triggered the perturbation, and recorded the behavioral voice data. The MOTU soundcard handled the input and output of audio signals, and the NIDAQ provided the signal to inflate and deflate the LDD. The NIDAQ recorded the trigger signal sent to the LDD, as well as the amplified microphone and headphone signals. M = microphone, pA = preamplifier, H = insert earphones, bH = bone-conduction headphones, LDD = laryngeal displacement device, Ps = pressure sensor.
Participants wore a lapel microphone (Shure SM93) affixed to their shirt, roughly 6 in. below their mouth. The microphone signal was preamplified with an in-line preamplifier and then additionally amplified by the Behringer mixer. Auditory feedback was presented to the participants using two sets of headphones—a set of insert earphones (Etymotic ER-1) and a set of bone-conduction headphones (AfterShokz AS401). The type of auditory feedback played to participants varied by experiment. Under normal feedback conditions (without auditory masking), the insert earphones played the participant's voice 5 dB higher than produced to reduce the perception of the participant's own unperturbed acoustic signal. No signal was presented via the bone-conducting headphones in the condition without auditory masking. The approximate total system latency (i.e., the delay between microphone and earphones due to experimental hardware and signal processing; Kim et al., in press) ranged from 29 to 47 ms. When auditory feedback was masked, they heard speech-shaped masking noise played in both the insert earphones (90 dB SPL) and the bone-conduction headphones. The bone-conduction headphones were added to the setup to minimize the degree to which participants may perceive changes in their voice via bone conduction. For example, previous studies have shown a relatively equal contribution of air and bone conduction to the perception of one's own voice and that voiced sounds (as in the current study) have larger bone-conducted contributions than unvoiced sounds (Pörschmann, 2000; von Békésy, 1949). The insert earphones and microphone were calibrated using the Brüel & Kjᴂr sound level meter (Type 2250). Because calibration of the bone-conduction headphones in dB SPL was not feasible, masking noise presented via the bone-conduction headphones was set to a level that was deemed by pilot participants to effectively mask any residual voice signal without causing discomfort.
Laryngeal perturbations were delivered via a custom-fabricated device, the “laryngeal displacement device” (LDD), which physically displaced the position of the larynx by applying a dorsally aimed force. A National Instruments Data Acquisition card (NIDAQ; NI USB-6212 [BNC]) was used to trigger the LDD and record time-aligned pressure, microphone, and headphone signals. The LDD consisted of a rigid plastic collar held in place over the larynx via an elastic cord that was adjusted to provide a snug but comfortable fit (see Supplemental Material S1). Force was applied to the larynx by rapidly inflating a semirigid balloon embedded in the collar, with the balloon placed directly on the laryngeal prominence. On perturbed trials, the balloon was inflated rapidly (mean rise time = 178 ms, SD = 9 ms) via a computer-controlled external air pump, thereby displacing the thyroid cartilage. Inflating the balloon against the larynx had the effect of lowering participants' f o. To ensure that the larynx did not simply rebound to its normal position immediately after perturbation onset but instead remained displaced throughout the perturbation, laryngoscopy was used to track gross movement of the larynx during perturbations in five participants. Analysis of the resulting videos verified that the gross displacement of the larynx caused by onset of the perturbation was maintained throughout the duration of the perturbation (see Supplemental Material S1 for further details). The pressure of the balloon was recorded with an in-line pressure sensor (Panasonic ADP5131), with a mean pressure of 4.19 psi at full perturbation across participants (SD = 0.23 psi). The perturbation was removed by rapidly reversing the flow of air in the pump, thereby deflating the balloon (mean fall time = 250 ms, SD = 43 ms).
Baseline Voice Recording
The study began with baseline recordings of the participant's normal speaking voice. For these recordings, participants wore only the lapel microphone and produced three trials of /i/, sustaining the vowel for 4 s. They were instructed to maintain a steady pitch and loudness in their comfortable speaking voice. The baseline recordings were used to create tokens for the f o acuity estimation task and to set the target sound pressure level for the experimental trials. Following the baseline recordings, participants were fitted with the LDD, insert earphones, and bone-conduction headphones.
f o Acuity Estimation
Participants performed four runs of an adaptive staircase just-noticeable-difference (JND) task to measure their f o acuity. The task type chosen was an AXB task, in which they were instructed to identify whether a perceptual token X was different than either token A or token B (Macmillan & Creelman, 2005; McGuire, 2010). An automated Praat script generated 400 voice tokens per participant by shifting the f o of the participant's baseline voice recording. The shifts in f o ranged from − 100 cents to + 100 cents (in steps of 0.5 cents) from the baseline f o. During each trial of a run, participants were presented with three 0.5-s tokens (interstimulus interval = 0.5 s). The first and last tokens of the run were different in their value of f o, but equidistant from the baseline f o, separated by a testing distance. For example, if the testing distance was 50 cents, the first and last tokens would be 25 cents above and 25 cents below the baseline f o (or vice versa). The middle token was always identical to either the first or the last token. Participants were instructed to identify which token was different in pitch from the middle token; either the first or the last. Participants made their selection using the arrow keys on the keyboard. No more than three trials of a position type (first/last) were presented in a row. Furthermore, no more than three trials of a direction type (first token above/below baseline f o) were presented in a row. Participants were not given a time limit to select an answer for the trial; the next trial began 1 s after they made a selection.
At the beginning of a run, a testing distance of 50 cents and a 1-up 1-down adaptive staircase paradigm were used. These starting conditions were chosen during pilot testing to reduce the time it took for a participant to reach their JND threshold. After each correct response, the distance between nonmatching tokens was decreased by 10 cents. After an incorrect response, the distance was increased by 10 cents. This paradigm allowed the participant to reach their approximate threshold rapidly. Following the first incorrect response, the task switched to a 2-down 1-up paradigm (two correct responses needed before increasing task difficulty) and the step distance increased or decreased by 4 cents. If participants reached a testing distance below 10 cents, the task still operated on a 2-down 1-up paradigm, but the step distance was further reduced to 1 cent. A “reversal” was defined as a change from an increasing to decreasing JND (based on the accuracy of the participant's responses) or vice versa. The run concluded following 10 reversals or after 100 trials, whichever occurred first. For a given run, the JND score was calculated as the mean of the distance for the last four reversals. This score was then averaged across the four runs to produce the participant's estimate of f o acuity.
Experiment 1: Laryngeal Perturbation
In the first experiment, participants completed a laryngeal perturbation paradigm in which they vocalized the vowel /i/ over multiple trials while they had their larynx physically and noninvasively displaced by the LDD. The paradigm was conducted under two auditory feedback conditions: (a) without auditory masking, in which participants could hear their own voice as they vocalize; and (b) with auditory masking, in which participants had their auditory feedback masked by speech-shaped noise as described above.
Participants completed four practice trials to become familiar with the masking noise and laryngeal perturbation. Participants then completed four experimental runs of 40 trials each, with short breaks in between. On 10 of the 40 trials (pseudorandomly distributed), the LDD was activated, with no consecutively perturbed trials. The frequency of perturbation trials (25%) was chosen to minimize the likelihood of participants anticipating or adapting to the perturbation. Previous studies employing somatosensory perturbations (typically of the jaw) have used frequencies ranging from 10% to 22% of trials for this purpose (Abbs & Gracco, 1984; Golfinopoulos et al., 2011). In each run, participants were provided with auditory feedback in one of the two conditions for a total of two runs per condition. The run order was arranged such that no two runs of the same condition were presented in sequence, and the arrangement of run order was counterbalanced across participants.
Figure 2 shows the time course of a single perturbed trial. The trial progression was presented to the participant on the computer monitor. Each trial began with a 1-s cue period, marked by a “+” on the screen, instructing the participant to prepare to vocalize. Following this period, the “+” disappeared and was replaced by the letters “eee,” which was an instruction to vocalize and sustain the vowel /i/ for 4.8 s (vocalization period) using a comfortable loudness and pitch. Onset of the perturbation was randomly jittered between 1.8 and 2.3 s after the start of the vocalization period, and the perturbation lasted for a random duration between 1.0 and 1.5 s. Both of these randomization procedures were implemented to reduce the predictability of the perturbation. The resulting distribution of perturbation onset times and durations were comparable across participants and conditions. Furthermore, the mean onset times (with auditory masking: 2.06 ± 0.02; without auditory masking: 2.05 ± 0.03) and durations (with auditory masking: 1.26 ± 0.04; without auditory masking: 1.26 ± 0.04) did not differ significantly by condition: onset time, t(15)= −0.32, p = .755, and duration, t(15) = −0.24, p = .812. Unperturbed trials were identical to perturbed trials except that no perturbation was applied. As the letters “eee” disappeared from the screen, participants were instructed to stop vocalizing, and they then received a 2-s rest period. During the rest period, they were given visual feedback about their sound pressure level that pertained to the just-completed vocalization. Feedback was not provided during the vocalization to minimize the cognitive/attentive demands of the task. The feedback was in the form of a colored bar on the computer monitor. The height of the bar translated to the root mean square of the current acoustic recording, compared to the mean root mean square of the baseline recordings. As long as the participant vocalized a trial within ± 3 dB of their target (baseline) sound pressure level, the bar was green and had a height that terminated in a target area on the screen delineated by two horizontal lines. Any greater or lower sound pressure level value resulted in a red bar that terminated above or below the target area. Participants were instructed to use this feedback to adjust their sound pressure level from trial to trial to match the target, therefore preventing drift in loudness over the course of the experiment.
Figure 2.

Epoch of a trial. Visual feedback showed the sound pressure level of the participant's voice during the trial, compared to their target baseline sound pressure level.
Experiment 2: Auditory Perturbation
In the second experiment, participants completed an auditory perturbation paradigm in which the f o of their production was altered as they vocalized. This experiment immediately followed the first experiment. The collar was not removed between experiments but was loosened and allowed to rest on the participant's chest. Auditory feedback of the participant's own voice was presented through the insert earphones only, and the bone-conduction headphones were powered off.
The auditory perturbation experiment was designed to match the laryngeal perturbation experiment as closely as possible. Participants completed two runs (40 trials each) of the auditory perturbation experiment. As in Experiment 1, the trial progression was presented to the participant on the computer monitor. Each trial began with a 1-s cue period, marked by a “+” on the screen, instructing the participant to prepare to vocalize. Following this period, the “+” disappeared and was replaced by the letters “eee,” which was an instruction to vocalize and sustain the vowel /i/ for 4 s (vocalization period) using a comfortable loudness and pitch. Onset of the perturbation was randomly jittered between 1.0 and 1.5 s after the start of the vocalization period, and the perturbation lasted for a random duration between 1.0 and 1.5 s. Unperturbed trials were identical to perturbed trials, except that no perturbation was applied. As the letters “eee” disappeared from the screen, participants were instructed to cease vocalization, and they then received a 2-s rest period. As in Experiment 1, during 25% of trials, participants had the f o of their voice unexpectedly decreased by 100 cents. f o was only perturbed in a single direction for consistency with the laryngeal experiment, where it was not possible to induce an upward shift in f o using the LDD. The perturbation was a formant-adjusted shift that preserved the produced formants and only shifted f o. The perturbation was applied with a linear down ramp over a 110-ms period and was released with a linear up ramp of 150 ms. These ramp rates were chosen to approximately match those produced by the LDD inflation and deflation times, as determined in preliminary testing. The LDD inflation and deflation times recorded in Experiment 1 (inflation 178 ms, deflation 250 ms), however, differ slightly from the preliminary testing, likely due to changes in balloon volume that developed during LDD design iterations. Participants received visual feedback about their sound pressure level during the rest period in the same manner as in Experiment 1.
Acoustic Analysis
Compensatory responses to the laryngeal and auditory perturbations were determined by measuring the f o in hertz over each trial using Praat 1 (Version 6.0.43; Boersma & Weenink, 2018). Figure 3 shows exemplary normalized f o traces from a representative participant. These traces are the mean across perturbed trials from the laryngeal (see Figure 3A) and auditory (see Figure 3B) perturbation experiments. For the laryngeal perturbation experiment, the f o trace was extracted from the microphone signal, which captured the initial decrease in f o due to the perturbation as well as the participant's compensatory response (see Figure 3A). For the auditory perturbation experiment, the f o trace was extracted from the earphone signal, which captured the initial downward shift in f o heard by the participant in addition to their compensatory response (see Figure 3B). The raw audio recordings and extracted f o traces were manually inspected for issues with voice quality (e.g., vocal fry), time series errors (e.g. voice breaks), and loudness issues (e.g. low signal-to-noise ratio). A second automated quality assessment step was implemented in MATLAB to identify voice errors that produced pitch-tracking issues. Trials with any of these errors were excluded from further analysis (5% trials removed).
Figure 3.

Exemplary normalized fundamental frequency (f o) traces from the mean of perturbed trials for a single participant. Panel A shows the mean trace from the laryngeal perturbation experiment. Panel B shows the mean trace from the auditory perturbation experiment. In both panels, the 0 time point indicates the onset of the perturbation. Stimulus magnitude is the inverted difference between the orange square and the purple triangle. Response magnitude is defined as the difference in f o between the purple triangle and the green dot (mean value of f o within green area). Response percentage is the ratio of Response Magnitude/Stimulus Magnitude × 100%. Response latency is the time point at the purple triangle. All measures were calculated from the mean trace for each participant.
The baseline f o (f o_base) for each trial was found by taking the mean of the f o trace in the 500-ms period before perturbation onset. For the laryngeal perturbation, the onset was defined as the point in time when pressure in the balloon deviated from 0 psi, determined using an algorithm that detected a step function in the pressure signal. For the auditory feedback experiment, the onset time was defined as the point in time when the artificial f o shift was added to the earphones. This point was determined using an algorithm that detected a trigger signal from a NIDAQ channel meant to register the start of the artificial f o shift. Each f o trace was then normalized and converted to cents using f o_base as the reference frequency. The analysis window of interest was from 500 ms before to 1000 ms after the perturbation onset. The f o traces within this window for all trials within a condition were averaged for each participant. The following four measures were extracted from these mean trial traces to define the dynamics of the response (see Figure 3):
Stimulus magnitude (cents) captured the effect of the perturbation on the participant's f o and was measured as the inverted difference in cents from the value of f o at the perturbation onset to the minimum value of f o within the 200 ms following the perturbation onset. The 200-ms period following perturbation onset was chosen to detect the lowest point in the f o trace because participants in pilot testing reached the lowest point in the curve before the end of the rise time (laryngeal perturbation: M = 178 ms, SD = 9 ms; auditory perturbation: 110 ms). A minimum stimulus magnitude of 20 cents was required for the laryngeal perturbation experiment to determine that the perturbation was applied to the neck as intended. This threshold was met for all except two participants; both had all of their laryngeal perturbation response data removed from further analysis. Their data were retained for the auditory perturbation response results.
Response magnitude (cents) measured the participant's change in f o following the perturbation and was calculated as the difference in f o from the minimum value of f o within the 200 ms following perturbation onset to the mean value of f o between 800 and 1000 ms after perturbation onset. The 800–1000 ms time period represents a stable portion of the f o trace where participants were likely to have reached their maximum level of compensation for the stimulus.
Response percentage (%) captured the amount the participant was able to recover their f o_base following the onset of the perturbation and was measured as the ratio between response magnitude and stimulus magnitude ().
Response latency (seconds) captured how quickly the participant began compensating for the perturbation. Response latency was estimated as the time at the minimum value of the f o trace within 200 ms relative to the perturbation onset.
Statistical Analysis
All statistical analyses were conducted using MATLAB 2019a and significance was assessed at an alpha level of .01 to account for multiple analyses. Parametric test assumptions were assessed for all models. If the assumption of normality was not met, data were transformed using the Box–Cox transformation to approximate normality (Box & Cox, 1964; Osborne, 2010). If nonnormality remained or if other assumptions were not met, nonparametric equivalent tests were used and specified in the Results section below.
Three sets of analyses were conducted. The first set of analyses explored the effects of potential confounds on the data to determine whether or not covariates should be included in subsequent analyses. A potential confound when comparing responses to perturbations with and without auditory masking is that an individual's baseline f o may differ in the presence of masking noise due to the Lombard effect (Gramming et al., 1988; Lombard, 1911). Differences in f o_base (Hz) prior to conversion to cents were examined across conditions (laryngeal perturbation conditions with and without auditory masking, auditory perturbation experiment) using a one-way repeated-measures analysis of variance (rmANOVA). Another potential confound is an order effect, where participants begin to adapt to perturbations as the experiment progresses. This potential confound was examined using a split-half analysis for each variable (stimulus magnitude, response magnitude, response percentage, response latency) in each condition (laryngeal perturbation conditions with and without auditory masking, auditory perturbation experiment). The data from the perturbed trials collected in the first run of a given condition were compared to those collected in the second run using a series of paired t tests.
The second set of analyses compared responses to the laryngeal and auditory perturbation experiments. The effect of condition (laryngeal perturbation conditions with and without auditory masking, auditory perturbation experiment) on stimulus magnitude, response magnitude, response percentage, and response latency were evaluated using a series of one-way rmANOVAs (one per dependent variable). f o acuity was included as a covariate of noninterest to account for between-subjects differences in auditory acuity. As one participant had an f o acuity measure > 3 SDs above the mean, their data were excluded from the analyses. Sphericity was assessed using Mauchly's Test of Sphericity and, when violated, a Greenhouse–Geisser correction was used (Greenhouse & Geisser, 1959). Significant condition effects were further evaluated using pairwise comparisons (Tukey's honestly significant differences) of the adjusted means that accounted for f o acuity. Effect sizes based on the marginal means between conditions were estimated to capture the magnitude of significant effects (Cohen, 1988).
The final set of analyses examined whether the level of compensation in the laryngeal and auditory perturbation experiments were related to each other or to f o acuity. Specifically, a series of Pearson correlations were used to assess the relationships between the following pairs of variables across participants: (a) response percentage in the laryngeal perturbation experiment (with auditory masking) and response percentage in the auditory perturbation experiment, (b) the contribution of auditory feedback to the laryngeal perturbation response (calculated as the difference in response percentage recorded for each participant in the two laryngeal perturbation conditions) and f o acuity, and (c) response percentage in the auditory perturbation experiment and f o acuity. The analyses involving f o acuity were conducted both with and without the outlier (> 3 SDs above the mean).
Results
Examining Potential Confounds in the Data
Figure 4 shows f o_base across all three perturbation conditions. A Friedman ANOVA (used due to nonnormality in the data) did not reveal a significant difference in f o_base between conditions, χ2(2) = 1.63, p = .444; these data were therefore not included as a covariate in subsequent analyses.
Figure 4.

Box plots of baseline fundamental frequency (f o) in the laryngeal perturbation conditions with and without auditory masking and in the auditory perturbation experiment. On a given box plot, the red line represents the median value, the box ranges from the first to the third quartile, and the whiskers span data points within the 1.5 interquartile range.
Table 1 shows the summary and inferential statistics for the split-half analyses comparing all four dependent variables measured in the first and second experimental runs of each condition. None of the analyses showed significant differences (i.e., adaptation) in measures between the first and second runs. The order of runs was not included as a covariate in later analyses.
Table 1.
Mean, standard deviation, and paired t-test results of the split-half analysis comparing dependent variables measured in the first and second experimental runs of each condition.
| Condition | Stimulus magnitude (cents) |
Response magnitude (cents) |
Response percentage (%) |
Response latency (s) |
||||||||
|---|---|---|---|---|---|---|---|---|---|---|---|---|
| Run 1 | Run 2 | Statistics | Run 1 | Run 2 | Statistics | Run 1 | Run 2 | Statistics | Run 1 | Run 2 | Statistics | |
| Laryngeal perturbation: without masking | 84.13 (60.48) | 67.61 (45.93) | t(15) = 2.24, p = .041 | 76.36 (53.28) | 60.28 (35.32) | t(15) = 2.04, p = .060 | 93.77 (18.75) | 95.60 (32.79) | t(15) = −0.22, p = .830 | 0.09 (0.03) | 0.09 (0.02) | Z = 1.97, p = .048 |
| Laryngeal perturbation: with masking | 96.47 (57.79) | 91.49 (54.88) | t(15) = 0.53, p = .607 | 72.45 (42.86) | 70.35 (37.81) | t(15) = 0.26, p = .797 | 73.86 (19.56) | 79.64 (15.33) | t(15) = −1.07, p = .301 | 0.10 (0.03) | 0.10 (0.02) | Z = 0.70, p = .485 |
| Auditory perturbation | 102.97 (5.66) | 101.97 (12.58) | t(17) = 0.30, p = .771 | 50.76 (21.78) | 45.59 (22.31) | t(17) = 1.60, p = .128 | 49.19 (20.93) | 44.43 (20.83) | t(17) = 1.63, p = .120 | 0.17 (0.03) | 0.16 (0.02) | t(17) = 1.01, p = .327 |
Note. Values reported are the across-participant mean (standard deviation). Where Z statistics are reported, the Wilcoxon-signed rank test was used due to nonnormality of the data distribution.
Comparing Responses to Laryngeal and Auditory Perturbations
Figure 5 shows the mean normalized f o traces (across 16 participants) by condition from the laryngeal perturbation experiment, centered at the onset of the perturbation. Figure 6 shows mean normalized f o traces (across 18 participants) by condition in the auditory perturbation experiment, centered at the onset of the perturbation. Traces from both the microphone and earphone signals are included to illustrate their correspondence (with the addition of the perturbation in the earphone signal); the measures, however, were extracted from the earphone signal only. Table 2 summarizes the four dependent variables by condition that were extracted from the normalized f o traces.
Figure 5.

(A) Mean participant fundamental frequency (f o) traces by condition (black = control, blue = without auditory masking, red = with auditory masking) at the onset of the laryngeal perturbation. Error bounds are the 95% confidence interval. The dotted orange trace is the mean pressure inside the balloon during all perturbed trials (both conditions). (B) A zoomed-in view to highlight the time period when the traces from the two perturbed conditions begin to diverge.
Figure 6.

Mean participant fundamental frequency (f o) traces by condition (black = control, blue = shifted) at the onset of the auditory perturbation. The shifted condition is shown as produced in the microphone signal and heard through the earphones (i.e., f o produced plus the perturbation). The shaded error bounds are the 95% confidence interval. The dotted orange trace represents the level that f o was artificially shifted in the earphones during perturbed trials.
Table 2.
Mean and standard deviation of the dependent variables measured at the onset of the perturbation in the laryngeal and auditory perturbation experiments.
| Condition | Stimulus magnitude (cents) | Response magnitude (cents) | Response percentage (%) | Response latency (s) |
|---|---|---|---|---|
| Laryngeal perturbation: without masking | 74.91 (51.95) | 67.34 (42.51) | 95.34 (19.61) | 0.09 (0.02) |
| Laryngeal perturbation: with masking | 91.52 (53.31) | 68.79 (37.23) | 75.96 (14.94) | 0.10 (0.02) |
| Auditory perturbation | 101.30 (6.25) | 46.83 (20.65) | 46.02 (19.99) | 0.17 (0.02) |
Note. Values reported are the across-participant mean (standard deviation).
Stimulus Magnitude
Data were Box–Cox transformed to approximate normality and the Greenhouse–Geisser correction was used to address violations of sphericity. An rmANOVA showed no significant difference in stimulus magnitude across conditions when controlling for f o acuity, F(2, 26) = 4.09, p = .058, ŋp 2 = .24.
Response Magnitude
Data were Box–Cox transformed to approximate normality and the Greenhouse–Geisser correction was used to address violations of sphericity. An rmANOVA showed no significant difference in response magnitude across conditions when controlling for f o acuity, F(2, 26) = 2.63, p = .122, ŋp 2 = .17.
Response Percentage
On average, participants compensated for 95% of the perturbation in the laryngeal perturbation condition without auditory masking, 76% in the laryngeal perturbation condition with auditory masking, and 46% in the auditory perturbation condition (see Figure 7). An rmANOVA revealed a significant effect of condition on response percentage, F(2, 26) = 11.54, p < .001, ŋp 2 = .47, when controlling for f o acuity. Follow-up analyses showed significant differences in response percentage between all three conditions, when controlling for f o acuity (laryngeal perturbation without auditory masking > laryngeal perturbation with auditory masking, p = .004, d = −1.25; laryngeal perturbation without auditory masking > auditory perturbation, p < .001, d = −2.77; laryngeal perturbation with auditory masking > auditory perturbation, p < .001, d = −1.80).
Figure 7.

Box plots of response percentage values recorded from the laryngeal perturbation conditions with and without auditory masking and the auditory perturbation experiment. On a given box plot, the red line represents the median value, the box ranges from the first to the third quartile, and the whiskers span data points within the 1.5 interquartile range (IQR). The “*” indicates significant differences (p < .001) between conditions, when controlling for fundamental frequency acuity.
Response Latency
Data were Box–Cox transformed to approximate normality and the Greenhouse–Geisser correction was used to address violations of sphericity. An rmANOVA showed no significant difference in response latency across conditions when controlling for f o acuity, F(2, 26) = 0.49, p = .533, ŋp 2 = .04.
Examining Relationships Among Levels of Compensation and f o Acuity
A correlation analysis examining the relationship between response percentage measured from the laryngeal perturbation condition with auditory masking and response percentage in the auditory perturbation experiment was not significant (r = .25, p = .354).
A correlation analysis between f o acuity and the effect of auditory feedback on response percentage (i.e., the difference between response percentage in the conditions with and without auditory masking) was not significant (r = −.16, p = .564). Rerunning the correlation analysis without the f o acuity outlier did not change the results (r = .33, p = .234). A final correlation analysis revealed no relationship between response percentage in the auditory perturbation experiment and f o acuity (with f o acuity outlier: r = −.18, p = .476; with f o acuity outlier removed: r = .23, p = .377).
Discussion
The current study used an unexpected perturbation paradigm to probe somatosensory and auditory feedback control during voice production. In the first experiment, physical perturbations of the larynx were applied under two conditions that varied the presence of auditory feedback, thus allowing dissociation of the contributions of somatosensory and auditory feedback control to the compensatory responses observed in this paradigm. A second experiment was conducted with the same participants using a purely auditory perturbation to allow comparisons of the compensatory responses to auditory versus laryngeal perturbations. The results revealed key features of the two feedback control processes during vocalization. Specifically, both auditory and somatosensory feedback control mechanisms were shown to contribute significantly to the magnitude of the compensatory response to a laryngeal perturbation. Furthermore, the magnitude of compensation varied as a function of perturbation modality, with the greatest compensatory response percentage observed in the laryngeal perturbation experiment when auditory feedback was available (95% compensation), a somewhat decreased response to the laryngeal perturbation when auditory feedback was unavailable (76% compensation), and an even smaller response when auditory feedback was perturbed (46%). All of the condition contrast effects were considered large (Cohen's d > 0.8; Cohen, 1988). Finally, the magnitude of compensation was not correlated between the two sensory domains, and the variation in responses across participants in neither production experiment was explained by f o acuity.
Auditory Feedback Control Contributes to Compensatory Response During Laryngeal Perturbations
Results of the laryngeal perturbation experiment demonstrated that participants were able to compensate to physical perturbations of the larynx, even when auditory feedback was masked. This finding provides clear evidence that the somatosensory feedback controller is involved in detecting and compensating for laryngeal perturbations. Previous laryngeal perturbation studies (Loucks et al., 2005; Sapir et al., 2000) did not isolate somatosensory feedback control since participants could hear their altered pitch when perturbations were applied in addition to sensing the effects of the perturbation through tactile and/or proprioceptive feedback. When auditory and somatosensory feedback were both available, participants compensated for 95% of the perturbation on average, compared to 76% when only somatosensory feedback was available—a difference that was statistically significant. To our knowledge, this is the first demonstration that both auditory and somatosensory mechanisms contribute to the compensatory response to a physical perturbation of the larynx during speech.
Interestingly, the mean f o trajectories for the laryngeal perturbation conditions with and without auditory masking are nearly identical until approximately 30 ms after perturbation onset. This (qualitative) observation is consistent with the finding from prior auditory feedback studies indicating that the auditory feedback controller's response to an auditory perturbation is delayed by approximately 100–150 ms from perturbation onset (Hain et al., 2000; Purcell & Munhall, 2006), compared to a response delay of approximately 25–75 ms for somatosensory feedback control (Abbs & Gracco, 1984; Ludlow et al., 1992). This is likely due to delays associated with neural processing of auditory feedback and transmission of corrective commands to the motor periphery (see Guenther, 2016, for a detailed review).
Percent Compensation for Laryngeal Perturbations Is Larger Than for Auditory Perturbations
As predicted by several current computational models of speech (Guenther, 2016; Hickok, 2012; Houde & Nagarajan, 2011; Parrell et al., 2019), the responses to the laryngeal perturbation (measured as a percentage of the perturbation magnitude) in conditions both with and without auditory masking were significantly larger than the response to the auditory perturbation. According to these models, this is because auditory and somatosensory feedback control compete with each other when an auditory perturbation is applied but not when a laryngeal perturbation is applied. More specifically, the models predict that the largest compensation should occur for the condition without auditory masking in the laryngeal perturbation experiment, when the two controllers act in concert to compensate for the perturbation. In this condition, participants achieved near-complete compensation (95% on average). The next largest compensation should occur for the condition with auditory masking in the laryngeal perturbation experiment, when only the somatosensory feedback controller contributes to compensation; this condition yielded an average compensation of 76% in Experiment 1. Finally, the smallest compensation should occur for the auditory feedback perturbation in Experiment 2 (which resulted in 46% compensation), since the compensatory commands generated by the auditory feedback controller will be resisted by the somatosensory feedback controller since they move the actual f o (which is sensed by the somatosensory system) away from the target f o. Our experimental findings thus provide strong support for these model-based hypotheses regarding the contributions of auditory and somatosensory feedback control during vocalization.
The DIVA model further predicts that sensory modalities require lower gain when the delays to detect and correct for errors are longer, relative to modalities with shorter response times. In a slow responding system, high gains would mean that the feedback controller may overcompensate for an error long after the error had occurred, leading to unstable behavior such as oscillations. In keeping gains low for slow-reacting controllers, compensatory behavior may be incomplete but will rarely overshoot the target (Guenther, 2016). Consistent with this prediction, these results showed that the contribution of somatosensory feedback control (faster responding controller) was greater than auditory feedback control (slower responding controller) in the laryngeal perturbation experiment.
A 100-cent shift was chosen for the auditory perturbation to approximate stimulus magnitude values recorded in pilot testing of the laryngeal perturbation in the condition with auditory masking, which isolates somatosensory feedback control. However, the average purely somatosensory perturbation magnitude recorded in the current experiment was 92 cents, which is slightly smaller than the 100-cent auditory perturbation magnitude. This small difference in magnitude is not likely to affect the size of the compensatory response (measured as a percentage of the perturbation size); for example, Liu and Larson (2007) found no significant difference in response magnitude for perturbations of f o unless the perturbation magnitudes differed by more than 20 cents. Furthermore, when controlling for f o acuity, no significant difference was detected in stimulus magnitude across conditions.
The Magnitudes of Compensatory Responses to Laryngeal and Auditory Perturbations Were Not Correlated With Each Other
A prior study involving sensorimotor adaptation in response to predictable auditory and laryngeal perturbations of formant frequencies (Lametti et al., 2012) identified an inverse relationship between the amount a participant compensates for the somatosensory perturbation and the auditory perturbation. This finding was interpreted as evidence that participants tend to have a “sensory preference,” with some responding more strongly to auditory perturbations and others responding more to somatosensory perturbations. In the current study, we found no evidence for such an inverse relationship; the amount participants compensated for the laryngeal perturbation was not correlated with the amount they compensated for the auditory perturbation. However, there were several major differences between the current study and the study of Lametti et al. (2012).
One such difference between these studies is that the perturbations in this study affected f o rather than formant frequencies, raising the possibility of different control mechanisms for f o compared to formants. Previous evidence suggests that different parts of speech are affected differently by auditory feedback. Perkell et al. (2007) showed that postural parameters (such as f o and duration) are strongly influenced by auditory feedback, whereas segmental parameters (formant frequencies) are more slow to respond to changes in auditory feedback (Perkell et al., 1992). An additional difference between the study of Lametti et al. (2012) and the current study is that the current study involved within-trial responses to unpredictable perturbations, whereas Lametti et al. measured adaptive changes in formants across many consecutive productions involving predictable perturbations. It is entirely possible that sensorimotor adaptation mechanisms, which operate over a longer time scale, have different properties than within-trial reflexive mechanisms that occur over tens of milliseconds. A final difference between these studies can be found in that Lametti et al. utilized a paradigm in which both auditory and somatosensory perturbations were applied simultaneously, whereas the current study presented the two perturbation types in different experimental tasks. Applying the perturbations simultaneously, sometimes in opposition to each other, may increase the likelihood that participants favor one sensory modality over another.
Evidence of sensory preference has been reported in other sensory domains, particularly in experiments contrasting visual and haptic feedback modalities (Ernst & Banks, 2002; Heller et al., 1999). These studies have shown that a given sensory modality is more dominant during a task when the feedback is more appropriate (less variance in information) to the experimental condition (e.g., visual feedback compared to haptic feedback in an object size discrimination task). This ultimately suggests that sensory preference may not be a stable characteristic of an individual, but rather task dependent. In the context of vocal motor control studies, the experimental tasks might present a bias to elicit a dominance for a sensory modality, but this preference may not generalize to all vocalization situations. Further studies are needed to elucidate the nature of sensory preference in voice motor control.
The Magnitudes of Compensatory Responses to Laryngeal and Auditory Perturbations Were Not Correlated With Auditory Acuity
The finding that auditory acuity was not associated with the amount of compensation in the auditory or laryngeal perturbation experiments is somewhat surprising since we expected individuals with better auditory acuity to be more sensitive to auditory errors and therefore produce larger compensatory responses. Previous studies that have shown a relationship between auditory acuity and compensatory responses were based on adaptive responses (as opposed to the reflexive responses in the current study). It is possible that the longer time scale of sensorimotor adaptation studies, which typically involve many more trials than studies of reflexive responses, may provide more statistical power to identify such correlations in the face of significant trial-to-trial response variability. Alternatively, there may in fact be no relationship between auditory acuity and within-trial compensatory response magnitude. It is possible that a participant's ability to detect differences in auditory stimuli does not necessarily reflect on their ability to correct for errors in their production. Further research is needed to investigate this issue.
Limitations and Future Directions
One limitation of the current study is that we were unable to standardize the stimulus magnitude of the laryngeal perturbation across individuals. The force being applied by the collar in the LDD was controlled by regulating the pressure in the balloon and standardizing the size of the balloon during manufacture. The anatomy of each participant's neck and larynx varied, however, and the resulting Stimulus Magnitude also varied. This potential confound was mitigated within participants by having the LDD in a constant position between auditory masking conditions as well as counterbalancing the order of the conditions. To best compare responses across participants, we defined the compensatory response (Response Percentage) as a function of the stimulus magnitude each participant received.
A further limitation of the current study is that the full effect of the laryngeal perturbation on f o could not be measured directly; instead, it was estimated by the peak deviation from baseline f o. However, as described above, this peak deviation depends not only on the perturbation but also on the early component of the compensatory response. As a consequence, the actual deviation in f o that would be caused by laryngeal displacement in the absence of feedback control processes was almost certainly larger than the peak deviation measured in the experiment. This consideration implies that our measure for percent compensation was a conservatively low estimate of the percent compensation to the true f o deviation caused by the perturbation. Thus, our conclusion that compensatory responses to laryngeal perturbations are smaller than responses to auditory perturbations remains valid.
Finally, the current findings cannot discern (a) the exact nature of the displacement of the perturbation (and how much this varied between participants) or (b) the muscles responsible for the compensatory responses observed in this study. While the video laryngoscopy investigation ruled out a full mechanical rebound of the larynx to its normal position as the source of the compensatory response, the lack of electromyographic recordings from the extrinsic and intrinsic laryngeal musculature in the current study precludes us from determining which muscles were responsible for the compensatory adjustments. Although electromyographic recordings obtained by Loucks et al. (2005) suggest that the primary intrinsic muscles associated with f o adjustments (the thyroarytenoid, sternothyroid, and cricothyroid muscles) were not responsible for the compensatory response in f o for a laryngeal perturbation similar to the one applied here, further research is required to identify which muscles were responsible for these compensatory adjustments.
Clinical Implications
The next step in this program of research is to examine the responses to laryngeal and auditory perturbations in populations with voice disorders. Given the dissociation shown between the somatosensory and auditory feedback control systems in this experiment, this paradigm has the potential to elucidate the underlying mechanisms of voice disorders. In spasmodic dysphonia, for example, abnormalities in somatosensory feedback control have been implicated as a possible pathophysiology of the disorder (Simonyan & Ludlow, 2010), but this hypothesis requires further study. Ultimately, such investigations may inform new directions for voice therapy research in these clinical populations.
Supplementary Material
Acknowledgments
This research was supported by National Institute on Deafness and Other Communication Disorders Grants R01 DC02852 (F. Guenther, PI), R01 DC016270 (C. Stepp and F. Guenther, MPIs), and R01 DC015570 (C. Stepp, PI). We would like to thank Daniel Buckley, who performed the endoscopy procedure, Riccardo Falsini, who contributed to analyses of the endoscopy data, and Andrés Salazar-Gómez, who helped design and construct the experimental setup. We would also like to thank all members of the Guenther and Stepp labs who provided support and guidance in the preparation of this manuscript.
Funding Statement
This research was supported by National Institute on Deafness and Other Communication Disorders Grants R01 DC02852 (F. Guenther, PI), R01 DC016270 (C. Stepp and F. Guenther, MPIs), and R01 DC015570 (C. Stepp, PI).
Footnote
f o was calculated in Praat using the autocorrelation function with a 0.001-s time step. The pitch floor and ceiling values were set to between 75 and 300 Hz for males and 100 and 500 Hz for females. These ranges were adjusted (− 50 Hz for males, + 100 Hz for females) if a participant's f o bordered the default range. The resultant f o trace was sampled from Praat in 1-ms intervals.
References
- Abbs J. H., & Gracco V. L. (1984). Control of complex motor gestures: Orofacial muscle responses to load perturbations of lip during speech. Journal of Neurophysiology, 51(4), 705–723. https://doi.org/10.1152/jn.1984.51.4.705 [DOI] [PubMed] [Google Scholar]
- Abur D., Lester-Smith R. A., Daliri A., Lupiani A. A., Guenther F. H., & Stepp C. E. (2018). Sensorimotor adaptation of voice fundamental frequency in Parkinson's disease. PLOS ONE, 13(1), e0191839 https://doi.org/10.1371/journal.pone.0191839 [DOI] [PMC free article] [PubMed] [Google Scholar]
- Bauer J. J., & Larson C. R. (2003). Audio-vocal responses to repetitive pitch-shift stimulation during a sustained vocalization: Improvements in methodology for the pitch-shifting technique. The Journal of the Acoustical Society of America, 114(2), 1048–1054. https://doi.org/10.1121/1.1592161 [DOI] [PMC free article] [PubMed] [Google Scholar]
- Boersma P., & Weenink D. (2018). Praat: Doing phonetics by computer [Computer software]. http://www.praat.org/
- Box G. E., & Cox D. R. (1964). An analysis of transformations. Journal of the Royal Statistical Society: Series B (Methodological), 26(2), 211–243. https://doi.org/10.1111/j.2517-6161.1964.tb00553.x [Google Scholar]
- Burnett T. A., Freedland M. B., Larson C. R., & Hain T. C. (1998). Voice f o responses to manipulations in pitch feedback. The Journal of the Acoustical Society of America, 103(6), 3153–3161. https://doi.org/10.1121/1.423073 [DOI] [PubMed] [Google Scholar]
- Burnett T. A., Senner J. E., & Larson C. R. (1997). Voice f o responses to pitch-shifted auditory feedback: A preliminary study. Journal of Voice, 11(2), 202–211. https://doi.org/10.1016/S0892-1997(97)80079-3 [DOI] [PubMed] [Google Scholar]
- Cai S., Beal D. S., Ghosh S. S., Tiede M. K., Guenther F. H., & Perkell J. S. (2012). Weak responses to auditory feedback perturbation during articulation in persons who stutter: Evidence for abnormal auditory-motor transformation. PLOS ONE, 7(7), e41830 https://doi.org/10.1371/journal.pone.0041830 [DOI] [PMC free article] [PubMed] [Google Scholar]
- Cai S., Boucek M., Ghosh S. S., Guenther F. H., & Perkell J. S. (2008). A system for online dynamic perturbation of formant trajectories and results from perturbations of the Mandarin triphthong /iau/. Proceedings of the 8th International Seminar on Speech Production, 65–68. [Google Scholar]
- Cohen J. (1988). Statistical power analysis for the behavioral sciences. Erlbaum; https://doi.org/10.1002/bs.3830330104 [Google Scholar]
- Ernst M. O., & Banks M. S. (2002). Humans integrate visual and haptic information in a statistically optimal fashion. Nature, 415(6870), 429–433. https://doi.org/10.1038/415429a [DOI] [PubMed] [Google Scholar]
- Feng Y., Gracco V. L., & Max L. (2011). Integration of auditory and somatosensory error signals in the neural control of speech movements. Journal of Neurophysiology, 106(2), 667–679. https://doi.org/10.1152/jn.00638.2010 [DOI] [PMC free article] [PubMed] [Google Scholar]
- Golfinopoulos E., Tourville J. A., Bohland J. W., Ghosh S. S., Nieto-Castañón A., & Guenther F. H. (2011). fMRI investigation of unexpected somatosensory feedback perturbation during speech. NeuroImage, 55(3), 1324–1338. https://doi.org/10.1016/j.neuroimage.2010.12.065 [DOI] [PMC free article] [PubMed] [Google Scholar]
- Gramming P., Sundberg J., Ternström S., Leanderson R., & Perkins W. H. (1988). Relationship between changes in voice pitch and loudness. Journal of Voice, 2(2), 118–126. https://doi.org/10.1016/S0892-1997(88)80067-5 [Google Scholar]
- Greenhouse S. W., & Geisser S. (1959). On methods in the analysis of profile data. Psychometrika, 24(2), 95–112. https://doi.org/10.1007/BF02289823 [Google Scholar]
- Guenther F. H. (2016). Neural control of speech. MIT Press; https://doi.org/10.7551/mitpress/10471.001.0001 [Google Scholar]
- Guenther F. H., Ghosh S. S., & Tourville J. A. (2006). Neural modeling and imaging of the cortical interactions underlying syllable production. Brain and Language, 96(3), 280–301. https://doi.org/10.1016/j.bandl.2005.06.001 [DOI] [PMC free article] [PubMed] [Google Scholar]
- Hain T. C., Burnett T. A., Kiran S., Larson C. R., Singh S., & Kenney M. K. (2000). Instructing subjects to make a voluntary response reveals the presence of two components to the audio-vocal reflex. Experimental Brain Research, 130(2), 133–141. https://doi.org/10.1007/s002219900237 [DOI] [PubMed] [Google Scholar]
- Heller M. A., Calcaterra J. A., Green S. L., & Brown L. (1999). Intersensory conflict between vision and touch: The response modality dominates when precise, attention-riveting judgments are required. Perception & Psychophysics, 61(7), 1384–1398. https://doi.org/10.3758/BF03206188 [DOI] [PubMed] [Google Scholar]
- Hickok G. (2012). Computational neuroanatomy of speech production. Nature Reviews Neuroscience, 13(2), 135–145. https://doi.org/10.1038/nrn3158 [DOI] [PMC free article] [PubMed] [Google Scholar]
- Houde J. F., & Nagarajan S. S. (2011). Speech production as state feedback control. Frontiers in Human Neuroscience, 5, 82 https://doi.org/10.3389/fnhum.2011.00082 [DOI] [PMC free article] [PubMed] [Google Scholar]
- Katseff S., Houde J., & Johnson K. (2011). Partial compensation for altered auditory feedback: A tradeoff with somatosensory feedback? Language and Speech, 55(2), 295–308. https://doi.org/10.1177/0023830911417802 [DOI] [PubMed] [Google Scholar]
- Kim K. S., Wang H., & Max L. (in press). It's about time: Minimizing hardware and software latencies in speech research with real-time auditory feedback. Journal of Speech, Language, & Hearing Research. [DOI] [PMC free article] [PubMed] [Google Scholar]
- Lametti D. R., Nasir S. M., & Ostry D. J. (2012). Sensory preference in speech production revealed by simultaneous alteration of auditory and somatosensory feedback. Journal of Neuroscience, 32(27), 9351–9358. https://doi.org/10.1523/JNEUROSCI.0404-12.2012 [DOI] [PMC free article] [PubMed] [Google Scholar]
- Larson C. R., Altman K. W., Liu H., & Hain T. C. (2008). Interactions between auditory and somatosensory feedback for voice f o control. Experimental Brain Research, 187(4), 613–621. https://doi.org/10.1007/s00221-008-1330-z [DOI] [PMC free article] [PubMed] [Google Scholar]
- Larson C. R., Burnett T. A., Kiran S., & Hain T. C. (2000). Effects of pitch-shift velocity on voice f o responses. The Journal of the Acoustical Society of America, 107(1), 559–564. https://doi.org/10.1121/1.428323 [DOI] [PubMed] [Google Scholar]
- Liu H., & Larson C. R. (2007). Effects of perturbation magnitude and voice f o level on the pitch-shift reflex. The Journal of the Acoustical Society of America, 122(6), 3671–3677. https://doi.org/10.1121/1.2800254 [DOI] [PubMed] [Google Scholar]
- Lombard E. (1911). Le signe de l'élévation de la voix. [The sign of the elevation of the voice]. Annales des Maladies de l'Oreille, du Larynx, du Nez et du Pharynx, 37, 101–119. [Google Scholar]
- Loucks T. M., Poletto C. J., Saxon K. G., & Ludlow C. L. (2005). Laryngeal muscle responses to mechanical displacement of the thyroid cartilage in humans. Journal of Applied Physiology, 99(3), 922–930. https://doi.org/10.1152/japplphysiol.00402.2004 [DOI] [PMC free article] [PubMed] [Google Scholar]
- Ludlow C. L., Van Pelt F., & Koda J. (1992). Characteristics of late responses to superior laryngeal nerve stimulation in humans. Annals of Otology, Rhinology & Laryngology, 101(2), 127–134. https://doi.org/https://doi.org/10.1177/000348949210100204 [DOI] [PubMed] [Google Scholar]
- Macmillan N. A., & Creelman C. D. (2005). Detection theory: A user's guide (2nd ed.). Erlbaum. [Google Scholar]
- Martin C. D., Niziolek C. A., Duñabeitia J. A., Perez A., Hernandez D., Carreiras M., & Houde J. F. (2018). Online adaptation to altered auditory feedback is predicted by auditory acuity and not by domain-general executive control resources. Frontiers in Human Neuroscience, 12(91), 1–14. https://doi.org/10.3389/fnhum.2018.00091 [DOI] [PMC free article] [PubMed] [Google Scholar]
- Mathworks. (2017). MATLAB (R2017b) [Computer software]. www.mathworks.com/help/releases/R2017b/matlab/index.html
- McGuire G. (2010). A brief primer on experimental designs for speech perception research. Laboratory Report, 77(1), 2–19. [Google Scholar]
- Osborne J. (2010). Improving your data transformations: Applying the Box–Cox transformation. Practical Assessment, Research, and Evaluation, 15(1), 12. [Google Scholar]
- Parrell B., Ramanarayanan V., Nagarajan S., & Houde J. (2019). The FACTS model of speech motor control: Fusing state estimation and task-based control. PLOS Computational Biology, 15(9), e1007321 https://doi.org/10.1371/journal.pcbi.1007321 [DOI] [PMC free article] [PubMed] [Google Scholar]
- Perkell J. S., Denny M., Lane H., Guenther F., Matthies M. L., Tiede M., Vick J., Zandipour M., & Burton E. (2007). Effects of masking noise on vowel and sibilant contrasts in normal-hearing speakers and postlingually deafened cochlear implant users. The Journal of the Acoustical Society of America, 121(1), 505–518. https://doi.org/10.1121/1.2384848 [DOI] [PubMed] [Google Scholar]
- Perkell J. S., Lane H., Svirsky M., & Webster J. (1992). Speech of cochlear implant patients: A longitudinal study of vowel production. The Journal of the Acoustical Society of America, 91(5), 2961–2978. https://doi.org/10.1121/1.402932 [DOI] [PubMed] [Google Scholar]
- Pörschmann C. (2000). Influences of bone conduction and air conduction on the sound of one's own voice. Acta Acustica United With Acustica, 86(6), 1038–1045. [Google Scholar]
- Purcell D. W., & Munhall K. G. (2006). Compensation following real-time manipulation of formants in isolated vowels. The Journal of the Acoustical Society of America, 119(4), 2288–2297. https://doi.org/10.1121/1.2173514 [DOI] [PubMed] [Google Scholar]
- Sapir S., Baker K. K., Larson C. R., & Ramig L. O. (2000). Short-latency changes in voice f o and neck surface EMG induced by mechanical perturbations of the larynx during sustained vowel phonation. Journal of Speech Language & Hearing Research, 43(1), 268–276. https://doi.org/10.1044/jslhr.4301.268 [DOI] [PubMed] [Google Scholar]
- Simonyan K., & Ludlow C. L. (2010). Abnormal activation of the primary somatosensory cortex in spasmodic dysphonia: An fMRI study. Cerebral Cortex, 20(11), 2749–2759. https://doi.org/10.1093/cercor/bhq023 [DOI] [PMC free article] [PubMed] [Google Scholar]
- Tourville J. A., Cai S., & Guenther F. H. (2013). Exploring auditory-motor interactions in normal and disordered speech. Proceedings of Meetings on Acoustics, 19(1), 060180 https://doi.org/10.1121/1.4800684 [Google Scholar]
- Villacorta V. M., Perkell J. S., & Guenther F. H. (2007). Sensorimotor adaptation to feedback perturbations of vowel acoustics and its relation to perception. The Journal of the Acoustical Society of America, 122(4), 2306–2319. https://doi.org/10.1121/1.2773966 [DOI] [PubMed] [Google Scholar]
- von Békésy G. (1949). The structure of the middle ear and the hearing of one's own voice by bone conduction. The Journal of the Acoustical Society of America, 21(3), 217–232. https://doi.org/10.1121/1.1906501 [Google Scholar]
Associated Data
This section collects any data citations, data availability statements, or supplementary materials included in this article.