

Abstract
This study compares revenue of Maryland hospitals in March-July 2020 vs historical trends and assesses whether rate increases for inpatient and outpatient services that were permitted to offset pandemic-related decines in revenues were associated with changes to state hospital revenue.
The outbreak of coronavirus disease 2019 (COVID-19) resulted in large-scale, unprecedented deferment of nonurgent medical and surgical care beginning in mid-March 2020.1 These volume reductions could threaten hospital solvency, particularly in rural areas and low-resource settings.2
Maryland has a distinctive health care payment model. A waiver from the Centers for Medicare & Medicaid Services allows a central body, the Health Services Cost Review Commission (HSCRC), to govern the rates for services and annual global budget for each hospital. Rates are set such that total revenues are anticipated to match each hospital’s planned annual revenue.3,4
To offset revenue losses from deferment of nonurgent care, the HSCRC allowed Maryland hospitals to temporarily increase their inpatient and outpatient service prices by up to 10% to 15% in late March and allowed further increases in inpatient prices up to 20% in May through July 2020.
We aimed to investigate (1) the revenues of Maryland hospitals from March through July 2020 compared with historical trends and (2) whether the option to increase rates was associated with changes to hospital revenues in the state.
Methods
We used HSCRC hospital revenue and volume data from January 2018 through July 2020. We calculated total monthly hospital revenue and compared 2020 revenues with 2 counterfactuals: (1) revenues in 2018 and 2019 (dollar amounts adjusted for inflation) and (2) estimated revenues in 2020 under the assumption that prices were held at their February levels, rather than increased in response to COVID-19. To calculate estimated revenue, we applied February 2020 price levels to volumes observed in later months. Hospitals were excluded if monthly revenue was ever missing during follow-up (n = 16). Analysis was stratified by hospital characteristics: urban or rural county designation,5 teaching status (yes or no), total hospital bed count, and percentage of Medicaid discharges (above or below median at baseline, defined using the 2018 American Hospital Survey).6 Analysis was conducted using Stata MP, version 16.0 (StataCorp).
Results
From February to April 2020, total monthly inpatient revenue of Maryland hospitals decreased from $842 million to $698.6 million (a decline of $143.4 million [17.0%]) (Figure). During the same period, hospital outpatient revenues declined from $601.9 million to $328.0 million (a decline of $273.9 million [45.5%]). April 2020 inpatient revenues were 17.9% to 18.8% lower than in April 2018 and April 2019, while hospital outpatient revenues were 47.1% to 48.0% lower. By July, monthly inpatient and outpatient revenues had increased to $903.8 million (5.8%-7.5% higher than July 2018 and July 2019) and $596 million (1.5%-4.1% lower), respectively.
Figure. Maryland Statewide Total Inpatient and Outpatient Hospital-Regulated Revenue.
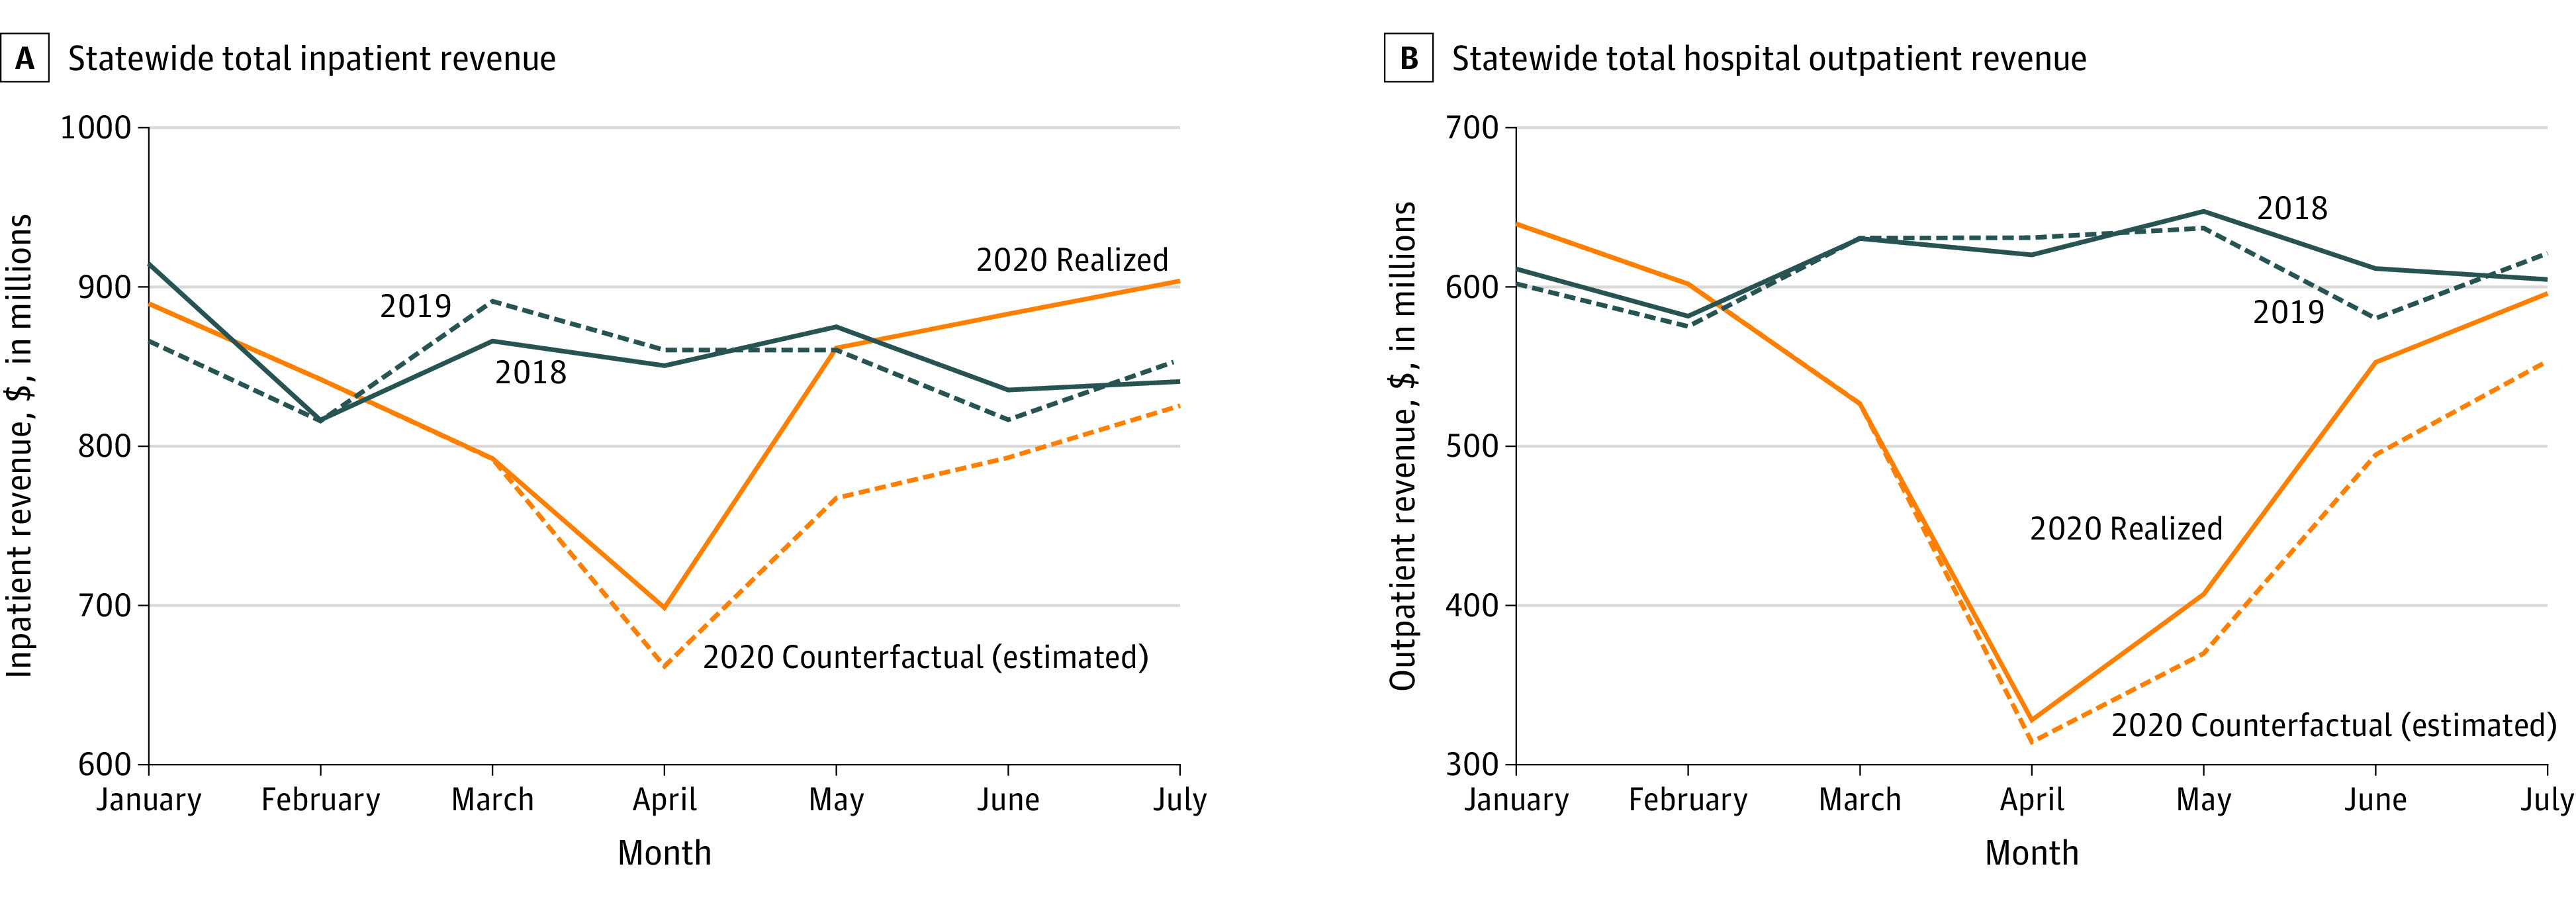
Absent the HSCRC intervention, we estimate that total inpatient revenues from March to July 2020 would have been an additional $300.2 million lower and outpatient revenue would have been $151.3 million lower.
The Table shows that with the HSCRC’s intervention, the overall inpatient revenue for Maryland hospitals for January to July 2020 ($5871.1 million) was only 1.6% lower than in January to July 2019 ($5965.4 million), with minimal variation by hospital characteristics (0.8%-4.2% lower). Outpatient revenues for 2020 ($3652 million) were 14.6% lower than for 2019 ($4277.5 million), with minimal variation by hospital type (13%-16.5% lower).
Table. Statewide Inpatient and Outpatient Hospital-Regulated Revenue (in Millions), January-July 2018-2020, by Selected Hospital Characteristics.
| No. of hospitals | Revenue, $, in millions | ||||||||
|---|---|---|---|---|---|---|---|---|---|
| Inpatient | Outpatient | ||||||||
| 2018 | 2019 | 2020 | 2020 counterfactuala | 2018 | 2019 | 2020 | 2020 counterfactuala | ||
| All hospitals | 47 | 6000.3 | 5965.4 | 5871.1 | 5570.9 | 4307.6 | 4277.5 | 3652.0 | 3500.7 |
| Urban | 32 | 5103.3 | 5088 | 5022.3 | 4752.3 | 3504.2 | 3468.8 | 2948.6 | 2810.6 |
| Rural | 15 | 897.0 | 877.4 | 848.8 | 818.6 | 803.4 | 808.6 | 703.4 | 690.1 |
| Teaching | 13 | 3347.3 | 3287.2 | 3241.1 | 3053.9 | 2364.1 | 2353.6 | 2026.6 | 1922.6 |
| Nonteaching | 34 | 2653 | 2678.2 | 2630 | 2517.0 | 1943.5 | 1923.9 | 1625.4 | 1578.1 |
| Bedsb | |||||||||
| <210 | 22 | 1249.8 | 1238.1 | 1186.5 | 1143.4 | 1102.3 | 1082.6 | 904.2 | 881.0 |
| ≥210 | 23 | 4699.3 | 4671.9 | 4629.0 | 4373.1 | 3162.2 | 3152.3 | 2711.8 | 2584.0 |
| Medicaid discharges, %b | |||||||||
| <21.3 | 23 | 1918.5 | 1900.6 | 1838.4 | 1754.8 | 1455.8 | 1424.7 | 1194.9 | 1148.1 |
| ≥21.3 | 22 | 4030.6 | 4009.4 | 3977.0 | 3761.7 | 2808.8 | 2810.3 | 2421.1 | 2316.9 |
2020 Counterfactuals represent hospital revenues under the assumption that no policy change occurred and prices remained constant. They were calculated by applying February price levels to volumes observed in later months.
Two hospitals were not included because their bed count and percentage Medicaid discharges were unavailable.
Discussion
Maryland hospitals had revenue reductions in the first months of the COVID-19 pandemic, followed by an almost complete recovery for inpatient revenue and partial recovery for outpatient revenue in May through July. The HSCRC’s intervention hastened the pace of financial recovery by allowing hospitals to recoup $451.5 million (38.5%) of losses that would have been incurred compared with January to July 2019. Absent any intervention, revenues would have more gradually recovered through July—a finding relevant to settings unable to enact such short-term price adjustments.
Limitations of the study include that the analysis was limited to revenue regulated by the HSCRC. A comprehensive accounting of hospital finances should additionally consider revenue reductions owing to declining physician fees and other areas not included in hospital rate setting or global budgeting, as well as further offsetting federal relief funding. Whether the additional revenue allowed for improved patient outcomes either through continuity of staff or other mechanisms needs further study.
Section Editor: Jody W. Zylke, MD, Deputy Editor.
References
- 1.Jain A, Jain P, Aggarwal S. SARS-CoV-2 impact on elective orthopaedic surgery: implications for post-pandemic recovery. J Bone Joint Surg Am. 2020;102(13):e68. doi: 10.2106/JBJS.20.00602 [DOI] [PMC free article] [PubMed] [Google Scholar]
- 2.Khullar D, Bond AM, Schpero WL. COVID-19 and the financial health of US hospitals. JAMA. 2020;323(21):2127-2128. doi: 10.1001/jama.2020.6269 [DOI] [PubMed] [Google Scholar]
- 3.Sapra KJ, Wunderlich K, Haft H. Maryland total cost of care model: transforming health and health care. JAMA. 2019;321(10):939-940. doi: 10.1001/jama.2019.0895 [DOI] [PubMed] [Google Scholar]
- 4.Rajkumar R, Patel A, Murphy K, et al. Maryland’s all-payer approach to delivery-system reform. N Engl J Med. 2014;370(6):493-495. doi: 10.1056/NEJMp1314868 [DOI] [PubMed] [Google Scholar]
- 5.State Finance and Procurement, Md Code Ann §2-207(a)(7)(2014).
- 6.American Hospital Association American Hospital Association Annual Survey Database. Accessed October 2, 2020. https://www.ahadata.com/aha-annual-survey-database