

Abstract
Protein labeling strategies have been explored for decades to study protein structure, function, and regulation. Fluorescent labeling of a protein enables the study of protein-protein interactions through biophysical methods such as microscale thermophoresis (MST). MST measures the directed motion of a fluorescently labeled protein in response to microscopic temperature gradients, and the thermal mobility can be used to determine binding affinity. However, the stoichiometry and site-specificity of fluorescent labeling are hard to control, and heterogeneous labeling can generate inaccuracies in binding measurements. Here, we describe an easy-to-apply protocol for high stoichiometry and site-specifically labeling of a protein at its N-terminus with N-hydroxysuccinimide esters (NHS-esters) to measure protein-protein interaction affinity by microscale thermophoresis (MST). This protocol includes guidelines for NHS ester labeling, fluorescent-labeled protein purification, and MST measurement using a labeled protein. As an example of the entire workflow, we additionally describe a protocol for labeling a ubiquitin E3 enzyme and testing ubiquitin E2 E3 enzyme binding affinity. These methods are highly adaptable and can be extended for protein interaction studies in various biological and biochemical circumstances.
INTRODUCTION
Numerous protein labeling strategies have been explored for decades to study protein structure, function, and regulation. Protein fluorescent labeling, for instance, can be achieved chemically, enzymatically, or by genetic fusion with fluorescent proteins like Green Fluorescent Protein (GFP), Red Fluorescent Protein (RFP)(Crivat & Taraska, 2012; Snapp, 2005), and others. Chemical approaches include Cys modification by iodoacetamide and maleimide derivatives and Lys modification by NHS esters, Click chemistry with azides and alkynes, and protein semisynthesis involving expressed protein ligation (EPL) or native chemical ligation (NCL) (Carrico, Carlson, & Bertozzi, 2007; Cravatt, Wright, & Kozarich, 2008; Dawson & Kent, 2000; Friedmann, 1952; Muir, Sondhi, & Cole, 1998; Noren, Anthony-Cahill, Griffith, & Schultz, 1989; Russ Algar, Medintz, & Dawson, 2017; Saxon, Armstrong, & Bertozzi, 2000). EPL and NCL have the advantages of high stoichiometry and site-specificity due to the chemoselective reaction between the thioester and the N-Cys of a peptide or protein (Dawson, Muir, Clark-Lewis, & Kent, 1994; Schwarzer & Cole, 2005). Enzymatic approaches for protein labeling include sortase-mediated transpeptidation, subtiligase assisted thioester ligation, and haloalkane dehalogenase (Halo) or SNAP facilitated reactions (Antos et al., 2009; Chang, Jackson, Burnier, & Wells, 1994; Henager et al., 2016; Mohapatra, Lin, Feng, Basu, & Ha, 2020).
Selectively labeling of amine groups on proteins with N-hydroxysuccinimide esters (NHS esters) has been widely adopted in biochemical studies due to its ease of use (Anderson, 1964; Terpetschnig, Szmacinski, Ozinskas, & Lakowicz, 1994). NHS esters react and form bonds with primary amine groups on proteins, including lysine side chains and the free N-terminal amine, to form stable amide linkages. These reactions, however, are not site-specific. Considering that lysine is one of the most abundant residues in proteins (estimated to be about 8% of a protein’s composition)(Brooks, Fresco, Lesk, & Singh, 2002), using NHS esters can lead to heterogeneous labeling, and this can affect protein function and structure, which can diminish the reliability and accuracy of studies such as those on protein-protein interactions.
Today, various biophysical and biochemical methods can be used to measure the affinity of protein-protein interactions, including isothermal titration calorimetry (ITC), surface plasmon resonance (SPR), fluorescence polarization (FP), capillary electrophoresis, analytical ultracentrifugation, enzyme-linked immunosorbent assays (ELISA), and microscale thermophoresis (MST) (Jerabek-Willemsen, Wienken, Braun, Baaske, & Duhr, 2011; Patching, 2014; Rao, Srinivas, Sujini, & Kumar, 2014; Tighe, Ryder, Todd, & Fairclough, 2015; Velazquez-Campoy, Leavitt, & Freire, 2004). Microscale thermophoresis has emerged as a sensitive method for assessing biomolecular interactions. This approach monitors the movement of fluorescent-labeled molecules in a microscopic temperature gradient generated by an infrared (IR) laser (Duhr & Braun, 2006).
Thermophoresis, also known as thermal diffusion, is a physical phenomenon corresponding to the direct motion of molecules induced by a temperature gradient, typically from a hot zone to a cold zone (Asmari, Ratih, Alhazmi, & El Deeb, 2018). First discovered by Ludwig in the 19th century (Rusu, Gambhir, McLaughlin, & Rädler, 2004), thermophoresis has been widely applied in different scientific fields since, such as in organic chemistry and polymer separation (Wienken, Baaske, Rothbauer, Braun, & Duhr, 2010). Braun and Libchaber reported the thermophoresis rate of DNA for the first time and quantified the diffusion constant by fluorescent dyes and laser heating (Braun & Libchaber, 2002). Reineck studied thermophoresis of single-strand DNA in a microscopic scale capillary and thus pointed out that a capillary can provide a reliable microfluidic environment to investigate thermophoresis in solution (Reineck, Wienken, & Braun, 2010). Since then, microscale thermophoresis (MST) measurements have increasingly been used to determine the binding affinity of biomolecules. Thermophoresis changes induced by a binding event reflect changes in the size, charge, surface area, hydration state, or structural conformation of a fluorescently labeled biomolecule. Thus, MST provides excellent versatility in measuring binding affinity for protein-protein interaction studies (Wienken et al., 2010).
Here, we describe a method that utilizes the native chemical ligation reaction by first converting an NHS ester to a thioester in situ with a thiol reagent (MESNa). Then, the thioester derivative reacts with a protein N-terminal Cys revealed after proteolysis with TEV or SUMO protease. The label thus attaches to the protein N-terminus via a stable amide bond. The labeled protein can then be used for binding studies using MST. We outline protocols for N-terminal labeling of a protein with an NHS ester (Basic Protocol 1 and Alternate Protocol 1), purifying and evaluating the labeled protein (Basic Protocol 2), and conducting MST binding assays with an N-terminal fluorescent-labeled protein (Basic Protocol 3). A workflow of the protocols is shown in Figure 1.
Figure 1. Outline of the protocols for N-terminal labeling with NHS ester and binding affinity measurement by MST.

Basic Protocol 1 describes how to conduct the NHS ester labeling reaction. Basic Protocol 2 describes how to purify the NHS ester labeling reaction and get the labeled protein ready for the MST measurement. Basic Protocol 3 describes the procedure to conduct the binding assay on an MST instrument.
To give users a detailed example of the entire workflow, we additionally describe a complete protocol for N-terminal labeling the ubiquitin E3 ligase WWP2 with an NHS ester, and using MST to measure the binding affinity of WWP2 to a ubiquitin E2 conjugation enzyme (Basic Protocol 4). The overall protocols described here will ultimately allow users to fluorescently label, in a site-specific manner, any protein of interest on its N-terminus. Users can then measure its binding affinity to other biomolecules via MST assays, allowing for in-depth biochemical studies on a protein of interest.
STRATEGIC PLANNING
Protein cloning, expression, and purification
The protocols require users to clone their protein of interest and its binding partner, and purify them. We describe some considerations about this below.
Design a protein of interest construct with an N-terminal affinity tag, such as a glutathione S-transferase (GST) or a multi-histidine tag (His), that will be used for purification purposes. In addition, users need to engineer a TEV cleavage sequence (aa. ENLYFQC, Glu-Asn-Leu-Tyr-Phe-Gln-Cys) or SUMO sequence with a Cys after the di-Gly SUMO cleavage site at the very N-terminus of the protein of interest, right after the N-terminal affinity tag. During protein expression and purification, the Cys residue is not especially reactive, but after the protease cleavage, the N-terminal Cys is exposed for labeling. The binding partner construct, on the other hand, does not need any additional modification.
The open reading frame (ORF) for the protein of interest or the binding partner should be subcloned into an appropriate expression vector. A protein expression system should be chosen accordingly to allow for robust production of the protein in its native state. The expression system can be E. coli cells (e.g., BL21 CodonPlus DE3 RIPL, Rosetta Plyss cells), insect cells (e.g., SF9, High Five cells), or mammalian cells (e.g., HEK293, CHO cells). The source of protein should not affect the NHS ester labeling procedure described in this protocol. Users should follow best practices for different expression systems (see, for instance (Hunter, Yuan, Vavilala, & Fox, 2019; Schendel, 1998; Xie, Han, & Miao, 2018)).
Harvest cell pellets by centrifugation after protein expression. Generally, the cells are lysed by French press, sonicator, homogenizer, or subjected to a chemical extraction solution like RIPA buffer. High-speed centrifugation is conducted to extract the soluble protein and remove precipitates and cell debris. Employ suitable affinity chromatography based on the tagging choice to isolate the protein of interest. Wash the affinity beads adequately. Use an appropriate elution buffer to elute the desired protein from the affinity resin. Conduct further purification if needed, such as size-exclusion chromatography (SEC) or ion-exchange chromatography. Users can follow previously described protocols for best purification practices (Harper & Speicher, 2008; Wingfield, 2014). We recommend having at least 100 μg (or 100 μl at 5 μM) of the purified protein of interest to embark on the protocols. The purified binding partner should be at a stock concentration of at least 50 times the projected KD value, for accurate KD determination.
MST instrument
Check the MST system/light detector that you or your institution possess or have access to before starting the Basic Protocols. The only vendor that manufactures MST instruments is NanoTemper Technologies GmbH (Germany). NanoTemper offers Monolith instruments with five different excitation and emission filter systems, including Nano Blue (excitation 460–480 nm, emission 515–530 nm), Nano Green (excitation 515–525 nm, emission 560–585 nm), Nano Red (excitation 605–645 nm, emission 675–685 nm), Pico Red (excitation 605–645 nm, emission 675–685 nm, with higher-sensitivity detection), and LabelFree (UV excitation 280 nm, emission 360 nm, only appropriate for non-fluorescent ligands). The most common systems found in academic laboratories are the NT.115 and NT.115pico instruments, with a choice of one or two from the blue, red, or green LED detectors.
Working concentration of the target protein and ligand
Knowing whether a relatively weak protein-protein interaction (KD >20 μM) or a high-affinity binding event (KD <1 μM) will be measured will enhance the experimental setup. The unlabeled ligand’s stock concentration should be as high as possible to approach the saturation concentration (> 50x KD). To accurately determine the KD value, usually at least 3 data points are needed at concentrations well below and above the KD, and multiple data points should be collected around the KD.
Labeling reaction procedure
The protein of interest is usually expressed recombinantly with an affinity tag at the N-terminus. The affinity tag will typically be cleaved with either TEV or SUMO protease, exposing an N-terminal Cys, which should be introduced adjacent to the C-terminus of the tag. In practice, the labeling strategy using NHS esters can be performed in two slightly different ways: a stepwise procedure (Dempsey, Jiang, Kalin, Chen, & Cole, 2018), described in Basic Protocol 1, or a one-pot approach (Jiang, D’Agostino, Cole, & Dempsey, 2020), described in Alternate Protocol 1. In the stepwise procedure, cleavage of the N-terminal affinity tag is carried out prior to labeling. For this, and as described in the aforementioned protocols, users will need to purify the cleaved protein and remove the N-tag. After chromatography, the labeling reaction is performed by mixing the N-Cys protein with the thioester derivative that is pre-generated from the requisite NHS ester. For the one-pot procedure, users will need to add the protease and thioester to the intact protein simultaneously. As the N-terminal affinity tag is being cleaved by the protease, the exposed N-terminal Cys of the protein reacts with the thioester generating the labeled protein in the process.
In most cases, users can choose either of these procedures and will achieve similar labeling results. If users have a stock of low purity target protein to start with, the stepwise procedure is recommended, as the stepwise procedure begins with protease cleavage and N-Cys target protein purification, resulting in cleaner conditions for the labeling reaction. The one-pot procedure is generally preferred for well-behaved proteins that are relatively pure, as it saves time by combining the protease cleavage and labeling reactions.
BASIC PROTOCOL 1: LABELING A PROTEIN OF INTEREST AT ITS N-TERMINUS WITH NHS ESTERS THROUGH STEPWISE REACTION.
Native chemical ligation (NCL) represents a form of chemical ligation that can be used to assemble two or more peptide segments. In the NCL reaction, a cysteine amino acid from one peptide can rapidly react with another amino acid derivative’s C-terminal thioester on another peptide through a transthioesterification reaction. The intermediate product then undergoes an S-to-N acyl shift to form an amide bond resulting in the ligation of the two peptides (Figure 2A). In the NHS ester labeling method presented in this protocol, we utilize the NCL reaction mechanism by first converting an NHS ester to a thioester with MESNa (thiol reagent). The thioester derivative can site-specifically react with a protein N-terminal Cys revealed after proteolysis with TEV or SUMO protease. The reaction leads to amide bond formation and enables the N-terminal labeling of the target protein (Figure 2B). Here, we describe the procedure to site-specifically label a protein of interest with an NHS ester fluorescent dye through stepwise reaction. For this protocol, users should have the N-terminal tagged purified protein in hand, with a TEV or SUMO protease site engineered between the N-terminal affinity tag and the protein of interest (see Strategic Planning).
Figure 2. Reaction mechanisms for N-terminal labeling with NHS ester.
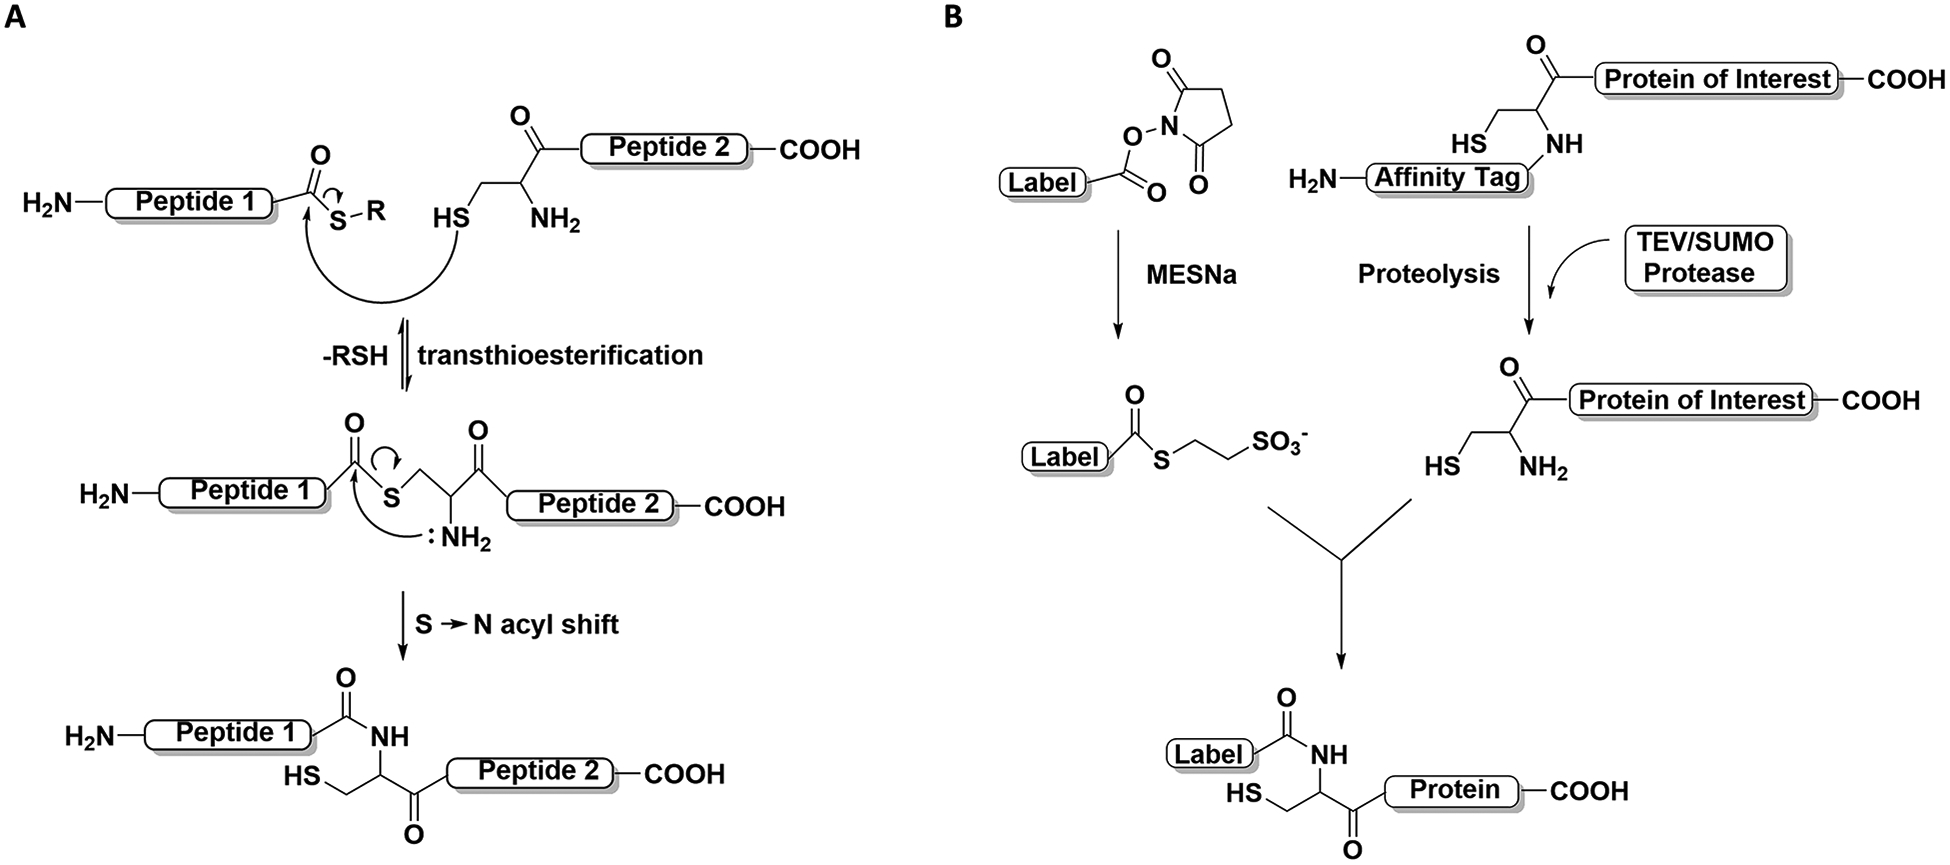
(A) Native Chemical ligation (NCL) reaction mechanisms in steps. The key steps are shown, namely, the transthioesterification step and the S-to-N acyl shift step. (B) N-terminal Cys site-specific labeling with an NHS ester. The labeling reaction follows the NCL reaction mechanism to form an isopeptide bond between the label and the target protein.
Materials
Purified protein of interest with N-terminal affinity tag (see Strategic Planning)
TEV protease (Sigma T4455)
SUMO protease (Thermo Fisher Scientific 12588018)
Fluorophore N-hydroxysuccinimide ester, e.g., NHS-Fluorescein (Thermo Fisher Scientific 46410), Sulfo-Cyanine 5 NHS ester (Lumiprobe 43320), etc.
Labeling buffer (see Reagents and Solutions)
Thioester generation solution (see Reagents and Solutions)
Storage buffer (see Reagents and Solutions)
Mercaptoethanesulfonate sodium (MESNa, Sigma Aldrich M1511)
Tris(2-carboxyethyl) phosphine (TCEP, Gold Biotech TCEP25)
Cystamine dihydrochloride (Sigma Aldrich, C121509)
Affinity Column, e.g., Glutathione Agarose (Thermo Fisher Scientific 25237), Ni Sepharose 6 (Cytiva Lifescience 17531801)
Slide-A-Lyzer dialysis cassettes (Thermo Fisher Scientific 66453)
Zeba spin desalting columns (Thermo Fisher Scientific 89891)
Vortex Genie 2 (Fisher Scientific 12–812)
Falcon tubes 15 mL (Thermo Fisher Scientific 339651)
Eppendorf tubes 1.5 mL (Sigma-Aldrich, T9661)
pH electrode (Thermo Fisher Scientific 8103BNUWP)
Sorvall Legend XTR Centrifuge (Thermo Fisher Scientific 75217420)
Analytical Balance (Mettler Toledo ME-T)
Aluminum foil (Reynolds F28015)
Pipette tips
ddH2O
Protocol Steps
Protease cleavage of the protein of interest
-
1
Add TEV or SUMO protease to the purified protein at a molar ratio of 1:10 – 1:20 (protease:expressed protein). For 1.8 ml of purified protein at 100 μM, add 100–200 μl of 100 μM TEV/SUMO protease to have a final protease concentration of 5–10 μM.
This step is to cleave the N-terminal affinity tag to expose the N-terminal Cys on the protein.
-
2
Cleave the protein for 16-hour overnight at 4 ℃.
-
3
Remove the N-tag by re-applying the cleavage mixture to the affinity column (glutathione agarose for GST tag, Ni sepharose for His tag, etc.) used to purify the protein.
The cleaved N-tag will rebind to the column, and the tag-free protein will flow through the column.
-
4
Collect the flow-through, which contains the protein of interest with the N-terminal Cys exposed.
-
5
Wash the affinity column with 1X column volume (CV, usually 2–4 ml) of storage buffer (refer to Reagents and Solutions) to elute the residual N-Cys protein.
-
6
Combine the flow-through from step 4 and the elute from step 5.
-
7
Dialyze the N-terminal Cys protein with a Slide-A-Lyzer dialysis cassette to exchange the buffer composition to the labeling reaction buffer for at least two rounds of ca. 4–10 hours dialysis. Use at least 500 ml of labeling reaction buffer for every 5 ml of protein solution for each round of dialysis.
Use a Zeba spin desalting column for buffer exchange instead of dialysis to shorten the time, if needed.
Conversion of the NHS ester to a thioester that will be used in the labeling reaction
-
8
Dissolve the fluorophore NHS ester to a concentration of 2–5 mM in labeling buffer (see recipe in Reagents and Solutions). The MESNa in the labeling buffer will react with the NHS ester and convert it into a thioester.
As NHS esters and thioesters are prone to hydrolysis, make a fresh NHS ester solution before conducting a protein labeling reaction. As a reference, prepare at least 400 μl of the fluorophore NHS ester for 1.6 ml of purified protein of interest.
-
9
Vortex vigorously to dissolve the NHS ester.
-
10
Wrap the tube with aluminum foil to protect the solution from light (to prevent photo-oxidation reactions) and incubate the NHS ester solution at room temperature for 3–5 hours. Vortex the NHS ester solution every 30 minutes to 1 hour for full dissolution and thioester conversion..
Vortexing is necessary, especially when the solubility of the NHS ester is low. As the NHS ester conversion to the thioester occurs, the reagent solubility usually improves.
-
11
Check the solution at the end of this incubation to make sure a clear solution is obtained. Otherwise, consider lowering the concentration of the NHS ester to 1 mM.
Similar labeling efficiency can be achieved at lower NHS ester concentration with extended labeling reaction times.
N-terminal labeling reactions
-
12
Mix the cleaved N-terminal Cys protein with the incubated thioester. Recommended final concentrations in the labeling reaction are 1 mM of the thioester reagent and 5–50 μM of the protein.
For 1.6 ml of purified protein at 100 μM, add around 400 μl of 5 mM thioester mixture to have the thioester mixture concentration at 1 mM.
-
13
Incubate the reaction at room temperature for 24 hours, avoiding light by wrapping the reaction tube with aluminum foil.
For unstable proteins, the reaction can also be conducted at 4°C, but a lower labeling rate should be expected. In such circumstances, extend the reaction time to 48 hours or use a higher thioester concentration (2 mM or higher).
-
14
Quench the labeling reaction by adding 50–100 mM cysteamine that has been pre-adjusted to pH 6.8.
-
15
Perform the quenching for at least 30 mins at room temperature, avoiding light by wrapping the reaction tube with aluminum foil. Proceed to Basic Protocol 2 immediately after this step.
Thioesters are not stable and thus, we do not recommend freezing them for later use.
ALTERNATE PROTOCOL 1. LABELING A PROTEIN OF INTEREST AT ITS N-TERMINUS WITH NHS ESTERS THROUGH A ONE-POT REACTION.
The labeling reaction can also be conducted together with the TEV/SUMO protease cleavage step in a one-pot reaction procedure. If users have a high purify stock of a well-behaved target protein, we recommend choosing this one-pot procedure, as it saves time. In this protocol, we detail the practical steps that are employed in the NHS ester labeling reaction one-pot method. As described in Strategic Planning, users should choose between stepwise or the one-pot labeling reaction correspondingly based on the properties of the protein of interest.
Materials
Purified protein of interest with N-terminal affinity tag (see Strategic Planning)
TEV protease (Sigma T4455)
SUMO protease (Thermo Fisher Scientific 12588018)
Fluorophore N-hydroxysuccinimide ester, e.g., NHS-Fluorescein (Thermo Fisher Scientific 46410), Sulfo-Cyanine 5 NHS ester (Lumiprobe 43320), etc.
Labeling buffer (see Reagents and Solutions)
Thioester generation solution (see Reagents and Solutions)
Mercaptoethanesulfonate sodium (MESNa, Sigma Aldrich M1511)
Tris(2-carboxyethyl) phosphine (TCEP, Gold Biotech TCEP25)
Cystamine dihydrochloride (Sigma Aldrich, C121509)
Slide-A-Lyzer dialysis cassettes (Thermo Fisher Scientific 66453)
Zeba spin desalting columns (Thermo Fisher Scientific 89891)
Vortex Genie 2 (Fisher Scientific 12–812)
Falcon tubes 15 mL (Thermo Fisher Scientific 339651)
Eppendorf tubes 1.5 mL (Sigma-Aldrich, T9661)
pH electrode (Thermo Fisher Scientific 8103BNUWP)
Sorvall Legend XTR Centrifuge (Thermo Fisher Scientific 75217420)
Analytical Balance (Mettler Toledo ME-T)
Aluminum foil (Reynolds F28015)
Pipette tips
ddH2O
Protocol Steps
Conversion of an NHS ester to a thioester for the labeling reaction
-
1
Dialyze the protein of interest with a Slide-A-Lyzer dialysis cassette to exchange the buffer composition to the labeling reaction buffer for at least two rounds of ca. 4–10 hours dialysis. We recommend having at least 100 μg of the protein of interest at the start of the process. Use at least 500 ml of labeling reaction buffer for every 5 ml of protein solution for each round of dialysis.
Zeba spin desalting column can be used instead of dialysis to shorten the time needed.
-
2
Dissolve the fluorophore NHS ester to 2–5 mM in labeling buffer (see recipe in Reagents and Solutions). The MESNa in the labeling buffer will react with the NHS ester and convert it to fluorophore thioester.
Make a fresh NHS ester solution before conducting a protein labeling reaction.
-
3
Vortex vigorously to dissolve the NHS ester.
-
4
Wrap the tube with aluminum foil to protect the solution from light and incubate the NHS ester solution at room temperature for 3–5 hours. Vortex the solution every 30 minutes to 1 hour for full dissolution and thioester conversion.
-
5
Check the solution at the end of this incubation to make sure a clear solution is obtained. Otherwise, consider lowering the concentration of the NHS ester in Step 1.
Protease cleavage and N-terminal labeling reactions
-
6
Add the incubated thioester and TEV or SUMO protease to the purified protein. The protease should be added at a molar ratio of 1:10 – 1:20 (protease:expressed protein). We recommend a final concentration of 1 mM thioester mixture, 0.5–5 μM protease, and 5–50 μM of purified protein of interest.
For 1.6 ml of purified protein at 100 μM, add around 100–200 μl of 100 μM TEV/SUMO protease to have a final protease concentration at 5–10 μM, and add around 400 μl of 5 mM thioester mixture to have the thioester mixture concentration at 1 mM.
The TEV/SUMO protease cleaves off the N-tag from the protein and exposes the N-terminal Cys, which will react with the thioester reagent to form an amide bond.
-
7
Wrap the reaction tube with aluminum foil and incubate the reaction at room temperature for 24 hours,.
For unstable proteins, the reaction can also be conducted at 4°C, but a lower labeling rate should be expected. In these circumstances, extend the reaction time to 48 hours or longer or use higher thioester concentration (2–5 mM in reaction).
-
8
Quench the labeling reaction by adding 50–100 mM cysteamine that has been pre-adjusted to pH 6.8.
-
9
Perform the quenching for at least 30 mins at room temperature, avoiding light by wrapping the reaction tube with aluminum foil. Proceed to Basic Protocol 2 immediately after this step.
Thioesters are not stable, and thus, we do not recommend freezing them for later use.
BASIC PROTOCOL 2: PURIFYING THE N-TERMINAL LABELED PROTEIN AND DETERMINING ITS CONCENTRATION AND LABELING EFFICIENCY
After the NHS labeling reaction, the labeled protein needs to be purified for downstream applications, such as MST measurement. The impurities to eliminate include but are not limited to the TEV/SUMO protease, excess amount of fluorophore thio-ester, and potential aggregated species of the protein of interest. Different purification methods are used in combination to get rid of these impurities, which include dialysis, desalting, affinity chromatography, size-exclusion chromatography, ion-exchange chromatography, and others. Here, we describe a general purification workflow to purify the labeled protein post the NHS ester labeling reaction. The N-terminal labeled protein concentration and labeling efficiency is determined after purification.
Materials
Labeled protein from Basic Protocol 1 or Alternate Protocol 1
Glycerol (Sigma Aldrich G5516)
Storage buffer (see Reagents and Solutions)
Purification buffer (see Reagents and Solutions)
FPLC gel filtration standard (Bio-rad 1511901)
Bradford reagent (Sigma Aldrich B6916)
BCA protein assay kit (Thermo Fisher Scientific 23227)
Mini-PROTEAN TGX precast gels (Bio-rad, 4561096)
Mini-PROTEAN gel electrophoresis system (Bio-rad, 1658025FC)
Amicon Centrifugal Filter Unit (Millipore UFC905024)
Slide-A-Lyzer dialysis cassettes (Thermo Fisher Scientific 66453)
Zeba spin desalting columns (Thermo Fisher Scientific 89891)
FPLC size-exclusion chromatography column, e.g., Superdex 200 10/300 GL size exclusion chromatography column (GE healthcare, 28990944)
NanoDrop Spectrophotometer (Thermo Fisher Scientific ND-2000)
Akta Purifier 10 FPLC System with UFC-900 collector (GE Healthcare AK-P100)
High-speed tabletop centrifuge (Fisher Scientific Sovall legend XTR 75217420)
Falcon tubes 15 mL (Thermo Fisher Scientific 339651)
Eppendorf tubes 1.5 mL (Sigma-Aldrich, T9661)
Sorvall Legend XTR Centrifuge (Thermo Fisher Scientific 75217420)
NORM-JECT® syringe (Air-Tite 4010.200V0)
Pipette tips
Liquid nitrogen
ddH2O
Protocol Steps
-
1
Remove excess thioester dye from the complete reaction from Basic Protocol 1 or Alternate Protocol 1 by dialysis against a buffer with the purification buffer (refer to the Reagents and Solutions). Perform at least two rounds of ca. 4–10 hours dialysis using a membrane with the appropriate dialysis cutoff to remove most of the dye in the reaction system. Use at least 500 ml of labeling reaction buffer for every 5 ml of protein solution for each round of dialysis.
A desalting column with a proper cutoff (for example, a Zeba 7 kDa molecular weight cutoff spin desalting column) can be used as an alternative to dialysis for removing the excess fluorescent dye in less time.
-
2
Concentrate the labeled protein with the Amicon centrifugation filter at 4000 x g to a volume of around 500 μl.
Depending on the property of the protein of interest, an end volume higher than 500 μl is acceptable when coupled with multiple size-exclusion chromatography injections.
-
3
Install a Superdex 75 or 200 size-exclusion chromatography column on an Akta Purifier FPLC system.
-
4
Equilibrate a Superdex 75 or 200 size-exclusion chromatography column with the purification buffer (refer to the Reagents and Solutions) for at least 2 column volumes (CV), 60 ml, at a flowrate of 0.4 ml/min.
-
5
Inject and purify the labeled protein product using the Superdex 75 or 200 size-exclusion chromatography column. This extended purification further removes residual fluorophore dyes, the TEV/SUMO protease, and protein aggregation species.
Typical FPLC run settings for the Superdex 200 size-exclusion chromatography are listed below:
| Flow rate | 0.4–0.6 mL/min |
| System/Column pressure | 3.0 MPa |
| Sample injection | 7 mL |
| Sample collection size | 0.5 mL |
| Run volume | 1 CV |
-
6
Check the UV absorption trace. Collect and combine the fractions showing the correct molecular weight, containing the labeled protein.
The molecular weight reference can be found on the Superdex 200 column manufacturer manual or a standard protein chromatogram.
-
7
Add glycerol to the fractionated protein sample to reach a final glycerol concentration of 10% v/v. Mix well, by gently pipetting up and down.
Glycerol helps prevent aggregation or precipitation during the concentration process and preserves the protein from freeze/thaw damage.
-
8
Use the Amicon filter system at 4000 x g to concentrate the combined protein sample. Concentrate the labeled protein to achieve an estimated concentration of, typically, 0.5–20 mg/mL, for best storage.
The final volume for this step is determined by the starting amount of the target protein for the labeling reaction and the protein loss over the labeling and purification processes. For example, if users start the labeling reaction with 500 μg of protein of interest, with an estimated 50% loss over the subsequent steps, we recommend concentrating to less than 500 μl, to achieve at least 0.5 mg/mL.
-
9Determine the protein concentration by measuring its absorbance at 280 nm, with a correction for the fluorophore contribution, using a spectrophotometer or Nanodrop. The correction factor (CF) of the fluorophore can be found in the product manual or the manufacturer’s website. Calculate the protein concentration as follows,
where ε - fluor molar extinction coefficient in M−1 × cm−1; Amax is the maximum absorbance of labeled protein measured at the specific fluorescent peak absorption wavelength; A280 is the absorbance of labeled protein at 280 nm.
Bradford or BCA assay can also be used to determine protein concentration. Users can refer to a specific protocol for Bradford and BCA assays (Olson, 2016). Alternatively, protein concentration can be determined by densitometry by comparing stardard BSA protein by SDS-PAGE and staining (see, (Gallagher, 2012; Gallagher & Sasse, 2012)).
-
10
Determine the labeled efficiency by measuring the absorbance at the corresponding fluorophore wavelength using a spectrophotometer or Nanodrop.
Calculate the labeling efficiency as follows,where ε - fluor molar extinction coefficient in M−1 × cm−1; Amax is the maximum absorbance of labeled protein measured at the specific fluorescent peak absorption wavelength.
-
11
Aliquot and flash freeze the labeled protein sample with liquid nitrogen. Store the samples at −80 °C for future use.
BASIC PROTOCOL 3: USING MST TO DETERMINE AN N-TERMINAL FLUORESCENT-LABELED PROTEIN’S BINDING AFFINITY TO A BINDING PARTNER.
Here, users will determine the binding affinity of the N-terminal fluorescent-labeled protein to a binding protein partner, via an MST binding assay. The MST binding assay requires a fluorophore-labeled target protein and a binding protein partner. The purified, labeled protein is obtained via Basic Protocol 1 (or Alternate Protocol 1) and Basic Protocol 2. Before starting the MST measurement, users should have purified a binding protein partner with a stock concentration 50 times higher than the projected KD value, to accurately determine the KD value (see Strategic Planning).
The MST instrument consists of an optical filter that delivers visible light to excite the fluorophore being used in microscopic scale capillaries at the desired wavelength, and of a specific detector to capture the emitted light from the capillary zone. It has an infrared laser that is used to generate heat in the observation zone, and this is coupled by a dichroic mirror to the same light path as the fluorescence signal (Figure 3A). A typical MST measurement involves several steps. First, the capillary’s microscopic fluorescence intensity is recorded at the ground state temperature (“cold” condition). Next, the infrared (IR) laser is activated to generate a small “hot” zone (producing a 2–6 °C temperature gradient). At the same time, the fluorescence detector is enabled to record the fluorescence intensity change. Typically, protein molecules will move away from the heat source, resulting in a decrease in fluorescence intensity. The molecules move out of the observation window on a pathway to equilibrium. Subsequently, the IR laser is turned off, and the local field temperature starts to drop, leading to re-equilibration quickly, and the fluorescence intensity returns to baseline (Figure 3B). After the measurement is done for one capillary, the detector moves on to the next one and the cycles continue until the MST data from 16 capillaries are collected. The traces of the fluorescence level vs. time are recorded (Figure 3C). Users will evaluate thermophoresis using a fixed concentration of the labeled protein of interest and different concentrations of the unlabeled ligand. Normalized fluorescence intensity (Fnorm) reflects the difference in the fluorescent target’s thermophoresis in either a bound or unbound state, which is used to calculate KD (Figure 3D).
Figure 3. Microscale thermophoresis instrument and MST binding assay.

(A) MST instrument layout. Monolith NT.115 is taken as an example. The infrared (IR) laser is included in the same light path of fluorescence excitation and detection through the dichroic mirror. Capillaries filled with MST samples are placed onto the capillary tray. LCD detector scans the MST samples in the capillaries one by one. (B) A representative MST trace, or the fluorescence intensity over time trace, is shown. Phases 1 to 4 represent different stages of thermophoresis. At time 0 sec, the IR laser is turned on. At 20s, the IR laser is turned off. Each stage is depicted in the cartoon on top, where the green circles represent the fluorescent labeled protein molecules, the red circle represents the region heated by the IR laser, and the arrows indicate the direction of movement of the fluorescent labeled molecules. (C) Different MST traces from bound and unbound target protein are shown. Four different MST traces are listed as examples. A representative unbound protein MST trace is colored in blue. A representative bound protein MST trace is colored in red. Two of the transient-state MST traces are colored in green and yellow. Note the MST trace shift from unbound to bound state. Fnorm represents normalized fluorescence intensity. (D) MST binding curve plotted using the thermophoresis signals Fnorm (normalized fluorescence intensity) on the y-axis versus the ligand concentrations (μM) on the x-axis. The example data points are colored as in Figure 3C.
The protocol described below is based on a Monolith NT.115Pico with Nano Blue and Pico Red detectors. Necessary adjustments on experimental settings may be needed if a different model of Monolith NT.115 instrument or LCD detector is used.
Materials
Purified N-terminal fluorescent-labeled protein (from Basic Protocol 2)
Purified (and unlabeled) binding partner of the protein of interest (see Strategic Planning)
Bovine Serum Albumin (BSA, Gemini Bio 700–100P)
Tween 20 (Sigma Aldrich, P9416)
NP-40 (Sigma Aldrich, 492018)
Triton X (Sigma Aldrich, T8787)
Assay buffer (see Reagents and Solutions)
Ligand buffer (see Reagents and Solutions)
Individual PCR tubes (Corning 6571)
PCR 8-strip tubes with caps (SSI Bio 3131)
Monolith NT.115 capillaries (NanoTemper MO-K022)
Monolith NT.115 premium capillaries (NanoTemper MO-K025, if needed)
Monolith NT.115 Pico microscale thermophoresis instrument (NanoTemper)
MST control software MO. Control (NanoTemper, v1.6)
MST analysis software MO. Affinity Analysis (NanoTemper, v2.2)
Sorvall Legend XTR centrifuge (Thermo Fisher Scientific 75217420)
Sorvall Legned Micro 21 centrifuge (Thermo Fisher Scientific 75002436)
Pipette tips
Protocol Steps
Preparation of the working solutions of the target protein
-
1
Thaw the fluorescent-labeled protein (target protein) and its non-labeled binding partner protein (ligand).
The fluorescently labeled protein is hereafter referred to as the target protein, and the unlabeled protein binding partner is hereafter referred to as the ligand.
-
2
Centrifuge the target protein and ligand stock for 5 min at 14000 x g at 4°C.
This centrifugation helps remove aggregates.
-
3
Prepare a 2X working solution at 10–200 nM of the target protein with assay buffer (refer to Reagents and Solutions).
A standard working concentration of the target protein is between 5–100 nM.
0.1% Tween 20 and 0.1 mg/mL BSA added to the assay buffer can help stabilize the protein and reduce non-specific protein binding to the capillaries. Other detergents like NP40 and Triton X can also be used instead of Tween 20 when needed.
MST pre-test
-
4
Add 10 μl of 2X working solution of the target protein to two PCR tubes.
-
5
Add 10 μl of ligand buffer (refer to the Reagents and Solutions) to the two PCR tubes and mix well by pipetting up and down.
-
6
Fill two capillaries with the mixed solution by dipping the capillaries into the samples in the PCR tubes.
-
7
Place the two capillaries onto the MST capillary tray, at positions 1 and 2.
-
8
Start the MST device and the MST control software MO. Control (v1.6).
-
9
Enable temperature control. Usually, the MST measurement temperature is at 25°C.
The temperature can be controlled between 22–45°C. It takes several minutes to reach the set temperature.
-
10
Set the LED channel to “Nano Blue” for a FAM/FITC fluorophore-labeled protein.
Other fluorescent-labeled proteins may need the “red” channel for measurement. Choose an appropriate LED channel after checking the excitation/emission profile of the used fluorophores.
-
11
Choose the capillary type (standard or premium coated). Enter the working solution concentration of the target protein (5–100 nM).
-
12
Enable auto-detection for the fluorophore excitation power. Choose the MST power (default is medium), which indicates the IR laser’s energy that is used to create the microscale thermal gradient in a range of 2–6 ℃.
-
13
Perform the pre-test.
The pre-test includes the capillary scan and MST measurement. The capillary scan examines the fluorescence intensity of the labeled target protein, while the MST measurement examines the MST signals.
-
14
Check the capillary scan to see if a proper intensity count is obtained. The recommended intensity count for the Pico Red detector is >3000, and for the Nano Blue detector, >200. The detection saturates at 25000 (Pico Red) or 2500 (Nano Blue) counts. Adjust the excitation power if needed.
Lower the excitation power or adjust the target protein working concentration so that the emission is below saturation. Increase the excitation power or change the target protein working concentration if the optical intensity is not achieved in the initial setting.
-
15
Check the shape of the excitation peak from the capillary scan. A symmetric, sharp peak should be obtained. Check if there is an adsorption effect of the labeled target protein to the capillary wall, which leads to shoulders or a clear double fluorescent peak. If that’s the case, check the Troubleshooting section for solutions.
-
16
Check the capillary scan for pipetting errors. The result from the two capillaries should be similar (less than 20% deviation).
-
17
Check the MST measurement to see if a continuous smooth MST trace is obtained.
Visually inspect the MST trace to see if there are bumps and spikes in the trace, which could indicate unwanted aggregation. Check the Troubleshooting section for solutions.
-
18
Check the post-MST capillary scan. Compare the intensity and the shape of the excitation peak with the initial capillary scan to see if the labeled protein behavior is preserved after the MST measurement.
-
19
Go back to step 2 to adjust the target protein working concentration if the fluorescence intensity is too high or too low. Repeat Steps 3–18 of the pre-test to validate the MST measurement condition after adjusting the target protein working concentration
More details about assay optimization can be found in the Troubleshooting section.
Preparation of working solution of the ligand and MST mix samples
-
20
Prepare the ligand working solution with ligand buffer (refer to Reagents and Solutions section, same buffer composition as the storage buffer). The concentration of the working solution should be >50 times higher than the projected KD value.
If 50 times the predicted KD concentration is hard to achieve for the ligand, generate a solution with the ligand concentration at the maximum level possible.
-
21
Prepare a ligand dilutions series using individual PCR tubes or PCR strip tubes.
A standard binding affinity experiment on the NT.115 uses a serial dilution of the ligand working solution with 16 different concentrations. Here, users will do a set of sixteen 1:2 serial dilutions of the ligand with the ligand buffer.
-
22
Add 10 μl of the ligand buffer into PCR tubes 2–16.
-
23
Add 10 μl of the working solution of the ligand to PCR tube 1.
-
24
Add 10 μl of the ligand’s working solution to PCR tube 2 and mix well by pipetting up and down.
Now, PCR tube 2 has a 0.5X dilution of the working ligand solution.
-
25
Transfer 10 μl from PCR tube 2 into PCR tube 3 and mix well.
-
26
Transfer 10 μl from PCR tube 3 into PCR tube 4 and mix well. Repeat this process for the remaining dilutions steps until PCR tube 16.
-
27
Discard the excess 10 μl solution from tube 16. Now all 16 PCR tubes should contain a volume of 10 μl ligand solution at the various concentrations.
Avoid any buffer dilution effects. All 16 PCR tubes should contain the exact same buffer composition.
-
28
Prepare the final MST mix by adding 10 μl of the 2X working solution of the target protein to each 10 μl ligand solution in PCR tubes 1–16.
-
29
Mix well by pipetting up and down and incubate at room temperature for 5 min to allow establishment of the binding equilibrium.
A longer incubation time or different temperatures can be used depending on the specific binding pair of the target protein and ligand.
MST measurement
-
30
Start the MO. Control software (v1.6). Select the binding affinity program.
-
31
Choose the capillary type (standard or premium coated). Enter the fixed working solution concentration of the target protein.
-
32
Enter the highest ligand concentration and select the dilution type to 1:2 dilution. The dilution series concentration is calculated automatically by the software.
-
33
Select the excitation power and MST power obtained from the pre-test.
-
34
Fill 16 capillaries with the 16 MST mixes by dipping the capillaries into PCR tubes 1 to 16.
-
35
Place the capillaries onto the capillary tray on positions 1 to 16.
-
36
Perform the MST binding affinity measurement. The default settings are sufficient for most binding assays (with initial fluorescence for 5 sec, recording thermophoresis for 20 sec, and after-thermophoresis fluorescence for 5 sec). A 16 capillary MST experiment will typically take 20–30 minutes (Example traces shown in Figure 3C).
-
37
Examine the initial and post-MST capillary scans of fluorescence intensity to determine if evidence of any unwanted sample adsorption or other irregularities are occurring. Refer to the Troubleshooting section for solutions.
-
38
Inspect the capillary shape for potential protein adsorption on the capillary. Refer to the Troubleshooting section for solutions.
-
39
Inspect the MST traces for potential protein aggregation or instability issues. Refer to the Troubleshooting section for solutions.
-
40
Repeat the MST measurement with a new series of MST mixtures. Repeat at least twice to determine the binding affinity reliably and with high precision.
-
41
Save the MST experiment data for further data analysis.
MST data analysis
-
42
Start the MST analysis software MO. Affinity Analysis (v2.2).
-
43
Load the MST measurement data obtained from the binding assays.
-
44
Select the analysis type “MST analysis” and add the technical or biological repeats runs to the MST analysis session.
-
45
Click the information tab to show the capillary scans, capillary shape, and MST trace raw data.
-
46
Switch to the dose-response curve panel and start the analysis.
Normalized fluorescence intensity (Fnorm) is determined for each concentration of ligand:where Fnorm is the normalized fluorescent intensity; Fhot is the fluorescence in the heated zone; Fcold is fluorescence at the initial state or after cooling. In the MST measurement, Fnorm is reflected in the Y-axis of the MST binding curves (Figure 3D).
The difference in Fnorm of target protein in the bound state and unbound state can then be calculated by,where FB is the bound fraction at the specific ligand concentration.
-
47
Fit the data to the “KD model” in the software if a 1:1 binding model makes sense, and calculate the KD based on the fitted data.
Calculate the FB in a KD Model with a 1:1 binding stoichiometry using the equation listed below, where [A] is the total concentration of the fluorescent target, [B] is the total concentration of the ligand [B], and [AB] is the concentration of the bound complex of A and B.For a 1:1 interaction, a semi-log plot of ligand concentration vs. Fnorm will produce an S-shaped plot where the unbound and saturated states are represented by the lower or upper plateau (Figure 3D). This model is typically solved by non-linear regression for Kd, [bound], and [unbound] terms, with a fixed target concentration.
-
48
Use the Hill equation for calculation of the EC50 for cooperative or more complex binding behavior (non 1:1 stoichiometry binding). The EC50 reflects the half-maximum concentration of ligand in a binding event. In a binding event represented as [A] +n [B], where n is the Hill coefficient, FB can be calculated as,
-
49
Generate a full report of the binding experiments.
BASIC PROTOCOL 4: NHS ESTER LABELING OF UBIQUITIN E3 LIGASE WWP2 AND MEASUREMENT OF THE BINDING AFFINITY BETWEEN WWP2 AND E2 CONJUGATING ENZYME BY THE MST BINDING ASSAY.
Lys ubiquitination is a key protein post-translational modification. Though initial studies on ubiquitination focused on its degradation function, numerous studies have emerged indicating that ubiquitination can influence cell trafficking, signal transduction, DNA repair, and other processes (Berndsen & Wolberger, 2014; Jiang, Thomas, Chen, Chiang, & Cole, 2019; Rotin & Kumar, 2009; Yau & Rape, 2016). Ubiquitination is catalyzed by a cascade of three enzymes, namely, E1 activating, E2 conjugating, and E3 ligating enzymes, involving sequential ubiquitin transfers that eventually modify protein substrate Lys residues. E2 and E3 enzymes cooperate to achieve the biological function. HECT-type E3 ligases accept ubiquitin from an E2 conjugating enzyme on a catalytic cysteine directly involved in ubiquitin transfers, and then deliver it to a target substrate Lys residue, to form a stable isopeptide bond (Metzger, Hristova, & Weissman, 2012). Studies on how the E2 conjugating enzyme and the E3 ligating enzyme interact can provide valuable information on how the two enzymes perform their function and reveal regulation mechanisms (Chen et al., 2017; Kamadurai et al., 2009).
For this example protocol, we recombinantly expressed WWP2 with an N-terminal glutathione S-transferase (GST) tag connected via a TEV protease sequence linker, and the ubiquitin E2 conjugating enzyme with an N-terminal His-SUMO tag, in E. coli. The WWP2 protein was purified using a glutathione resin affinity column. The ligand protein E2 was purified with a Ni+ resin and treated with SUMO protease. Affinity resin and FPLC size-exclusion chromatography were used to purify the tag-less E2 ligand-protein further. The E2 protein was concentrated to 46 mg/mL, equivalent to 2.7 mM. WWP2 (65 kDa) and E2 (16 kDa) are both monomeric proteins and are suggested to bind each other in a 1:1 ratio (Kamadurai et al., 2009). Here, we detail a protocol to label WWP2 at the N-terminus using Fluorescein NHS ester (5/6-carboxyfluorescein succinimidyl ester, FAM-NHS ester) adopting a stepwise labeling procedure (Basic Protocol 1 and 2), and then use the labeled FAM-WWP2 to measure its binding affinity to its requisite E2 (UbcH5c) enzyme by performing MST binding assays (Basic Protocol 3).
Materials
Purified GST-WWP2 E3 ligating enzyme
Purified E2 conjugating enzyme
5/6-carboxyfluorescein succinimidyl ester (Thermo Fisher Scientific 46409)
Mercaptoethanesulfonate sodium (MESNa, Sigma Aldrich M1511)
Cystamine dihydrochloride (Sigma Aldrich, C121509)
Glycerol (Sigma Aldrich G5516)
Bovine Serum Albumin (BSA, Gemini Bio 700–100P)
Tween 20 (Sigma Aldrich, P9416)
Labeling buffer (see Reagents and Solutions)
Thioester generation solution (see Reagents and Solutions)
Storage buffer (see Reagents and Solutions)
Purification buffer (see Reagents and Solutions)
Assay buffer (see Reagents and Solutions)
Ligand buffer (see Reagents and Solutions)
Glutathione Agarose (Thermo Fisher Scientific 25237)
Amicon Ultra-15 Centrifugal Filter Unit (Millipore UFC905024)
Slide-A-Lyzer dialysis cassettes (Thermo Fisher Scientific 66453)
Zeba spin desalting columns (Thermo Fisher Scientific 89891)
Vortex Genie 2 (Fisher Scientific 12–812)
Falcon tubes 15 mL (Thermo Fisher Scientific 339651)
Eppendorf tubes 1.5 mL (Sigma-Aldrich, T9661)
pH electrode (Thermo Fisher Scientific 8103BNUWP)
Individual PCR tubes (Corning 6571)
PCR 8-strip tubes with caps (SSI Bio 3131)
Superdex 200 10/300 GL size exclusion chromatography column (GE healthcare, 28990944)
NanoDrop Spectrophotometer (Thermo Fisher Scientific ND-2000)
Akta Purifier 10 FPLC System with UFC-900 collector (GE Healthcare AK-P100)
High-speed tabletop centrifuge (Fisher Scientific Sovall legend XTR 75217420)
Monolith NT.115 capillaries (NanoTemper MO-K022)
Monolith NT.115 premium capillaries (NanoTemper MO-K025, if needed)
Monolith NT.115 Pico microscale thermophoresis instrument (NanoTemper)
MST control software MO. Control (NanoTemper, v1.6)
MST analysis software MO. Affinity Analysis (NanoTemper, v2.2)
Sorvall Legend XTR Centrifuge (Thermo Fisher Scientific 75217420)
Mini-PROTEAN TGX precast gels (Bio-rad, 4561096)
Mini-PROTEAN gel electrophoresis system (Bio-rad, 1658025FC)
Analytical Balance (Mettler Toledo ME-T)
Aluminum foil (Reynolds F28015)
NORM-JECT® syringe (Air-Tite 4010.200V0)
Pipette tips
ddH2O
Protocols Steps
Labeling of the WWP2 protein with FAM-NHS ester
-
1
Add a 1:10 ratio of TEV protease to expose the N-terminal cysteine. For this example, 1 μM of TEV was added to around 10 μM GST-WWP2 in a total volume of 2 ml.
-
2
Incubate overnight (16 hr) at 4°C to allow full cleavage of the GST-tag.
-
3
Apply the solution to a fresh 3 ml glutathione agarose resin column to remove the free GST-tag.
-
4
Collect the flow-through from the glutathione affinity column and wash the glutathione resin with 3 ml of storage buffer (see Reagents and Solutions).
-
5
Dialyze the flow-through against the labeling buffer (see Reagents and Solutions) for two rounds, with each round for about 4 hrs. Use at least 500 ml of labeling buffer for every 5 ml of protein solution for each round of dialysis.
-
6
Concentrate the N-Cys WWP2 protein to 800 μL using a 50 kDa 15 mL Amicon centrifugation system at 4000 x g.
-
7
Weigh 0.47 mg of the FAM-NHS ester powder and dissolve in 200 μl of thioester generation solution (see Reagents and Solutions), to obtain a 5 mM NHS ester stock.
-
8
Wrap the reaction tube with aluminum foil and incubate the thioesterification reaction at room temperature for ca. 4–10 hours.
-
9
Mix the 200 μl thioester solution with 0.8 ml cleaved WWP2 to start the 24-hour room temperature labeling reaction, avoiding light by wrapping the reaction tube with aluminum foil.
-
10
Add 110 μl of 500 mM pH 6.8 cystamine to the 1.0 ml labeling reaction. Quench the reaction for 30 min.
Pre-adjust cystaimine pH to 6.8 before adding to the reaction.
Purification of the FAM-labeled WWP2 protein
-
11
Dialyze the reaction against the labeling buffer for three cycles, with each cycle for about 4 hrs, to remove excessive free dye. Use at least 500 ml of labeling reaction buffer for every 5 ml of protein solution for each round of dialysis
-
12
Concentrate the labeled WWP2 protein to 500 μL using a 50 kDa 15 mL Amicon centrifugation system at 4000 x g.
-
13
Equilibrate the Superdex 200 30/100 GL column using storage buffer for 2 column volumes (60 mL) on an Akta Pure FPLC system at a flowrate of 0.4 mL/min.
-
14
Inject the concentrated WWP2 sample onto the Superdex 200 column.
-
15Start a purification run with the parameters listed below:
Flow rate 0.5 mL/min System/Column pressure 3.0 MPa Sample injection 7 mL Sample collection size 0.5 mL Run volume 30 mL -
16
Monitor the UV profile during elution and collect the peak fractions at around 12 ml (65 kDa protein) corresponding to WWP2 protein. The residual TEV protease (at around 17 ml, 26 kDa protein) is removed at this step due to its size difference with WWP2 (65 kDa).
-
17
Combine the FAM-WWP2 containing FPLC fractions. Add glycerol to the fractionated protein samples to reach a final glycerol concentration of 10% v/v. Mix well, by gently pipetting up and down.
-
18
Concentrate the protein with a 50 kDa 15 mL Amicon centrifugation filter at 4000 x g, to a final volume of 250 μL.
-
19
Run the labeled FAM-WWP2 sample by SDS-PAGE with a 4–20% gradient gel. The gel can then be analyzed using Typhoon imaging and Coomassie staining. The protein concentration can be precisely determined by densitometry using standard BSA protein as a reference (final concentration at 2 mg/ml, equal to 31 μM). For detailed protocols about running an SDS-PAGE and staining, see (Gallagher, 2012; Gallagher & Sasse, 2012).
-
20
Determine the labeling efficiency by Nanodrop at absorbance 280 nm and 495 nm using the equation from Basic Protocol 2, Step 11. The determined labeling efficiency should be around 70–80%.
Preparation of the FAM-WWP2 working solution and MST pre-test
-
21
Centrifuge the labeled FAM-WWP2 protein and ligand E2 protein stock for 5 min at 14000 x g at 4°C.
-
22
Prepare a 2X working solution (100 nM) of the target protein with assay buffer (refer to the Reagents and Solutions section). The working concentration of FAM-WWP2 protein is 50 nM. As such, mix 2 μl of 31 μM FAM-WWP2 with 618 μl of assay buffer to acquire 100 nM 2X working concentration.
-
23
Add 10 μl of 2X working solution of the target protein to two PCR tubes.
-
24
Add 10 μl of ligand buffer (refer to the Reagents and Solutions section) to the two PCR tubes and mix well.
-
25
Fill two capillaries with the mixed solution by dipping the capillaries into the samples.
-
26
Place the two capillaries onto the MST capillary tray, at positions 1 and 2.
-
27
Start the MST device and the MST control software MO. Control (v1.6).
-
28
Enable temperature control. Set the MST measurement temperature at 25 °C.
-
29
Set the LED channel to “Nano Blue” for the FAM-WWP2 labeled protein. Choose the capillary type as standard capillaries. Enter a working solution concentration of 20 nM for FAM-WWP2.
-
30
Enable the auto-detection for the fluorophore excitation power. Set the MST power to ‘Medium’.
-
31
Perform the pre-test on the two capillaries on the capillary tray, which includes the capillary scan and MST measurement.
-
32
Check the capillary scan. The fluorescence peak should be symmetric with an intensity of around 300 at 100% excitation power. The two capillaries should generate similar fluorescence signals. No significant difference should be observed on the fluorescence peak before and after the MST measurements (see Figure 4A).
-
33
Check the MST measurement. Continuous smooth MST traces should be obtained at 40% MST power with no bumps and spikes observed in the MST traces (see Figure 4B).
Figure 4. Case study of measuring the binding affinity of the E3 FAM-WWP protein to the E2 enzyme UbcH5c.

(A) Capillary scan data from the MST pre-test confirms the target protein working concentration is well-selected and no adsorption to the capillaries is observed. (B) MST traces from the MST pre-test. Smooth and standard MST traces are acquired with no bumps, which verifies that the MST conditions are suitable. (C) Capillary scan data from the MST binding measurement. 16 capillaries are scanned and examined, showing symmetric peaks with proper intensities. (D) MST traces from the E2, E3 binding affinity measurement. The x-axis represents time (s), and the y-axis indicates Fnorm value measurement obtained by the MST instrument. 15s time-zone is selected (highlighted in red, Fhot, fluorescence in the heated zone) as it provides a decent signal to noise ratio. The time frame before the laser turning on is highlighted in blue (Fcold, fluorescence at the initial state or the cooled state) (E) Dose-response curve generated from three replicates. The x-axis is the log10 scale of the ligand concentration in molar. The y-axis represents Fnorm (per thousand) obtained at different ligand concentrations. The KD value was calculated using the isothermal binding equation model in the MO. Affinity Analysis software associated with the MST instrument.
Preparation of the working solution of the ligand E2 protein and MST mix samples
-
34
Prepare a working solution of 1.5 mM of the ligand E2 protein with ligand buffer (refer to Reagents and Solutions section, same buffer composition as the storage buffer). Dilute the 2.7 mM E2 to 1.5 mM by mixing 50 μl of E2 protein with 40 μl ligand buffer.
-
35
Prepare the ligand dilutions series using individual PCR tubes or PCR strip tubes.
-
36
Add 10 μl of the ligand buffer into PCR tubes 2–16.
-
37
Add 10 μl of the working solution of the ligand to PCR tube 1.
-
38
Add 10 μl of the ligand’s working solution to PCR tube 2 and mix well by pipetting up and down.
-
39
Transfer 10 μl from PCR tube 2 into PCR tube 3 and mix well.
-
40
Transfer 10 μl from PCR tube 3 into PCR tube 4 and mix well. Repeat this process for the remaining dilutions steps until PCR tube 16.
-
41
Discard the excess 10 μl solution from tube 16. Now all 16 PCR tubes should contain a volume of 10 μl ligand solution at the various concentrations.
Avoid any buffer dilution effects. All 16 PCR tubes should contain the same buffer composition.
-
42
Prepare the final MST mix by adding 10 μl of the 2X working solution at 100 nM of the target protein to each 10 μl ligand solution in PCR tubes 1–16. The FAM-WWP2 working concentration 50 nM is achieved after the mixing. The ligand concentration ranges from 750 μM to 23 nM.
-
43
Mix well and incubate at room temperature for 5 min to allow for the binding equilibrium to be established.
MST Measurement of the binding affinity between E2 and WWP2 E3 protein
-
44
Start the MO. Control software. Select the binding affinity program.
-
45
Choose the capillary type as standard capillary. Enter the fixed working solution concentration of the target protein as 50 nM.
-
46
Enter the highest ligand concentration and select the dilution type to 1:2 dilution. The dilution series concentration is calculated automatically.
-
47
Select the excitation power and MST power obtained from the pre-test.
-
48
Fill 16 capillaries with the 16 MST mixes by dipping the capillaries into PCR tubes 1 to 16.
-
49
Place the capillaries onto the capillary tray, in positions 1 to 16.
-
50
Perform the MST binding affinity measurement with the default settings. A 16 capillary MST experiment will typically take 25 minutes.
-
51
Check the capillary scan result. The fluorescence peaks should be symmetric, with an intensity of between 300 and 400 units (see Figure 4C).
-
52
Examine the MST measurement curve. No bumps and spikes should be observed in the MST traces (see Figure 4D).
-
53
Repeat the MST measurement with a new series of MST mixtures for two more times to reliably determine the binding affinity.
-
54
Save the MST experiment data for further data analysis.
MST data analysis
-
55
Start the MST analysis software MO. Affinity Analysis (v2.2).
-
56
Load the MST measurement data of the three replicates.
-
57
Select the analysis type for “MST analysis” and add the technical or biological repeats runs to the MST analysis session.
-
58
Click the information tab to show the capillary scans, capillary shape, and MST trace raw data.
-
59
Switch to the dose-response curve panel and start the analysis using a KD model of the analysis software.
The KD for E2–E3 interaction calculated from triplicates was 9.6 ±1.1 μM (see Figure 4E).
-
60
Generate a full report of the binding experiments.
REAGENTS AND SOLUTIONS
Labeling buffer
100 mM HEPES
150 mM NaCl
1 mM TCEP
Adjust pH to 6.8 with sodium hydroxide and store at 4°C.
Thioester generation solution
100 mM HEPES
150 mM NaCl
1 mM TCEP
500 mM MESNa
Make fresh each time, adjust pH to 6.8 with sodium hydroxide and store at room temperature.
Purification buffer
25 mM HEPES
250 mM NaCl
1 mM TCEP
Adjust pH to 7.5 with sodium hydroxide and store at 4°C.
Storage buffer
25 mM HEPES
250 mM NaCl
1 mM TCEP
10% v/v Glycerol
Adjust pH to 7.5 with sodium hydroxide and store at 4°C.
Assay buffer
25 mM HEPES
250 mM NaCl
1 mM TCEP
0.1% Tween 20
0.1 mg/ml BSA
Make fresh, adjust pH to 7.5 with sodium hydroxide, and store at room temperature before using.
Ligand buffer
25 mM HEPES
250 mM NaCl
1 mM TCEP
10% v/v Glycerol
Adjust pH to 7.5 with sodium hydroxide and store at 4°C.
COMMENTARY
Background information
Protein-protein interactions play an essential role in many cellular processes, including signal transduction, cargo transportation, antigen recognition, among others (Kuzmanov & Emili, 2013; Skipper, 2005; Stelzl et al., 2005). Specific and efficient labeling of a protein can help in the study of protein-protein binding interactions and avoids artifacts associated with non-specific or heterogeneous labeling (Seidel et al., 2013). As discussed in this protocol, an NHS ester can be used for N-terminal site-specific protein labeling. This easy-to-apply labeling method provides site-specific, stoichiometric labeling of a protein of interest. We described detailed methods for converting commercially available NHS esters bearing different labels to a thioester in situ and subsequently attaching it to the N-terminal cysteine of a recombinant protein via an NCL reaction mechanism.
The early version of the NCL reaction was first reported by Wieland et al. demonstrating that a cysteine amino acid can rapidly react with the C-terminal thioester of another amino acid derivative (Wieland, Bokelmann, Bauer, Lang, & Lau, 1953) (Figure 2A). Four decades later, this concept was expanded to produce proteins by total- or semisynthesis (Dawson et al., 1994; Muir et al., 1998). We describe a method that utilizes the Wieland reaction by first converting an NHS ester to a thioester in situ with a thiol reagent (MESNa). Then, the thioester derivative reacts with a protein N-terminal Cys revealed after proteolysis with TEV or SUMO protease. The label thus attaches to the protein N-terminus via a stable amide bond (Figure 2B). Notably, this labeling process can be quickly adopted by most molecular biology labs, even if they lack synthetic chemical experience or facilities. Specificity and high stoichiometry of the process are readily achievable. Even considering that lysine is one of the most abundant residues in proteins (Brooks et al., 2002), non-specific labeling of lysine residues is estimated to be less than 0.5% per site on a protein subjected to the labeling procedure described here, compared to nearly 90% of N-terminal Cys labeling (Dempsey et al., 2018).
MST is an emerging technique that applies thermophoresis, the motion of molecules in a temperature field, to characterize biomolecular interactions (Asmari et al., 2018). MST refers to the motion of molecules in a microscopic temperature gradient. A temperature gradient induces not only a flow of heat but also a flow of biomolecules (Jerabek-Willemsen et al., 2011). The coupled heat-flow and mass-flow is known as the Ludwig-Soret effect or thermophoresis. Thermophoresis is dependent on the size, charge, and solvation entropy of the molecules (Braun & Libchaber, 2002). These factors all contribute to the Ludwig-Soret effect by influencing the Soret coefficient, a ratio of Fickian and thermal diffusion coefficients (Niether & Wiegand, 2019). Proteins usually are “thermophobic”, meaning the thermophoresis of protein has a direction from the hot zone to the cold zone (Iacopini & Piazza, 2003). The thermophoresis of a protein typically differs from the thermophoresis of a protein-ligand complex something that can be evidenced as a change in the Soret coefficient.
A major advantage of MST over other fluorescence-related techniques is its ability to measure size changes and subtle changes in surface area, charge, or conformation upon a binding event. MST requires relatively small volumes and shorter times (within minutes), making it a relatively high throughput method (Rainard, Pandarakalam, & McElroy, 2018). Compared to non-fluorescence-based techniques such as SPR, MST does not require an immobilized system, which can give rise to surface effects (Baksh, Kussrow, Mileni, Finn, & Bornhop, 2011; Schuck, 1997). ITC, another label-free method which measures the enthalpy of a binding event in a time-dependent manner, requires large amounts of materials and longer times compared to MST (Wiseman, Williston, Brandts, & Lin, 1989). Compared to other fluorescence-based techniques, MST is sensitive to a broader range of physical changes (size, charge, hydration shell, conformation, among others). For example, fluorescence polarization (FP) measures the fluorescent molecule’s rotational motion, which only reflects the size change of the molecule (Dandliker & Feigen, 1961). This feature helps MST users determine binding affinity via a subtle shift in protein size, something that FP experiments cannot track.
Protein-protein interaction measurements are the focus of this protocol, with the goal of generating a dissociation constant KD. Competition assays can also be performed using MST. Moreover, MST experiments can also be used to study cooperativity in protein-protein binding, where a third component can serve as an allosteric regulator that might enhance or weaken the interaction between two proteins. A well-labeled protein can also be used in MST for the analysis of small molecule-protein interactions (Jerabek-Willemsen et al., 2011), making it amenable to drug discovery programs. Furthermore, nucleic acid-protein or nucleic acid-small molecule interactions can also be measured by MST to study gene expression and RNA macromolecular systems (Corbeski et al., 2018; Moon, Hilimire, Sanders, & Schneekloth Jr, 2018).
There are three types of commonly used reagents for fluorescent labeling of proteins for MST studies: 1) Amine labeling directly with NHS esters; 2) Cysteine labeling with a maleimide group; and 3) Multi-histidine tag labeling with a Ni+ fluorescent tag. However, these methods can result in non-selective, non-homogeneous labeling, which may affect the accuracy in the binding measurement. For example, cysteine and lysine residues might play essential roles for enzymatic functions or may be located at the binding interface, and the labeling of these important residues might affect the structure or function of the protein of interest (Spicer & Davis, 2014; Tonazzi, Giangregorio, Palmieri, & Indiveri, 2005). The His tag itself might change the charge or oligomeric states of proteins, and metals such as Ni+ that are used to coordinate fluorophores to the His tag may lead to unintended consequences (Booth et al., 2018). Also, a heterogeneous population may result in complex binding behaviors (Kastritis & Bonvin, 2013). N-terminal labeling with a thioester generated in situ from an NHS ester can circumvent these liabilities. As described in this protocol, single site (N-terminal cysteine) labeling and high stoichiometry are readily obtained. As the N-terminus of a protein is often unstructured and peripheral to function, the addition of fluorescent molecules to that site is generally well-tolerated.
Another advantage of the NHS ester labeling methods presented in this protocol is its compatibility with the vast number of commercially available NHS esters that include fluorophores NHS esters and crosslinkers, spin labels, and affinity tag NHS esters. In this sense, the application of the NHS ester labeling methods can be further extended beyond protein-protein interactions to proteomics studies, NMR-based structure studies, and signaling pathway studies, among others.
CRITICAL PARAMETERS
Choosing the fluorophore NHS ester
Users should choose the proper fluorophore NHS ester to use depending on instrument availability and detector channel (green, blue, or red) of the MST instrument. The stability and aqueous solubility of NHS esters also need to be considered. Some NHS esters may have high solubility in organic solvents but lower solubility in aqueous solutions. As organic solvents often tend to denature proteins, a fluorophore NHS ester that has better aqueous solubility should be preferred for protein labeling. An advantage of using NHS esters, as described in this protocol, is that over a thousand NHS esters are commercially available, providing a wide variety to choose from. Users can easily find alternatives for a specific detector channel. For example, the Cy5 dye is widely used for red detector channels; however, the Cy5-NHS ester poorly dissolves in an aqueous solution (~ 0.19 mM in buffered water). In this case, other Cy5 alternates, like Alexa Fluor 647 NHS ester, NT-647 NHS esters, or Sulfo-Cy5 NHS ester (>10 mM in buffered water) can be used instead.
On the other hand, the choice of the fluorophore NHS ester should also be based on the needs of the specific research project. Fluorophores differ in their extinction coefficient and quantum yield, and thus, some might be brighter with enhanced photostability (Brelje et al., 2002). Another factor that affects the MST measurement is the sensitivity of the detector. For example, as the Pico Red detector has higher sensitivity over the Nano Blue detector (lowest working concentration, 50 pM for Pico red versus 5 nM for Nano Blue), the Cy5 dye typically gives a higher fluorescence signal than fluorescein at the same concentration. When fluorescence intensity is a limiting factor in the MST measuring conditions, switching from fluorescein to the more expensive Cy5 label might help acquire better quality data. Other fluorophores in the red channel, such as NT. 647 and Alexa Fluor 647 are also recommended.
NHS ester concentration
The concentration of NHS ester is determined by the reaction needed but also influenced by the solubility of the reagent. In most cases, 1–2 mM NHS esters are recommended, as it is beneficial for it to be in large excess over the N-Cys containing protein, which usually ranges from 5 to 100 μM. In such a pseudo-first order reaction, the rate is proportional to the concentration of the NHS ester employed.
Labeling buffer
A proper labeling buffer composition keeps the protein stable throughout the labeling reaction. The reducing agent TCEP is added to prevent Cys oxidation to disulfides and other species. Other thiol-reducing reagents such as dithiothreitol (DTT) or β-mercaptoethanol (BME) should be avoided, as they may generate less reactive thioesters than MESNa. When labeling proteins with disulfide bonds, reducing agents like TCEP should be depleted in the reaction buffer and be avoided in buffers through the purification steps. Glycerol should be avoided in the labeling buffer as the impurities associated with it can react with the N-Cys and reduce reaction yield. After the labeling reaction is completed, which generates stable amide bonds, adding back glycerol for protein storage or stability purpose will not reverse the reaction.
Labeling Reaction Time
The recommended reaction time is 24–48 hours. Based on our experience, approximately 65% labeling occurs in 24 hours at room temperature, and the reaction plateaus by 48 hours. However, the reaction rate is also affected by temperature, ionic strength, and pH of the reaction, so users might need to adjust the reaction time based on specific reaction settings. In general, if cold temperature is desired because the labeled protein is unstable at room temperature, we recommend performing the reaction at 4°;C for 36–48 hrs. Usually, 24 hours are sufficient at room temperature; if the extent of labeling is low, the reaction can be extended for longer.
Labeling Reaction pH
A pH of 6.8–7.0 is recommended. Although raising the pH to 8 will generally increase the reactivity of the N-terminal Cys, it will also increase the reactivity of other primary amine groups, leading to non-specific labeling. It is also important to keep the pH at around 6.8–7.0 during the removal of excess dye by dialysis or with a desalting column, as elevating the pH at this step might lead to some non-specific labeling.
Quenching the reaction and removing the dye
Cysteamine or cysteine (50 −200 mM) are used for quenching the reaction, as they compete with N-Cys for reaction with the thioester. Adjust the pH of the quenching solution to pH 6.8–7.0 before adding it to the reaction. After quenching, expeditious removal of the excess dye molecules is beneficial to reduce non-specific interactions. As described in Basic Protocol 2, users should perform two rounds of dialysis for ca. 4–10 hours with dialysis tubing with the appropriate molecular weight cutoff; alternatively, 1–2 rounds with a desalting column should successfully remove over 99% of the residual dye. Further purification with size-exclusion column or ion-exchange chromatography is also recommended, to remove the residual dye or aggregated/degraded protein that, in rare cases, occurs during the labeling reaction.
Working concentration for the ligand and the target protein
In any binding experiment, the unlabeled ligand concentration should be carefully determined before the assay, since errors in ligand concentration will propagate into mischaracterizing the KD value. This applies to protein ligands but is crucial as well for other biopolymers and small molecules. If the binding is expected to be of high affinity, a lower stock concentration of the unlabeled ligand is acceptable. It should be noted that different detectors have different upper and lower detection limits. For example, 50 pM is the lower limit for the Pico Red detector, and for the Nano Blue detector, it is 5 nM. Further, regarding fluorescence intensity, the Nano Blue detector saturates at 2500 counts, and the Pico Red detector saturates at 25000 counts.
MST sample preparation
MST uses a small volume of protein; 8 μl of a sample can fill a capillary. However, we usually use a minimum of 20 μl in small plastic tubes to avoid volume alteration by evaporation, insufficient mixing, and pipetting errors. Choose the proper container for sample preparation (like PCR tubes) as higher volume tubes tend to have a high surface area, increasing the amount of protein that sticks to the tube’s walls.
Binding check experiment
A binding check experiment can be conducted before the standard MST measurement. It is a good way to know if the binding event triggers enough thermophoresis changes on a fluorescent-labeled protein to be measurable by an MST instrument. A two-point (zero and highest ligand concentration) MST measurement is performed before the serial titration binding affinity experiment. The low ligand concentration points represent the target protein’s unbound state, and the high ligand concentration points represent the bound state between the target protein and its ligand. Usually, if the unit difference in Fnorm is larger than 5 when comparing the unbound vs. bound state, it indicates that the serial titration experiment has a large enough signal vs. noise ratio to obtain the KD value from the MST measurement.
Analysis of the MST trace
A proper time range should be chosen for the analysis of MST traces. The default time range by MO. Affinity Analysis software to conduct analysis is 1.5, 2.5, 5, 10, 15, or 20 secs of on-time (time the laser is on). Generally, it is recommended to use the shortest on-time that gives a good signal to noise ratio. Using longer on-times are more likely to be associated with confounding convection effects.
TROUBLESHOOTING
Please see Table 1 for a list of common issues and potential solutions.
Table 1.
Troubleshooting Guide
| Issue | Possible reason | Solution |
|---|---|---|
| Low percentage of TEV/SUMO protease cleavage | The ratio of protease to the protein used is low; The protease activity is low; The cleaving buffer is not compatible with TEV/SUMO cleavage | Increase the protease amount, add and use fresh protease. TEV/SUMO protease activity can be inhibited by certain detergents (Vergis & Wiener, 2011). Consider conducting a buffer exchange to remove these detergents before adding the protease |
| NHS ester not fully dissolved | The NHS ester used has low aqueous solubility; The thioester conversion by MESNa is not complete; | Dissolve the NHS ester in a small amount of organic solvent (like DMSO) first and then dilute with aqueous buffer. Consider a change to a more soluble form of the NHS ester. Extend the MESNa treatment time to allow full conversion. |
| Protein precipitation during the concentration process | Protein has low solubility or is sensitive to mechanical force | Add glycerol (to a final concentration of 10% v/v) before the start of the concentration process. Adjust the concentration temperature from 4°C to 18°C as temperature may improve solubility. Avoid doing long centrifuge runs (>10 min) and gently mix the protein solution in between the runs, or use ammonium sulfate precipitation to concentrate the protein. |
| Low labeling efficiency | The protein or NHS ester concentration in the labeling reaction is too low; N-terminal Cys of the target protein is oxidized | The protein concentration is directly related to the reaction rate. Try to concentrate the protein first before mixing with the thioester labeling reagents. Add reducing agent (1 mM TCEP is recommended) during the protein purification and labeling processes to protect the Cys from oxidation/forming a disulfide bond. Obtaining near stoichiometric (>90%) labeling is hard to achieve and unnecessary, especially when the KD is much greater than the target protein concentration. However, as the unlabeled protein is still capable of binding to the ligand and affecting the equilibrium, it is important to consider the total protein concentration and not just the concentration of labeled protein in KD calculations. |
| High non-specific labeling | NHS ester is not fully converted to the thioester; Labeling reaction time is conducted for too long, or pH is not maintained in the range of 6.8–7.0 | Extend the MESNa incubation time or increase MESNa concentration. The NHS ester itself does not have N-terminal Cys labeling selectivity; it needs to be fully converted to thioester by MESNa. Or decrease the NHS ester concentration used to 1 or 0.5 mM. Shorten the labeling reaction time from 24 hr to 6 or 12 hr. Lower the reaction buffer pH from 6.8 to 6 or 6.5. |
| The fluorescence signal is too low for MST | Target protein concentration used is too low; the LCD excitation power is too low | Increase the fluorescent-labeled protein concentration. Increase the LCD power |
| Fluorescence intensity is too high for MST | Too much target protein is used; the LCD excitation power is set too high. | Lower the fluorescent-labeled protein concentration. Lower the LCD power |
| High variation in fluorescent intensity among capillaries | The target protein is not mixed well; Large pipetting error; Buffer dilution effect; Potential aggregation | Mix the target protein well when diluting or mixing with the ligand. Carefully perform the pipetting and double-check the volume after each pipetting step. The buffer used to prepare the dilution steps should be of precisely the same composition as the ligand working solution. Centrifuge the samples after thawing before starting the experiment. |
| Sticking or adsorption to the capillary surface, the fluorescence peak shows a shoulder peak or asymmetric peak. | The standard capillary glass surface is prone to have protein stick to it; The target protein is less stable and tends to stick to the glass surface | Use premium capillaries (NanoTemper MO-K025); Add different detergents in the assay buffer, like NP40 (0.01–0.05%) or Pluronic F-127 (0.01–0.05%); Add stabilizing additives such as BSA, casein to the assay buffer. |
| Aggregation during MST measurement | Target protein or ligand is not stable | Use premium capillaries. Optimize the assay buffer condition (detergents, additives, salt concentration, pH). MST utilizes an IR laser to generate the thermal gradient. During the thermal gradient (2–6℃), a portion of protein might be destabilized and start to aggregate. Lowering the MST power might help. |
| Ligand-induced fluorescence change | Fluorescence quenching enhancement by the ligand; Ligand-induced aggregation or non-specific adsorption to the capillary | Perform SD-test, a solubility test of denatured samples in SDS. To do this, 10 μl supernatant from tubes 1–3 (high ligand concentration) and tubes 14–16 (lowest ligand concentration) of the MST mix are transferred and mixed with 10 μl of 4% SDS, 40 mM DTT. The samples are incubated at 95°C for 5 min. Fill the capillaries with the incubated samples and record the fluorescence intensity. If fluorescence intensity from all samples is identical, the intensity change is due to a binding event. Binding-induced fluorescence changes can then directly determine the binding affinity. Otherwise, optimize the assay condition to prevent aggregation or adsorption |
| Low signal to noise ratio in the MST curve | The ligand concentration is too low compared to KD; The binding induced thermophoresis cannot be readily discriminated from background noise | Increase ligand working concentration. Adjust the MST power, buffer composition, labeling dye, and ligand concentration. Moreover, the assay design can be reversed by swapping the labeling reaction from the target protein to the ligand. |
UNDERSTANDING RESULTS
By following the labeling and purification procedure described in Basic Protocol 1 (or Alternate Protocol 1) and Basic Protocol 2, users can obtain an N-terminal fluorescent labeled protein of interest. Following Basic Protocol 3, the binding affinity of the labeled protein of interest to an unlabeled binding protein partner can be accurately measured by MST binding assays.
As we describe in the example outlined in Basic Protocol 4, we generate N-terminal fluorescein labeled protein FAM-WWP2 using 5/6-carboxyfluorescein NHS ester. The FAM-WWP2 is purified to be at 2 mg/ml concentration, with around 80% labeling efficiency. We use a working concentration of FAM-WWP2 at 50 nM in the MST binding assay. We also prepare the ligand E2 protein with a working concentration of 1.5 mM. With the MST pre-test, MST assay conditions are validated, as shown by symmetric fluorescence peak with around 300 intensity, and smooth MST traces are obtained (Figure 4A and 4B). We prepare 16 serial ligand E2 concentrations by 1:2 dilution and measure the binding affinity to FAM-WWP2 in the MST binding assay. The capillary scan and MST traces are recorded with symmetric fluorescence peaks and smooth MST curves (Figure 4C and 4D). After gathering data from three MST measurement replicates, we use the Monolith analysis software MO. Affinity Analysis to fit the binding data. We plot a dose-response curve and select the KD model to calculate the binding affinity between E2 and WWP2 protein. The final calculated KD value is 9.6 ± 1.1 μM (Figure 4E).
TIME CONSIDERATIONS
There are mainly two components for consideration in this protocol: NHS ester labeling and MST binding assays. A general outline of the timeline to complete each step for the study of a protein of interest and its binding to one ligand is given below, which may vary by protein expression systems, protein characteristics, and MST instrument/detector.
Protein expression and purification (for the target and binding partner): 3 days to 6 weeks (highly dependent on the expression system used)
Labeling the protein N-terminal with NHS esters: 2–3 days
Purification of N-terminal labeled protein: 1–3 days
MST measurements of protein binding affinity: 1–2 days
ACKNOWLEDGMENTS
We thank Dr. Kelly Arnett for the helpful comments and discussion, and the Center for Macromolecular Interactions at the Harvard Medical School Department of Biological Chemistry and Molecular Pharmacology for assistance with MST measurements. We thank the National Institutes of Health for grant funding (R01CA74305).
Footnotes
CONFLICT OF INTEREST
The authors declare there are no conflicts of interest.
LITERATURE CITED
- Anderson GW (1964). The Use of Activated Esters in Peptide Synthesis. Metabolism, 13, SUPPL:1026–1031. doi: 10.1016/s0026-0495(64)80022-6 [DOI] [PubMed] [Google Scholar]
- Antos JM, Chew G-L, Guimaraes CP, Yoder NC, Grotenbreg GM, Popp MW-L, & Ploegh HL (2009). Site-specific N- and C-terminal labeling of a single polypeptide using sortases of different specificity. J. Am. Chem. Soc, 131(31), 10800–10801. doi: 10.1021/ja902681k [DOI] [PMC free article] [PubMed] [Google Scholar]
- Asmari M, Ratih R, Alhazmi HA, & El Deeb S (2018). Thermophoresis for characterizing biomolecular interaction. Methods, 146, 107–119. doi: 10.1016/j.ymeth.2018.02.003 [DOI] [PubMed] [Google Scholar]
- Baksh MM, Kussrow AK, Mileni M, Finn MG, & Bornhop DJ (2011). Label-free quantification of membrane-ligand interactions using backscattering interferometry. Nat. Biotechnol, 29(4), 357–360. doi: 10.1038/nbt.1790 [DOI] [PMC free article] [PubMed] [Google Scholar]
- Berndsen CE, & Wolberger C (2014). New insights into ubiquitin E3 ligase mechanism. Nat Struct Mol Biol, 21(4), 301–307. doi: 10.1038/nsmb.2780 [DOI] [PubMed] [Google Scholar]
- Booth WT, Schlachter CR, Pote S, Ussin N, Mank NJ, Klapper V, … Chruszcz M (2018). Impact of an N-terminal Polyhistidine Tag on Protein Thermal Stability. ACS Omega, 3(1), 760–768. doi: 10.1021/acsomega.7b01598 [DOI] [PMC free article] [PubMed] [Google Scholar]
- Braun D, & Libchaber A (2002). Trapping of DNA by thermophoretic depletion and convection. Physical review letters, 89(18), 188103. [DOI] [PubMed] [Google Scholar]
- Brooks DJ, Fresco JR, Lesk AM, & Singh M (2002). Evolution of amino acid frequencies in proteins over deep time: inferred order of introduction of amino acids into the genetic code. Mol. Biol. Evol, 19(10), 1645–1655. doi: 10.1093/oxfordjournals.molbev.a003988 [DOI] [PubMed] [Google Scholar]
- Carrico IS, Carlson BL, & Bertozzi CR (2007). Introducing genetically encoded aldehydes into proteins. Nat. Chem. Biol, 3(6), 321–322. doi: 10.1038/nchembio878 [DOI] [PubMed] [Google Scholar]
- Chang TK, Jackson DY, Burnier JP, & Wells JA (1994). Subtiligase: a tool for semisynthesis of proteins. Proc. Natl. Acad. Sci. U. S. A, 91(26), 12544–12548. doi: 10.1073/pnas.91.26.12544 [DOI] [PMC free article] [PubMed] [Google Scholar]
- Chen Z, Jiang H, Xu W, Li X, Dempsey DR, Zhang X, … Cole PA (2017). A Tunable Brake for HECT Ubiquitin Ligases. Molecular Cell, 66(3), 345–357.e346. doi: 10.1016/j.molcel.2017.03.020 [DOI] [PMC free article] [PubMed] [Google Scholar]
- Corbeski I, Horn V, Van Der Valk RA, Le Paige UB, Dame RT, & Van Ingen H (2018). Microscale thermophoresis analysis of chromatin interactions In Bacterial Chromatin (pp. 177–197): Springer. [DOI] [PubMed] [Google Scholar]
- Cravatt BF, Wright AT, & Kozarich JW (2008). Activity-based protein profiling: from enzyme chemistry to proteomic chemistry. Annu. Rev. Biochem, 77, 383–414. doi: 10.1146/annurev.biochem.75.101304.124125 [DOI] [PubMed] [Google Scholar]
- Crivat G, & Taraska JW (2012). Imaging proteins inside cells with fluorescent tags. Trends Biotechnol, 30(1), 8–16. doi: 10.1016/j.tibtech.2011.08.002 [DOI] [PMC free article] [PubMed] [Google Scholar]
- Dandliker WB, & Feigen GA (1961). Quantification of the antigen-antibody reaction by the polarization of fluorescence. Biochemical and Biophysical Research Communications, 5(4), 299–304. doi: 10.1016/0006-291x(61)90167-x [DOI] [PubMed] [Google Scholar]
- Dawson PE, & Kent SB (2000). Synthesis of native proteins by chemical ligation. Annu. Rev. Biochem, 69, 923–960. doi: 10.1146/annurev.biochem.69.1.923 [DOI] [PubMed] [Google Scholar]
- Dawson PE, Muir TW, Clark-Lewis I, & Kent SB (1994). Synthesis of proteins by native chemical ligation. Science, 266(5186), 776–779. doi: 10.1126/science.7973629 [DOI] [PubMed] [Google Scholar]
- Dempsey DR, Jiang H, Kalin JH, Chen Z, & Cole PA (2018). Site-Specific Protein Labeling with N-Hydroxysuccinimide-Esters and the Analysis of Ubiquitin Ligase Mechanisms. J Am Chem Soc, 140(30), 9374–9378. doi: 10.1021/jacs.8b05098 [DOI] [PMC free article] [PubMed] [Google Scholar]
- Duhr S, & Braun D (2006). Why molecules move along a temperature gradient. Proceedings of the National Academy of Sciences, 103(52), 19678–19682. doi: 10.1073/pnas.0603873103 [DOI] [PMC free article] [PubMed] [Google Scholar]
- Friedmann E (1952). Spectrophotometric investigation of the interaction of glutathione with maleimide and n-ethylmaleimide. Biochim. Biophys. Acta, 9(1), 65–75. doi: 10.1016/0006-3002(52)90121-2 [DOI] [PubMed] [Google Scholar]
- Gallagher SR (2012). One‐dimensional SDS gel electrophoresis of proteins. Current protocols in molecular biology, 97(1), 10.12 A. 11–10.12 A. 44. [DOI] [PubMed] [Google Scholar]
- Gallagher SR, & Sasse J (2012). Staining proteins in gels. Current Protocols Essential Laboratory Techniques, 6(1), 7.4. 1–7.4. 14. [Google Scholar]
- Harper S, & Speicher DW (2008). Expression and purification of GST fusion proteins. Current Protocols in Protein Science, 52(1), 6.6. 1–6.6. 26. [DOI] [PubMed] [Google Scholar]
- Henager SH, Chu N, Chen Z, Bolduc D, Dempsey DR, Hwang Y, … Cole PA (2016). Enzyme-catalyzed expressed protein ligation. Nat Methods, 13(11), 925–927. doi: 10.1038/nmeth.4004 [DOI] [PMC free article] [PubMed] [Google Scholar]
- Hunter M, Yuan P, Vavilala D, & Fox M (2019). Optimization of protein expression in mammalian cells. Current Protocols in Protein Science, 95(1), e77. [DOI] [PubMed] [Google Scholar]
- Iacopini S, & Piazza R (2003). Thermophoresis in protein solutions. EPL (Europhysics Letters), 63(2), 247. [Google Scholar]
- Jerabek-Willemsen M, Wienken CJ, Braun D, Baaske P, & Duhr S (2011). Molecular interaction studies using microscale thermophoresis. Assay Drug Dev. Technol, 9(4), 342–353. doi: 10.1089/adt.2011.0380 [DOI] [PMC free article] [PubMed] [Google Scholar]
- Jiang H, D’Agostino GD, Cole PA, & Dempsey DR (2020). Selective protein N-terminal labeling with N-hydroxysuccinimide esters. Methods Enzymol, 639, 333–353. doi: 10.1016/bs.mie.2020.04.018 [DOI] [PMC free article] [PubMed] [Google Scholar]
- Jiang H, Thomas SN, Chen Z, Chiang CY, & Cole PA (2019). Comparative analysis of the catalytic regulation of NEDD4–1 and WWP2 ubiquitin ligases. J Biol Chem, 294(46), 17421–17436. doi: 10.1074/jbc.RA119.009211 [DOI] [PMC free article] [PubMed] [Google Scholar]
- Kamadurai HB, Souphron J, Scott DC, Duda DM, Miller DJ, Stringer D, … Schulman BA (2009). Insights into ubiquitin transfer cascades from a structure of a UbcH5B approximately ubiquitin-HECT(NEDD4L) complex. Mol Cell, 36(6), 1095–1102. doi: 10.1016/j.molcel.2009.11.010 [DOI] [PMC free article] [PubMed] [Google Scholar]
- Kastritis PL, & Bonvin AM (2013). On the binding affinity of macromolecular interactions: daring to ask why proteins interact. Journal of The Royal Society Interface, 10(79), 20120835. [DOI] [PMC free article] [PubMed] [Google Scholar]
- Kuzmanov U, & Emili A (2013). Protein-protein interaction networks: probing disease mechanisms using model systems. Genome medicine, 5(4), 1–12. [DOI] [PMC free article] [PubMed] [Google Scholar]
- Metzger MB, Hristova VA, & Weissman AM (2012). HECT and RING finger families of E3 ubiquitin ligases at a glance. J Cell Sci, 125(Pt 3), 531–537. doi: 10.1242/jcs.091777 [DOI] [PMC free article] [PubMed] [Google Scholar]
- Mohapatra S, Lin C-T, Feng XA, Basu A, & Ha T (2020). Single-Molecule Analysis and Engineering of DNA Motors. Chem. Rev, 120(1), 36–78. doi: 10.1021/acs.chemrev.9b00361 [DOI] [PubMed] [Google Scholar]
- Moon MH, Hilimire TA, Sanders AM, & Schneekloth JS Jr (2018). Measuring RNA–ligand interactions with microscale thermophoresis. Biochemistry, 57(31), 4638–4643. [DOI] [PMC free article] [PubMed] [Google Scholar]
- Muir TW, Sondhi D, & Cole PA (1998). Expressed protein ligation: a general method for protein engineering. Proc Natl Acad Sci U S A, 95(12), 6705–6710. Retrieved from https://www.ncbi.nlm.nih.gov/pubmed/9618476 [DOI] [PMC free article] [PubMed] [Google Scholar]
- Niether D, & Wiegand S (2019). Thermophoresis of biological and biocompatible compounds in aqueous solution. Journal of Physics: Condensed Matter, 31(50), 503003. [DOI] [PubMed] [Google Scholar]
- Noren CJ, Anthony-Cahill SJ, Griffith MC, & Schultz PG (1989). A general method for site-specific incorporation of unnatural amino acids into proteins. Science, 244(4901), 182–188. doi: 10.1126/science.2649980 [DOI] [PubMed] [Google Scholar]
- Olson BJ (2016). Assays for determination of protein concentration. Current Protocols in Pharmacology, 73(1), A. 3A. 1–A. 3A. 32. [DOI] [PubMed] [Google Scholar]
- Patching SG (2014). Surface plasmon resonance spectroscopy for characterisation of membrane protein–ligand interactions and its potential for drug discovery. Biochimica et Biophysica Acta (BBA)-Biomembranes, 1838(1), 43–55. [DOI] [PubMed] [Google Scholar]
- Rainard JM, Pandarakalam GC, & McElroy SP (2018). Using Microscale Thermophoresis to Characterize Hits from High-Throughput Screening: A European Lead Factory Perspective. SLAS Discov, 23(3), 225–241. doi: 10.1177/2472555217744728 [DOI] [PMC free article] [PubMed] [Google Scholar]
- Rao VS, Srinivas K, Sujini G, & Kumar G (2014). Protein-protein interaction detection: methods and analysis. International journal of proteomics, 2014. [DOI] [PMC free article] [PubMed] [Google Scholar]
- Reineck P, Wienken CJ, & Braun D (2010). Thermophoresis of single stranded DNA. Electrophoresis, 31(2), 279–286. [DOI] [PubMed] [Google Scholar]
- Rotin D, & Kumar S (2009). Physiological functions of the HECT family of ubiquitin ligases. Nat Rev Mol Cell Biol, 10(6), 398–409. doi: 10.1038/nrm2690 [DOI] [PubMed] [Google Scholar]
- Russ Algar W, Medintz IL, & Dawson P (2017). Chemoselective and Bioorthogonal Ligation Reactions: Concepts and Applications: John Wiley & Sons. [Google Scholar]
- Rusu L, Gambhir A, McLaughlin S, & Rädler J (2004). Fluorescence correlation spectroscopy studies of peptide and protein binding to phospholipid vesicles. Biophysical journal, 87(2), 1044–1053. [DOI] [PMC free article] [PubMed] [Google Scholar]
- Saxon E, Armstrong JI, & Bertozzi CR (2000). A “traceless” Staudinger ligation for the chemoselective synthesis of amide bonds. Org. Lett, 2(14), 2141–2143. doi: 10.1021/ol006054v [DOI] [PubMed] [Google Scholar]
- Schendel PF (1998). Overview of Protein Expression in E. coli. Current protocols in molecular biology, 41(1), 16.11. 11–16.11. 13. [DOI] [PubMed] [Google Scholar]
- Schuck P (1997). Use of surface plasmon resonance to probe the equilibrium and dynamic aspects of interactions between biological macromolecules. Annu. Rev. Biophys. Biomol. Struct, 26, 541–566. doi: 10.1146/annurev.biophys.26.1.541 [DOI] [PubMed] [Google Scholar]
- Schwarzer D, & Cole PA (2005). Protein semisynthesis and expressed protein ligation: chasing a protein’s tail. Curr Opin Chem Biol, 9(6), 561–569. doi: 10.1016/j.cbpa.2005.09.018 [DOI] [PubMed] [Google Scholar]
- Seidel SA, Dijkman PM, Lea WA, van den Bogaart G, Jerabek-Willemsen M, Lazic A, … Simeonov A (2013). Microscale thermophoresis quantifies biomolecular interactions under previously challenging conditions. Methods, 59(3), 301–315. [DOI] [PMC free article] [PubMed] [Google Scholar]
- Skipper M (2005). A protein network of one’s own proteins. Nature Reviews Genetics, 6(11), 800–800. doi: 10.1038/nrg1731 [DOI] [Google Scholar]
- Snapp E (2005). Design and use of fluorescent fusion proteins in cell biology. Curr Protoc Cell Biol , Chapter 21, 21 24 21–21 24 13. doi: 10.1002/0471143030.cb2104s27 [DOI] [PMC free article] [PubMed] [Google Scholar]
- Spicer CD, & Davis BG (2014). Selective chemical protein modification. Nature Communications, 5(1), 1–14. [DOI] [PubMed] [Google Scholar]
- Stelzl U, Worm U, Lalowski M, Haenig C, Brembeck FH, Goehler H, … Koeppen S. (2005). A human protein-protein interaction network: a resource for annotating the proteome. Cell, 122(6), 957–968. [DOI] [PubMed] [Google Scholar]
- Terpetschnig E, Szmacinski H, Ozinskas A, & Lakowicz JR (1994). Synthesis of squaraine-N-hydroxysuccinimide esters and their biological application as long-wavelength fluorescent labels. Anal Biochem, 217(2), 197–204. doi: 10.1006/abio.1994.1109 [DOI] [PubMed] [Google Scholar]
- Tighe PJ, Ryder RR, Todd I, & Fairclough LC (2015). ELISA in the multiplex era: potentials and pitfalls. PROTEOMICS–Clinical Applications, 9(3–4), 406–422. [DOI] [PMC free article] [PubMed] [Google Scholar]
- Tonazzi A, Giangregorio N, Palmieri F, & Indiveri C (2005). Relationships of Cysteine and Lysine residues with the substrate binding site of the mitochondrial ornithine/citrulline carrier: an inhibition kinetic approach combined with the analysis of the homology structural model. Biochimica et Biophysica Acta (BBA)-Biomembranes, 1718(1–2), 53–60. [DOI] [PubMed] [Google Scholar]
- Velazquez-Campoy A, Leavitt SA, & Freire E (2004). Characterization of protein-protein interactions by isothermal titration calorimetry In Protein-Protein Interactions (pp. 35–54): Springer. [DOI] [PubMed] [Google Scholar]
- Vergis JM, & Wiener MC (2011). The variable detergent sensitivity of proteases that are utilized for recombinant protein affinity tag removal. Protein expression and purification, 78(2), 139–142. [DOI] [PMC free article] [PubMed] [Google Scholar]
- Wieland T, Bokelmann E, Bauer L, Lang HU, & Lau H (1953). Über Peptidsynthesen. 8. Mitteilung Bildung von S-haltigen Peptiden durch intramolekulare Wanderung von Aminoacylresten. Justus Liebigs Annalen der Chemie, 583(1), 129–149. doi: 10.1002/jlac.19535830110 [DOI] [Google Scholar]
- Wienken CJ, Baaske P, Rothbauer U, Braun D, & Duhr S (2010). Protein-binding assays in biological liquids using microscale thermophoresis. Nature Communications, 1(1). doi: 10.1038/ncomms1093 [DOI] [PubMed] [Google Scholar]
- Wingfield PT (2014). Preparation of soluble proteins from Escherichia coli. Current Protocols in Protein Science, 78(1), 6.2. 1–6.2. 22. [DOI] [PMC free article] [PubMed] [Google Scholar]
- Wiseman T, Williston S, Brandts JF, & Lin L-N (1989). Rapid measurement of binding constants and heats of binding using a new titration calorimeter. Analytical Biochemistry, 179(1), 131–137. doi: 10.1016/0003-2697(89)90213-3 [DOI] [PubMed] [Google Scholar]
- Xie Y, Han X, & Miao Y (2018). An effective recombinant protein expression and purification system in Saccharomyces cerevisiae. Current protocols in molecular biology, 123(1), e62. [DOI] [PubMed] [Google Scholar]
- Yau R, & Rape M (2016). The increasing complexity of the ubiquitin code. Nat Cell Biol, 18(6), 579–586. doi: 10.1038/ncb3358 [DOI] [PubMed] [Google Scholar]