

Abstract
Objective:
The goal of these studies is to discover novel urinary biomarkers of lupus nephritis (LN).
Methods:
Urine from systemic lupus erythematosus (SLE) patients were interrogated for 1000 proteins using a novel, quantitative planar protein microarray. Hits were validated in an independent SLE cohort with inactive, active non-renal (ANR), and active renal (AR) patients, in a cohort with concurrent renal biopsies, and in a longitudinal cohort. Single-cell renal RNA sequence data from LN kidneys was examined to deduce the cellular origin of each biomarker.
Results:
Screening of 1000 proteins revealed 64 proteins to be significantly elevated in SLE urine, of which 17 were ELISA validated in independent cohorts. Urine Angptl4 (AUC=0.96), L-selectin (AUC=0.86), TPP1 (AUC=0.84), TGFβ1 (AUC=0.78), TSP-1 (AUC=0.73), FOLR2 (AUC=0.72), PDGFRβ (AUC=0.67), and PRX2 (AUC=0.65), distinguished active renal from ANR SLE, outperforming anti-DNA, C3 and C4, in terms of specificity, sensitivity, and PPV. In multivariate regression analysis, urine Angptl4, L-selectin, TPP1 and TGFβ1 were highly associated with disease activity, even after correction for demographic variables. In SLE patients with serial follow-up, urine L-selectin (followed by urine Angptl4 and TGFβ1) were best at tracking concurrent or pending disease flares. Importantly, several proteins elevated in LN urine were also expressed within the kidneys in LN, either within resident renal cells or infiltrating immune cells, based on single-cell RNA-sequence analysis.
Conclusion:
Unbiased planar array screening of 1000 proteins has led to the discovery of urine Angptl4, L-selectin, and TGFβ1 as potential biomarker candidates for tracking disease activity in LN.
Introduction
Systemic lupus erythematosus (SLE), a chronic autoimmune disease, has been widely investigated for biomarkers in recent years (1–3). Of importance is discovering biomarkers from biological samples that do not require an invasive procedure to acquire and that can differentiate between SLE patients with or without lupus nephritis (LN), a leading cause of morbidity and mortality in these patients. This could potentially result in the gold-standard of a renal biopsy being replaced with urine testing, as this could greatly facilitate longitudinal monitoring at frequent intervals in order to closely track disease progression and tailor therapy accordingly (4).
Most methods utilized previously for biomarker detection have adopted a biased philosophy, based on exploring established pathophysiological pathways associated with SLE, e.g., inflammation (5), or growth factor pathways (6). While useful, these approaches limit the discovery of novel biomarkers and their associated pathways. In recent years, several approaches have been used for unbiased biomarker screens, including mass spectrometry (7,8), and electrospray ionization quadrupole time-of-flight tandem mass spectrometry (ESI-Q-TOF MS/MS) (9).
In contrast to the above mass-spectrometry based approaches, which are typically overwhelmed with high abundance proteins, affinity-based approaches using various ligands (such as antibodies) have the potential to uncover lower abundance proteins, due to the use of specific, high-affinity ligands. A few screening studies in lupus have utilized affinity-based techniques such as antibody-based or aptamer-based assays (10–13).
In this study, we have used a novel glass slide based protein microarray to screen and quantify 1000 proteins in order to identify potential urinary biomarkers for renal involvement in patients with SLE. Unlike most planar arrays, which only provide relative expression between samples, this array uniquely utilizes an 8-point curve for each protein, allowing for a concentration to be derived for each of the 1000 proteins interrogated. This platform has been successfully used in previous investigations including the study of breast cancer (14), and cell culture secretomes (15,16). As of writing, this paper will be the first to use this novel platform not only for the unbiased screening of an autoimmune disease, but also the first to use this assay as a biomarker screening technique.
Using this platform, an initial cohort of SLE patients was interrogated for the concentrations of 1000 proteins in the urine. From this initial screening, 17 urine proteins were selected for ELISA validation in an independent cohort. Eight urine proteins exhibited the ability to significantly distinguish active renal from active non-renal SLE: L-selectin, Angptl4, TGFβ1, TPP1, TSP-1, PRX2, FOLR2 and PDGFRβ. The combination of urine Angptl4 and TPP offered the best discrimination of active LN from active non-renal lupus, with an AUC of 0.98. Angptl4, L-selectin, TGFβ1, and TPP1 also showed potential in monitoring disease activity during longitudinal follow-up. Published single cell RNA sequence (scRNAseq) data from LN renal biopsies shed further light on potential cellular sources of each of these urinary biomarker candidates within the kidneys.
Materials and Methods
Patients, Sample Collection and Sample Preparation
Urine samples from four cohorts of SLE patients were used in this study, including: 1) a discovery SLE cohort for the 1000-plexed protein array screen, 2) a cross-sectional cohort of SLE patients for primary validation, 3) a concurrent cohort of LN with urine samples obtained at the time of renal biopsy, and 4) a longitudinal cohort of SLE patients who had been serially followed up 5 times or more, with at least one inter-visit interval being ≤2 months, for further validation. An additional cohort of patients with chronic kidney diseases (CKD) was used as controls, in addition to healthy controls. Urine samples were obtained from John Hopkins University School of Medicine (Baltimore, MD), Albert Einstein College of Medicine (Bronx, NY), and UT Southwestern Medical center (UTSW, Dallas, TX) with informed consent. The study was approved by the institutional review boards of John Hopkins University School of Medicine, Albert Einstein College of Medicine, UTSW and the University of Houston. Patients or the public WERE NOT involved in the design, or conduct, or reporting, or dissemination of this research. Lupus patients with renal failure and pediatric patients were excluded from this study. “Clean-catch midstream” urine samples were collected in sterile containers and either placed on ice or refrigerated within one hour of sample collection. The samples were then aliquoted and stored at −80°C.
During the sample collection visit, the lupus patients were assessed by the clinician and the following data were documented: Systemic Lupus Erythematosus Disease Activity Index (SLEDAI), renal domains of SLEDAI (rSLEDAI), physician global assessment (PGA), weight, blood pressure, complete blood count, erythrocyte sedimentation rate, creatinine, cholesterol, C3, C4, anti-dsDNA, urinalysis, and urine protein/creatinine (UrPrCr) ratio. For all lupus patients, the hybrid SLEDAI was used, where proteinuria was scored if >0.5g/24h. The rSLEDAI summates the renal components of the SLEDAI, including hematuria (>5 red blood cells/high-power field), pyuria (>5 white blood cells/high-power field), proteinuria (>0.5 g/24h) and urinary casts. In the cross-sectional SLE cohort for primary validation, SLE patients were classified into three groups. Active LN (AR) was defined as biopsy-proven LN with rSLEDAI ≥ 4. None of the active LN patients in this study had isolated hematuria or pyuria. Active non-renal SLE patients (ANR) had SLEDAI ≥5, and rSLEDAI=0. The Inactive or low disease activity group included SLE patients with SLEDAI ≤ 2, all of whom had no clinically activity, except for 1 patient with alopecia, and one with thrombocytopenia. In the concurrent cohort of LN patients where urine samples were obtained at the time of renal biopsy, patients were categorized according to the LN classes.
1000-plexed Protein Array Screen
A discovery cohort of 24 subjects (HC=9; SLE=15 (SLEDAI >0)) was used for the initial screen. Please see Supplementary Table S1 for demographics and clinical features of these subjects. All 15 SLE patients used for screening had active SLE, 12 of whom had renal involvement and rSLEDAI ≥ 4. All urine samples were clarified by centrifugation before application to the arrays. All urine samples were screened using the Kiloplex Quantibody protein array platform purchased from Raybiotech Life (QAH-CAA-X00, Norcross, GA). The list of the 1000 proteins assayed is available at: https://www.raybiotech.com/files/manual/Antibody-Array/QAH-CAA-X00.pdf. The capture antibody for each protein was spotted in quadruplicate onto a glass surface to create the array. Therefore, an n=4 is used for each protein concentration measurement, as these arrays use an 8-point standard curve for each of the 1000 proteins. Briefly, all samples are diluted to yield a total protein concentration within the working range (500 ug/mL – 1 mg/mL). Protein standards and urine samples were incubated on the array for 2 hours, to allow the proteins to bind to the antibodies. Following washing, a biotinylated antibody cocktail (comprised of 1000 detection antibodies) was added and left to incubate for 2 hours. Finally, streptavidin-Cy3 was added and left to incubate for 1 hour. After a final wash and dry, the slides were read with a fluorescent scanner. Data were then extracted from the image using vendor-provided GAL file using compatible microarray analysis software. All data were creatinine normalized before analysis (KGE005, R&D Systems, Inc., Minneapolis, MN).
Validation Studies using ELISA
For the primary validation study, urine from 78 subjects in the cross-sectional cohort were included, comprised of 16 healthy controls and 17 inactive or low disease activity (SLEDAI ≤ 2), 16 ANR (SLEDAI ≥ 5, rSLEDAI = 0), and 29 AR (rSLEDAI ≥4) SLE patients, as described above (Supplementary Table S2). Importantly, both the ANR and AR groups had comparable SLEDAI scores. Identified biomarkers were validated using ELISA assays, following manufacturer instructions. Briefly, to assay each protein, urine samples at an optimal dilution were added to a microplate precoated with capture antibody, incubated, washed, and followed by addition of capture antibody, horseradish peroxidase, and substrate. The absolute levels of urine protein biomarkers were determined using standard curves run on each ELISA plate, and normalized by urine creatinine concentration. Promising biomarkers were further validated using ELISA in additional patient cohorts, including a renal-biopsy concurrent cohort, a longitudinal cohort, and a CKD control cohort.
Statistics
All data were plotted and analyzed using GraphPad Prism 7 (GraphPad, San Diego, CA), Microsoft Excel, or R. All data in this study were analyzed using the Mann-Whitney U test, as several datasets were not normally distributed. Likewise, the Spearman and Pearson methods were used for the correlation analysis. One was added to all biomarker measurements, then log-transformed to base 2. To examine the relationship between an individual biomarker and outcomes, we performed logistic regression models for active lupus nephritis, and linear regression models for continuous outcomes including physician global assessment (PGA) scores and rSLEDAI. For each outcome, models were ran to control for race, race and age. For each model, q-values were computed for each biomarker. Sensitivity, specificity, area under the receiver operating curve analysis from, predictive positive value, and negative predictive value were calculated using the easyROC software.
For analysis of longitudinal data, 2 approaches were taken. To determine which urine biomarker best tracked with disease activity metrics serially, we first ran multilevel linear models with patient IDs as random intercepts regressing on each individual biomarker and compared the Akaike information criterion values among models, using the lme4 and bbmle packages in R. Next, we also ran LASSO for multilevel linear models with patient IDs as random intercepts for biomarker selection, using glmmLasso and lmmen packages in R.
Heatmap, Cluster Analysis, Volcano Plot, Random Forest classification, and Bayesian network analysis
Data from the protein array screening assay were used to generate a heatmap which clustered proteins with similar expression patterns together. The data from each group were imported into R for clustering analysis and heatmap generation. For clustering, proteins were clustered in an unsupervised manner based on Euclidean distance. R was then used to generate a volcano plot of log2 fold change of expression versus the −log10 p-value, as determined by Mann-Whitney U test. 302 urine proteins were elevated at FC>2, at p≤0.05, and 82 proteins were found to be elevated at FC>5, at p≤0.001, comparing SLE samples to healthy control urine.
Random Forest Classification analysis, a machine learning algorithm for dimensionality reduction, was executed using R, with 1000 bootstrap sampling iterations, in order to identify the relative importance of each biomarker in disease classification, using the GINI index. For the top 20 urine biomarker proteins identified by random forest classification, the fold changes in SLE versus healthy controls were plotted as a radial plot, using Excel.
Ingenuity Pathway Analysis was used to determine which known pathway networks were enriched by ranking the proteins based on fold-change and p-values that were significantly over-expressed in SLE urine compared to controls. The ranked genes were searched using the QIAGEN Knowledge Base® to find pathways that contained these proteins. This knowledge base was curated from various literature sources and included direction of effect of molecule in a network as documented in the referencing publications. The Canonical Pathways were ranked by p-values of overlap, calculated using right-tailed Fisher’s exact test.
Bayesian network analysis was performed using the BayesiaLab software (Bayesia, version 7.0.1), and the following parameters: the urine levels of 9 protein biomarkers, demographics, disease features or measures (proteinuria, pyuria, hematuria, SLEDAI, rSLEDAI, PGA), as well as various laboratory measures. Continuous data were discretized into 3 bins using the R2-GenOpt algorithm and the Maximum Weight Spanning Tree algorithm (α = 0.45) was used for unsupervised learning of the network.
Querying single-cell RNAseq data from LN renal biopsies
Publicly available single-cell RNAseq data from patients with biopsy-proven LN and healthy controls were obtained from ImmPort using accession number SDY997 EXP15077 and from the NCBI database of Genotypes and Phenotypes (dbGAP) under the accession number phs001457.v1.p1. For both datasets, post quality control expression datasets contained both skin and kidney cells and were subsetted to only include kidney/immune cells for downstream analysis, yielding 1401 cells from 21 LN patients and 3 healthy control biopsies (18), or renal-infiltrating immune cells from 24 LN biopsies (19). Graph-based clustering, tSNE, and UMAP were performed on the kidney single-cell profiles using the Seurat package for R. Principal component analysis yielding 50 principal components was used to derive the clusters. Cluster identity was generated by comparing differentially expressed genes between the clusters to canonical markers. Feature and violin plots were also created using the Seurat package for R.
Results
Protein Array Screen
Urine samples from 24 subjects (HC=9, active SLE=15, female, black, age range 23–33 years, see Supplementary Table S1) were used for the screening of 1,000 distinct human proteins using a pre-fabricated, commercially available capture-antibody coated protein array. All 15 SLE patients used for screening had active SLE, 12 of whom had renal involvement, and rSLEDAI ⩾ 4. The expression of all 1,000 urine proteins in these subjects, normalized by urine creatinine, was used to generate a heatmap, comparing HC and SLE urine, using R (Fig. 1A). The heatmap shows that some urine proteins are overexpressed in SLE patients compared to the controls and vice-versa. To better visualize these increases a volcano plot was generated in R, plotting fold change (FC) in SLE versus HC, against the corresponding p-value (Fig. 1B). 302 proteins met the significance threshold of p≤0.05 and FC>2.
Figure 1: Interrogation of 1000 urinary proteins in SLE patients and healthy controls.
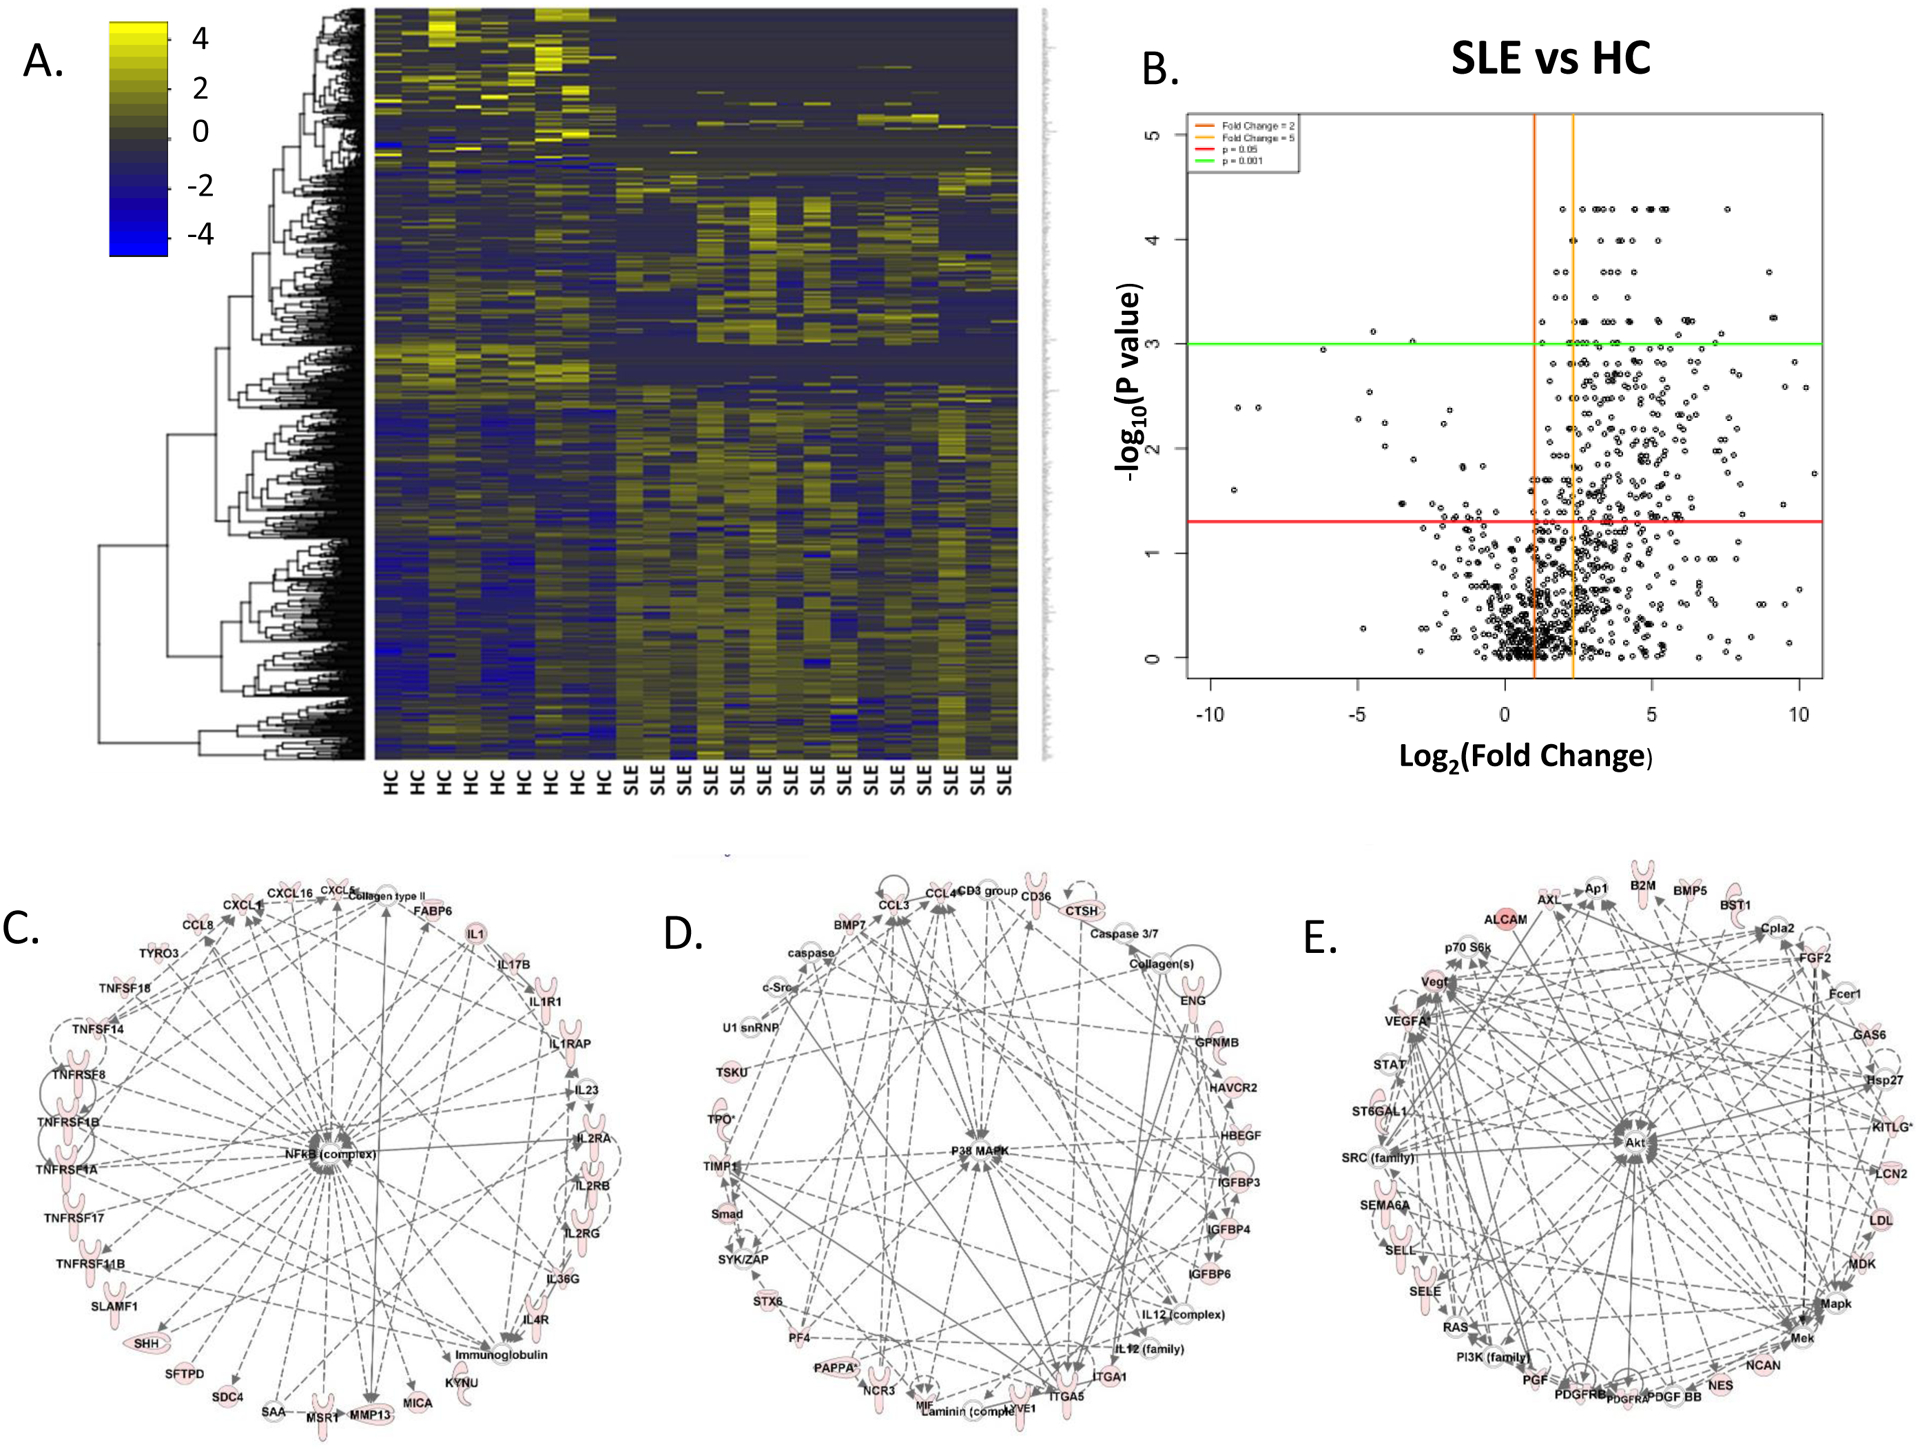
Urine samples from healthy controls and SLE patients (total=24; HC=9, SLE=15, all with active disease) were interrogated for the levels of 1000 proteins, using a quantitative array platform, and creatinine normalized. A: Heat map of patient-group-supervised clustering (the columns) reveals the landscape of protein expression across the 24 urine samples (HC vs SLE), as determined from the protein array. The yellow-blue color scheme indicates the expression of each of the 1000 proteins (each row representing one protein), with yellow indicating overexpression and blue indicating under expression, compared to the median expression level for that protein. B: Volcano plot showing expression differences of 1000 proteins in the urine, when comparing log2 fold change of protein expression vs the negative log10 P-value, i.e. biological significance vs statistical significance. Each dot represents a protein and its average value for that subset (SLE vs HC). Horizontal lines depict significance with p <0.05 (red) and <0.001 (green). Vertical lines depict fold change of 2 (orange) and 5 (yellow), comparing the levels in SLE to the corresponding levels in HC. All biomarker data was normalized by creatinine concentration and analyzed using a 2-tailed Mann-Whitney U test. C-E: Protein expression pathways encompassed by the 302 significantly upregulated urinary proteins in SLE vs health controls (FC>2, at p≤0.05) as determined using Ingenuity Pathway Analysis included molecular networks regulated by NFKB signaling, p38 mitogen-activated protein kinase (MAPK), and AKT signaling, depicted in C-E, respectively, as well as other pathways (not shown). Proteins that are colored red were upregulated in SLE urine, with the intensity of the redness being proportional to the fold change.
Ingenuity Pathway Analysis (IPA) generated 22 networks from these 302 elevated urine proteins, with 8 networks incorporating a minimum of 20 elevated proteins each. These 8 networks of elevated urine proteins encompassed pathways relating to NFKB activation, p38 mitogen-activated protein kinase (MAPK) activation, and AKT activation (Fig.1 C–E), among others. The NFKB regulated proteins elevated in LN urine included multiple members of the TNF family including TNFRSF- 11B (OPG), 17 (BAFF), 1A, 1B (TNFα), and 8 (CD30), and TNFSF- 14 (LIGHT, HVEML) and 18 (GITRL), IL-1 family members, IL-17, and several chemokines, many of which have been implicated in different autoimmune diseases, including lupus. The AKT/PI3K regulated network included various cell adhesion molecules, PDGF/R and VEFG family members, selectins, etc., many of which have also been implicated in lupus pathogenesis. The observation that several proteins previously implicated in lupus biology were “rediscovered” in LN urine in this study offers independent support for the validity of the novel screening approach utilized; these re-discovered proteins (numbering > 40) and the supporting literature are detailed in Supplementary Table S3.
More stringent criteria were used to determine which urinary proteins should be selected for further validation using orthogonal platforms. 64 proteins were elevated in SLE urine at a fold-change (FC) of 5 or greater, at p < 0.05, with the marker concentration in SLE urine exceeding 2000pg/mg Cr, as plotted in Fig. 2A. Of these, 54 proteins exhibited a q value < 0.05 after multiple testing correction. The mean/median and FC of protein biomarkers in SLE versus HC urine, as well as the multiple testing correction results are summarized in Supplementary Table S4. To generate a more selective set of candidate biomarkers, only those with FC>15 were considered for further validation, which reduced the list of candidates for validation to 34. Random Forest Analysis (RFA), a machine learning algorithm, was also used to select urinary proteins that best discriminate between HC and SLE samples (Fig. 2B). Of the top 20 proteins identified using RFA, Glypican-5 was solely identified using this analytical approach, but not by exercising FC and q-value cutoffs (as listed in Fig. 2A).
Figure 2: Elevated urine proteins in SLE, as ascertained by fold change, statistical significance, and machine learning algorithms, based on screening of 1000 proteins.

A: Horizontal dot plot depicting the top-most 64 proteins elevated in SLE urine, all of which exhibit a fold change > 5 in SLE urine, p<0.05, and an average concentration > 2000 pg/mg in SLE urine, based on the array-based screen of 1000 proteins. Blue dots indicate urine protein levels in healthy controls and red dots indicate levels in SLE patients. B: Radar chart depicting the top 20 urine proteins based on random forest analysis comparing urine from SLE and healthy controls, again based on the array-based screen of 1000 proteins in 15 SLE patients, all of whom had active disease. Each point in the graph indicates the FC of each protein in SLE versus HC.
35 protein candidates were considered for further validation, comprised of 34 proteins arising from FC>15 and q-value cut-offs, and Glypican-5 arising from the RFA results. Of these 35 candidates, 18 were not pursued further for various reasons, as detailed in Supplementary Table S5. For example, when two or more urine proteins belonged to the same cluster based on expression profile across the screening cohort (i.e., correlation coefficient > 0.95), only one representative protein was selected for ELISA validation. In addition, urine proteins that have already been accorded biomarker potential in previous LN studies (e.g., angiostatin, ferritin, VCAM-1, etc.), were not selected for further validation. ELISA kits were purchased for the remaining 17 proteins. Eight of these 17 ELISA kits failed to yield quantifiable results with the urine samples (BMP5, BMP7, Cathepsin H, CLEC-2, htPAPPA-A, MSCF-R, Siglec 5, and Siglec-11). This is not uncommon as most commercial ELISA assays are not rated for urine and the protein array platform has a lower LOD compared to conventional ELISA. The remaining nine urinary proteins were pursued further to validate the protein array screening results (Angptl4, FOLR2, GPC-5, L-selectin, PDGF-Rb, PRX2, TGFβ−1, TPP-1, and TSP-1). The kits and urine dilutions used are listed in Supplementary Table S5.
Validation of proteomic hits in the primary cross-sectional cohort
An independent cohort of N=78 subjects (HC=16, Inactive and low disease activity SLE=17, ANR=16, AR=29) was used for ELISA validation (Fig. 3). Of note, this validation cohort included AR SLE as well as ANR SLE patients. Importantly, both the ANR and AR groups had comparable SLEDAI scores. The demographic attributes, clinical features, and treatment history of these subjects are presented in Supplementary Table S2. The mean and median values of each urine biomarker candidate in the 4 subject groups, and the fold change and statistical comparisons between groups are summarized in Supplementary Table S6. The ELISA results showed that urine Angptl4, FOLR2, GPC-5, L-selectin, PDGF-Rb, PRX2, and TSP-1 were all significantly upregulated in AR patients compared to the HCs. Furthermore, urine Angplt4, FOLR2, L-selectin, TGFβ−1, TPP-1, and TSP-1 were all significantly elevated in AR patients compared to ANR SLE, indicating that each of these urinary proteins were indicative of renal lupus in patients with active SLE. Urine concentrations of these proteins without urine creatinine normalization are also displayed in Supplementary Fig. S1, showing similar performance in discriminating between the groups. We also examined whether these urine proteins could discriminate between inactive patients (or ANR patients) with previous history of renal involvement from those who never had any renal involvement. However, there was no difference between the groups when dichotomized based on previous renal involvement (data not shown). Hence these urine proteins are likely to be reflective of active, not previous, renal disease in lupus patients.
Figure 3: ELISA validation of array-based screening studies in an independent cross-sectional cohort of SLE patients.

A cohort of 78 urine samples: 16 healthy controls (black), 17 inactive SLE (blue), 16 active non-renal (ANR, green), and 29 active renal (AR, red) were tested by ELISA for the levels of Angptl4, FOLR2, GPC-5, L-selectin, PDGF-RB, PRX2, TGFβ−1, TPP-1, and TSP-1. Patients in the AR and ANR groups had comparable SLEDAI scores. All data is creatinine normalized. The asterisks designate the level of significance: *=p<0.05, **=p<0.01, *** = p<0.001, **** = p<0.0001, using a Mann-Whitney U-test.
The performance of these urinary proteins in differentiating between ANR and AR SLE or between AR and inactive SLE is further highlighted in Fig. 4, using Receiver operating curves (ROC). Urine Angptl4 and L-selectin both exhibited area under the curve (AUC) values of ≥0.86. TPP-1, TGFβ−1, and TSP-1 AUC’s are 0.84, 0.78, and 0.73, respectively (Supplementary Table S6). Each of these urine proteins outperformed traditional clinical parameters such as anti-dsDNA (AUC=0.58), C3 (AUC=0.48), and C4 (AUC=0.34) in distinguishing AR from ANR SLE, as displayed in Fig. 4A. In terms of discriminating AR SLE from inactive SLE patients, L-selectin was comparable to anti-dsDNA, but superior to urine Angptl4 and TPP-1 (Supplementary Table S7). Next, multiple proteins were combined into panels, to evaluate if any particular combination of urine proteins exhibited further improvement in diagnostic potential, using Lasso regression analysis. As displayed in Fig. 4B, the combination of urine L-selectin, Angptl4 and TPP exhibited the best diagnostic potential, with an AUC of 0.97, in distinguishing AR from ANR SLE.
Figure 4: Urine L-selectin, Angptl4, TGFβ1, PDGF-Rb and TPP1 are best at discriminating active renal SLE from active non-renal SLE.

Receiver operating characteristic curves for distinguishing active non-renal SLE from active renal SLE (A) and inactive SLE from active renal SLE (B) using urine Angptl4, L-selectin or TPP-1, all determined using ELISA (as in Fig. 3), and the corresponding ROC curves for anti-DNA, C3, and C4. The 5 urine proteins that were most discriminatory of active renal SLE from active non-renal SLE were urine Angptl4, L-selectin, TPP1, TGFβ1, and TSP-1; the last two are not plotted; see Supplementary Table S6. The discriminatory abilities of proteins distinguishing inactive SLE from active renal SLE are demonstrated in supplementary Table S7. (C) When multiple proteins were combined into panels, to evaluate if any particular combination of urine proteins exhibited further improvement in diagnostic potential, using Lasso regression analysis, the indicated combination of urine proteins exhibited the best diagnostic potential, with an AUC of 0.97, in distinguishing AR from active non-renal SLE.
Multivariate regression analysis was next performed to assess how well the assayed urine proteins predicted various clinical metrics. As depicted in Fig. 5A, most of the assayed urine proteins displayed significant association with rSLEDAI, proteinuria and/or PGA, based on linear regression analysis. Since the AR group were younger, with more African-American patients (100% versus 81%) compared to the ANR group (Supplementary Table S2), we next adjusted this analysis by age and ethnicity. Indeed, most of these associations maintained statistical significance, even after adjusting for demographic variables, as indicated by the bolded entries in Fig. 5A. Likewise, these same proteins also exhibited significant potential to discriminate AR from ANR SLE, based on logistic regression analysis (Fig. 5A). Of note, urine Angptl4, L-selectin, TGFβ−1, and TPP1 maintained this potential even after correcting for demographic variables.
Figure 5: Graphical representation of correlations between clinically measured parameters and the 9 urine biomarkers, as assayed by ELISA.

(A) Multivariate regression analysis was performed to assess how well each assayed urine protein predicted SLEDAI, rSLEDAI, proteinuria and/or PGA, based on linear regression analysis, and active renal SLE vs active non-renal SLE disease status, by logistic regression analysis. 1: Indicated in each cell is the regression coefficient, with an indication of statistical significance (*, p<0.05; **, p<0.01; ***, p<0.001; ****, p<0.0001). If an association maintained statistical significance after adjusting for demographic variables, this is indicated using bolded entries. (B) Bayesian network analysis of urine biomarkers in LN. Directed Acyclic graph depicting correlation between variables, created by using Maximum Spanning Tree algorithm. Size of nodes depicts node force, which is an estimate of the impact of that variable on all other variables in this network. Numbers indicate correlation between neighboring nodes. Colors of nodes indicate type of variables: green is a clinical index, purple is a biomarker molecule, brown represents disease status, white is other. (C) Correlation plot of clinical/laboratory parameters with biomarkers (proteins). Each square represents a correlation. A darker background indicates a lower p-value, as determined by Pearson correlation. The size of the dot in each square represents the magnitude of the correlation, with a bigger dot representing higher correlation. Blue dots indicate negative/inverse correlation. Orange dots indicate positive/direct correlation. Plot was drawn in R using the ggplot and ggraster functions.
Next, we analyzed how the clinical indices and assayed urine biomarkers were related to each other, using unsupervised Bayesian network analysis, which can uncover the interdependencies of all variables in a model, through probability distributions. These inter-dependencies are presented as a directed acyclic graph (Fig. 5B). The observed positive correlation of proteinuria with “renal involvement” and negative correlation of C3 and C4 with SLEDAI offer independent validation of this networking approach. These Bayesian networks demonstrate that renal involvement was, predictably, most strongly correlated to rSLEDAI and PGA. None of the assayed urine proteins were associated with demographic variables or hematological parameters. Interestingly, the standard clinical parameters of anti-DNA, C3 and C4 were not as correlated to renal involvement as the assayed candidate biomarkers, TPP, Angplt4, L-selectin, PRX2, and FOLR2. Of the assayed biomarkers, urinary Angplt4 exhibited the strongest “node force” or impact on this network, being directly correlated to rSLEDAI, while urine TPP had the strongest impact on PGA (Fig. 5B).
To corroborate the Bayesian network analysis results, a correlation plot between each of the 9 potential biomarkers to clinical parameters was created, as displayed in Fig. 5C. The levels of urine Angplt4, FOLR2, L-selectin, TGFβ−1, TPP-1 and TSP-1 was strongly, significantly and directly correlated with rSLEDAI. This observation holds true for these same proteins in relation to proteinuria. Conversely, most (7 of 9) of the investigated biomarkers (Angptl4, FOLR2, Glypican5, L-selectin, TGFβ1, TPP1, and TSP-1) were inversely correlated with C3 and C4 levels. Combined, these analyses demonstrate that the candidate urinary biomarkers identified are strong indicators for predicting renal involvement in lupus patients.
Further validation in LN patients with concurrent renal biopsy
To address whether these biomarker candidates reflect the pathological class of renal biopsy, we further assayed urine Angptl4, L-selectin, TGFβ1, and TPP1 in an independent cohort of 20 LN patients with concurrent urine samples obtained at the time of renal biopsy (Supplementary Table S8). As already noted before, all four biomarkers were elevated in LN patients when compared with healthy controls. When LN patients were further categorized into LN II, LN III (±V), LN IV (±V), and LN V, urine L-selectin and TPP1 were elevated in each LN class compared to healthy controls (Supplementary Fig. S2). Urine Angptl4 in class I+II, class III(±V), and class V, and TGFβ1 in LN III (±V), LN IV (±V), and LN V were elevated compared to healthy controls. There was a trend for these proteins to be higher in LN IV(±V) compared to other LN classes, but no statistical significance was observed (Supplementary Fig. S2).
Performance of urinary biomarker candidates in tracking disease activity in LN patients
To interrogate the performance of these biomarker candidates during serial follow-up, urine Angptl4, L-selectin, TGFβ1, and TPP1 were measured in 7 LN patients with multiple hospital visits. The serial tracking plots in Fig. 6 demonstrate the fluctuations of these proteins along with SLEDAI, rSLEDAI, and UrPrCr ratio over time. In some visits, these proteins elevated simultaneously (marked with “@”) with the increase of disease activity as reflected by the SLEDAI or rSLEDAI indices or UrPrCr ratio, and in other visits, these proteins preceded the clinical flares (marked using “p”), as plotted in Fig 6. Of the 4 urine proteins tested, urine L-selectin preceded or coincided with worsening of SLEDAI or rSLEDAI in all 7 patients, as marked by the “@” and “p” symbols in Fig 6 (row 2). Urine Angptl4 also performed well, preceding or coinciding with worsening of SLEDAI or rSLEDAI in 6 of 7 patients. Urine TGFβ1 ranked third, as it preceded or coincided with worsening of SLEDAI or rSLEDAI in 5 of 7 patients (Fig. 6). In all cases, the fluctuations in urine biomarkers were substantially more pronounced than the subtle changes in proteinuria. In some instances, the urine biomarker showed evidence of a rise even before proteinuria rose, and tracked better with disease activity, compared to proteinuria. For example, in patients 2, 4 and 5, urine Angptl4 kept rising with worsening disease activity, compared to the lackluster performance of proteinuria (row 1 in Fig. 6).
Figure 6: Performance of urine Angptl4, L-selectin, TGFβ1, and TPP1 in tracking disease activity during serial follow-up of LN patients.

The visit month is shown on the x-axis, while the disease activity index and biomarker levels are indicated on the left and right vertical axes, respectively. The serial tracking plots demonstrated the fluctuations of urine Angptl4, L-selectin, TGFβ1, and TPP1 along with SLEDAI, rSLEDAI, and urine protein to creatinine ratio over time. In some visits, these proteins elevated simultaneously (marked with “@”) with the increase of disease activity as reflected by the SLEDAI or rSLEDAI indices or UrPrCr ratio, and in other visits, these proteins preceded the clinical flares (marked using “p”). Statistical analyses of these data highlighted urine L-selectin, Angptl4, and TGFβ1 as proteins that best tracked disease activity over time, as detailed under Results.
This longitudinal data was also subjected to formal statistical analysis using 2 different methods. To determine which biomarker best tracked with disease activity metrics, we first ran multilevel linear models with patient IDs as random intercepts regressing on each individual biomarker and compared the Akaike information criterion (AIC) values among models. The results show that models with L-selectin was superior in predicting concurrent SLEDAI (AIC = 261.5) and rSLEDAI (AIC =241.1), compared to the remaining biomarkers, all of which exhibited higher AIC values, suggesting weaker performance. Next, we ran LASSO for multilevel linear models with patient IDs as random intercepts for biomarker selection. These results show that for SLEDAI, urine L-selectin and TPP-1 are independent predictors, whereas for rSLEDAI, urine L-selectin, Angptl4 and TGFβ1 are independent predictors. Both the above tests were next repeated to assess whether biomarker levels at month X-2 or X-1 can predict disease activity at future month X. Urine L-selectin (AIC= 116.2) was best at predicting oncoming increase in rSLEDAI (within the following 1–2 months), with Angptl4 (AIC = 116.8) and TGFβ1 (AIC = 116.8) being almost as predictive. Urine Angptl4 (AIC= 128.6) was best at predicting oncoming increases in SLEDAI (within the following 1–2 months), with L-selectin (AIC = 129.1) and TGFβ1 (AIC = 130.2) being almost as predictive (data not plotted). Finally, these conclusions were confirmed by Lasso analysis. Hence, consistent with the visual inspection of the serial plots in Fig. 6, statistical analysis of the serial data affirms that urine L-selectin is the best predictor of disease activity, followed by Angptl4 and TGFβ1, when LN disease activity is tracked serially.
Assessing the specificity of urinary biomarker candidates using CKD controls
To examine the specificity of these urinary proteins for LN, urine Angptl4, L-selectin, TGFβ1, and TPP1 were assayed in 47 CKD patients, including 14 patients with diabetic nephropathy, 11 patients with hypertensive nephropathy, 9 patients with focal segmental glomerulosclerosis (FSGS), and 13 with other causes of CKD (Supplementary Table S9). Urine Angptl4, L-selectin, and TPP1 were significantly elevated in the CKD controls when compared to healthy controls, while urine TGFβ1 was increased only in FSGS (Fig. 7). These findings indicate that these 4 proteins are not specific for LN. Interestingly, urine Angptl4 correlated with CKD stage (correlation coefficient 0.56, p < 0.0001) and was significantly higher in patients with CKD stages 4 and 5, compared to patients with CKD stages 1–3 (Fig. 7B; p < 0.001). The other urine markers did not show any association with the CKD stage.
Figure 7: Urine Angptl4, L-selectin, TGFβ1 and TPP1 in other CKD controls.

Urine Angptl4, L-selectin, TGFβ1, and TPP1 were assayed in 47 CKD patients, including 14 patients with diabetic nephropathy (DN), 11 patients with hypertensive nephropathy (HN), 9 patients with focal segmental glomerulosclerosis (FSGS), and 13 with other causes of CKD. Shown in (B) are urine Angptl4 levels in the same CKD controls, parsed by CKD stage (stages 1 to 5). All data is creatinine normalized. The asterisks designate the level of significance: *=p<0.05, **=p<0.01, *** = p<0.001, **** = p<0.0001, using a Mann-Whitney U-test.
Expression of urinary biomarker candidates within the kidneys in LN
To further explore the potential origins of candidate biomarkers at a cellular level within lupus nephritis kidneys, renal single-cell RNAseq data obtained 21 LN biopsies (Fig. 8A) (18) and single-cell RNAseq data from renal-infiltrating immune cells from 24 independent LN biopsies (Fig. 8B) (19) were queried. As is apparent from the violin plots in Fig. 8, all 9 of the proteins were expressed within LN kidneys, either within resident renal cells or infiltrating leukocytes. Some proteins such as TSP-1 (corresponding gene name is THBS1) and TPP1 were found to be expressed in multiple resident renal cell types, and isolated infiltrating immune cell types, notably B-cells or plasma cells. Other proteins exhibited more selective expression profiles. PDFG-RB was strongly expressed on mesangial cells, Angptl4 showed the strongest expression within infiltrating plasma cells, while FOLR2 was expressed predominantly within macrophages, most notably M2 macrophages. L-selectin exhibited the strongest expression on infiltrating B-cells (notably on activated and ISG-high B-cells), while TGFβ1 was expressed at high levels on all infiltrating T-cells. The strong expression profiles of these proteins within LN kidneys strongly supported the hypothesis that the proteins elevated in LN urine were likely to be renal in origin.
Figure 8: Violin plots of single-cell RNAseq data for the 9 candidate proteins in lupus nephritis renal tissue drawn from 45 LN biopsy tissues.

Renal single-cell RNAseq data obtained 21 LN biopsies (A) (18) and single-cell RNAseq data from renal-infiltrating immune cells from 24 independent LN biopsies (B) (19) were analyzed for the expression profile of each of the 9 biomarker proteins. Cells were divided into clusters based on the expression of canonical genes. Dots represent individual cells with their respective log expression level for each candidate biomarker. The profile for every cell type is shown for each biomarker. Each color represents a particular cell type, e.g., B-cells are purple, and mesangial cells are orange, in (A). For the renal-infiltrating cells in (B), the cluster annotations are as follows (19) - CM0: CD16+ macrophage, inflammatory; CM1: CD16+ macrophage, phagocytic; CM2: Tissue-resident macrophage; CM3: cDCs; CM4: CD16+ macrophage, M2-like; CT0a: Effector memory CD4+ T cells; CT0b: Central memory CD4+ T cells; CT1: CD56_dim CD16+ NK cells; CT2: CTLs; CT3a: Tregs; CT3b: TFH-like cells; CT4: GZMK+ CD8+ T cells; CT5a: Resident memory CD8+ T cells; CT5b: CD56_bright CD16- NK cells; CT6: ISG-high CD4+ T cells; CB0: Activated B cells; CB1: Plasma cells/Plasmablasts; CB2a: Naive B cells; CB2b: pDCs; CB3: ISG-high B cells; CD0: Dividing cells; CE0: Epithelial cells.
Discussion
The ability to screen a large library of proteins simultaneously has changed the landscape of biomarker discovery research. Mass-spectrometry has been used in recent SLE studies; however, these data can often be noisy and may fail to detect low abundance proteins due to overshadowing signals from high-abundance proteins (albumin, urea, immunoglobulins, etc.). In contrast, targeted proteomic assays, such as the protein array used in this study, rely on ligand-protein interactions resulting in the potential to accurately detect and quantify low abundance proteins. The array utilized in this study is one of the largest proteomic screening platforms available, providing quantitative information on 1000 different proteins, due to the inclusion of 1000 standards. Our screen of LN urine using this platform re-discovered several proteins already known to be upregulated in SLE or LN, including Adiponectin (20), Angiostatin (21), CD36, Ferritin (22), Galectin 7, ICAM-1 (23), IGFBP family proteins (24), MIF (25), Resistin, S100A8 (26), Siglec-5 (11), and VCAM-1(23), thus offering independent validation of this platform. These re-confirmations are further discussed in Supplementary Table S3. In the present study, we did not pursue these particular markers, as most of them have already been validated in the literature. Instead, we focused on novel proteins not previously implicated in LN.
Of the 9 ELISA-validated proteins, urine Angptl4, L-selectin, TPP1, TGFβ1, TSP-1, FOLR2, and PDGF-Rβ exhibited the best ROC AUC values of 0.96, 0.86, 0.84, 0.78, 0.73, 0.72, and 0.67 respectively, in terms of distinguishing lupus patients with AR involvement from those with ANR disease, despite both groups having comparable SLEDAI scores. Angplt4, which is produced under hypoxic conditions, is correlated with the expression of hypoxia-inducible factor (HIF)-1a. Studies have recently shown that HIF-1a is involved in the generation of T helper, T regulatory, and dendritic cells, all of which are well documented to be important in autoimmunity (27). Although HIF-1a was included in our screening panel, it was not expressed in detectable quantities. However, in another study serum HIF-1a has been linked to SLE, with correlation to SELDAI and renal pathology indices (28). Angplt4 has been shown to regulate acute inflammation in several organs through both TTP-dependent and independent signaling pathways (35–36). As a candidate biomarker, urinary Angplt4 easily differentiated between ANR and AR states (P<0.001) with a specificity of 87.5%, a PPV of 93.5%, and an outstanding NPV of 100%. Similar performance was also observed in discriminating AR from inactive SLE patients. Its expression was strongly correlated with the rSLEDAI score. It was found mostly in renal infiltrating plasma cells, where its functional role remains a black box. These data strongly suggest urine Angplt4 is an excellent biomarker for identifying AR SLE. Moreover, it was the only marker that correlated with CKD stage, independent of the primary renal disease, suggesting that it may be a universal marker of deteriorating renal function.
L-selectin (CD62L), a leukocyte adhesion molecule, has a well-established association with acute inflammation (29), autoimmune diseases (30), specifically SLE (31), as well as other renal diseases (30–31). In this study, urinary L-selectin distinguished between AR vs HC or ANR patients with strong PPV (92.5%) and acceptable NPV (70.1%). L-selectin levels exhibited significant linear regression with rSLEDAI, PGA and proteinuria, even after correcting for demographic variables. Interestingly, scRNAseq analysis revealed that L-selectin was most highly expressed on renal infiltrating B cells in LN, particularly on activated B-cells and IFN-I signature expressing B-cells, indicating the L-selectin may be mediating the migration of these lymphocyte subsets into or within the inflamed kidneys (33).
TPP1 (tripeptidyl-peptidase 1), plays a pivotal role in mediating telomere capping and length control (34) and is found abundantly in the bone marrow, placenta, lungs, and lymphocytes. Its expression has been shown to be lower in PBMCs of patients with SLE compared to healthy counterparts (35). However, to date, no study has reported urinary TPP1 levels in patients with kidney disease or autoimmunity. It was strongly associated with rSLEDAI and PGA. It also exhibited excellent specificity (100%) and acceptable PPV (64.2%) in distinguishing AR from ANR SLE patients. Within LN kidneys, TPP1 was strongly and broadly expressed in multiple resident cell types, as well as in renal infiltrating B-cells and plasma cells. Importantly, the combination of urine Angptl4 and TPP1 exhibited the best diagnostic potential, with an AUC of 0.98, in distinguishing AR from active non-renal SLE. Clearly, this panel of markers needs further validation in additional patient cohorts to substantiate its diagnostic performance.
TGFβ1, a transforming growth factor and a potent regulatory cytokine (36), has been reported as a biomarker in renal SLE studies previously (37,38), with significantly lower levels of TGFβ1 documented in the serum of SLE patients (39). It has been shown to be upregulated in a discoid lupus erythematosus microarray study (40), but unaltered in rheumatoid arthritis (41). Genetic variations of TGFβ1 have been associated with other diseases, including coeliac disease (42) and multiple sclerosis (43). In our study urinary TGFβ1 was highly expressed in AR LN samples and strongly associated with rSLEDAI and PGA, even after correction for demographics. TGFβ1 was broadly expressed within LN kidneys, with the strongest expression being noted in infiltrating T-cells, based on scRNAseq data. It is perhaps not surprising that both TSP-1 (gene name THBS1) and TGFβ1 demonstrated similar linear association with rSLEDAI and PGA, and similar expression profiles within LN kidneys, since TSP-1 is involved in the regulation of TGFβ1 signaling (44) and has been demonstrated to be a significant activator of TGFβ1 in fibrotic renal disease (45).
Urine FOLR2 was another protein that exhibited the ability to distinguish AR from ANR SLE, with significant linear regression with SLEDAI, rSLEDAI and PGA, even after correction for demographics. The folate receptor is known to be expressed by M2 macrophages (46,47), which suppress inflammation (48), and this was also borne out by the scRNAseq analysis of LN kidneys. It is conceivable that the expanded M2 macrophages in LN kidneys may play a role in reigning in inflammation; on the other hand, at later stages, they may be contributing to the fibrosis in this disease. While FOLR2 has been reported as a diagnostic target in nonalcoholic steatohepatitis (49), it has not been examined in SLE patients. While urine FOLR2 may be a convenient marker for intra-renal M2 macrophages, the precise role of these innate immune cells in LN warrants further analysis.
Urine PDGF-Rβ also showed excellent ability to distinguish AR from ANR SLE patients. PDGF/PDGF-receptors are involved in the regulation of cell migration and proliferation. Importantly, PDGF-Rβ has been identified as a candidate gene for SLE through machine learning approaches (50), and has been implicated as an autoantigen target in the serum of patients with SLE (51). The PDGF family has also been shown to be involved in renal fibrosis (52), which concurs with the elevated expression seen in AR LN patients in our study. Indeed, the inhibitor of PDGF-Rβ, Gleevac, used for the treatment of leukemia, has been shown to be effective as an anti-fibrotic agent (53). PDGF-Rb has also been reported to be upregulated on CD4+ T cells of SLE patients (54). In our data, urine PDGF-Rβ was upregulated in active LN patients, with most expression seen within mesangial cells and vascular smooth muscle cells. We hypothesize that increased PDGF-mediated signaling in mesangial cells may drive proliferative LN. These pinpoint urine PDGF-Rβ as an excellent biomarker of active LN, and a potential predictor of LN patients who might respond to Gleevac based therapies.
The top four proteins, Angptl4, L-selectin, TGFβ, and TPP1 were further validated in a LN cohort where 7 patients were examined serially over multiple visits. Urine L-selectin and Angptl4 preceded or coincided with worsening of SLEDAI or rSLEDAI in almost of the LN patients tracked, and exhibited a more dramatic and often more reliable indication of clinical disease activity, compared to proteinuria. Clearly, these markers warrant independent validation in additional serial cohorts where the LN patient visits are more closely timed. The current findings raise hope that urine L-selectin and Angptl4 could potentially be used for clinical monitoring of disease status in patients with LN. However, these urine proteins cannot be used to diagnose SLE or LN, as they are relatively non-specific, also being elevated in other causes of CKD.
This study could be improved in several respects. Inclusion of additional ethnic groups, and a larger sample size would provide added power to validate the urinary molecules reported here. Concurrent renal biopsy samples (with renal pathology data) should be expanded to better assess the relationship between the identified urinary molecules and concurrent renal pathological attributes. With these biopsy concurrent samples, it would be ideal to perform the urine biomarker assays and renal scRNS-seq studies using the same set of patients. In addition, as discussed above, an expanded longitudinal study is warranted to investigate how these urinary molecules relate to renal pathology, disease progression, treatment response over time, and long-term renal and patient outcome. Mechanistic studies are also needed to confirm the cellular origins of the identified biomarkers and to dissect out their respective roles in disease pathogenesis.
Supplementary Material
Key messages:
As opposed to previous urine biomarker studies in lupus nephritis, a comprehensive, quantitative screen of 1000 specific proteins has been conducted using urine from patients with lupus nephritis.
Based on array-based screening and ELISA-based validation, urine Angptl4, L-selectin, TPP1, TGFβ1, TSP-1, FOLR2, PDGFRβ, and PRX2 emerged as novel biomarkers of lupus nephritis.
Urine Angptl4, L-selectin, TPP1, TGFβ−1, TSP-1, FOLR2, and PDGFRβ successfully distinguished active lupus nephritis patients from active non-renal lupus patients, despite both groups having comparable SLEDAI scores.
Urine Angptl4, L-selectin and TPP1, in combination, offered the best discrimination of active LN from active non-renal lupus, with a ROC AUC of 0.97.
In SLE patients with serial follow-up, urine L-selectin (followed by urine Angptl4 and TGFβ1) were best at tracking concurrent or pending disease flares.
Acknowledgements.
This work is supported by NIH funding AR074096 and AR69572. The Hopkins Lupus Cohort is supported by AR69572.
References
- 1.Pisetsky DS. Anti-DNA antibodies — quintessential biomarkers of SLE. Nature Reviews Rheumatology 2016;12:102–10. [DOI] [PubMed] [Google Scholar]
- 2.Bandyopadhyay S, Connolly SE, Jabado O, Ye J, Kelly S, Maldonado MA, et al. Identification of biomarkers of response to abatacept in patients with SLE using deconvolution of whole blood transcriptomic data from a phase IIb clinical trial. Lupus Science & Medicine 2017;4:e000206. [DOI] [PMC free article] [PubMed] [Google Scholar]
- 3.Soliman S, Chandra Mohan. Lupus nephritis biomarkers. Clinical Immunology 2017;185:10–20. [DOI] [PubMed] [Google Scholar]
- 4.Rovin BH, Song H, Birmingham DJ, Hebert LA, Yu CY, Nagaraja HN. Urine Chemokines as Biomarkers of Human Systemic Lupus Erythematosus Activity. JASN 2005;16:467–73. [DOI] [PubMed] [Google Scholar]
- 5.Schwartz N, Michaelson JS, Putterman C. Lipocalin-2, TWEAK, and Other Cytokines as Urinary Biomarkers for Lupus Nephritis. Annals of the New York Academy of Sciences 2007;1109:265–74. [DOI] [PubMed] [Google Scholar]
- 6.Rovin BH, Birmingham DJ, Nagaraja HN, Yu CY, Hebert LA. Biomarker discovery in human SLE nephritis. Bulletin of the NYU hospital for joint diseases 2007;65:187–93. [PubMed] [Google Scholar]
- 7.Sui W, Tang D, Zou G, Chen J, Ou M, Zhang Y, et al. Differential proteomic analysis of renal tissue in lupus nephritis using iTRAQ reagent technology. Rheumatol Int 2012;32:3537–43. [DOI] [PubMed] [Google Scholar]
- 8.Zhang X, Jin M, Wu H, Nadasdy T, Nadasdy G, Harris N, et al. Biomarkers of lupus nephritis determined by serial urine proteomics. Kidney International 2008;74:799–807. [DOI] [PMC free article] [PubMed] [Google Scholar]
- 9.Somparn P, Hirankarn N, Leelahavanichkul A, Khovidhunkit W, Thongboonkerd V, Avihingsanon Y. Urinary proteomics revealed prostaglandin H2D-isomerase, not Zn-α2-glycoprotein, as a biomarker for active lupus nephritis. Journal of Proteomics 2012;75:3240–7. [DOI] [PubMed] [Google Scholar]
- 10.Hinchliffe TE, Lin Z-T, Wu T. Protein arrays for biomarker discovery in lupus. PROTEOMICS – Clinical Applications 2016;10:625–34. [DOI] [PubMed] [Google Scholar]
- 11.Wu T, Ding H, Han J, Arriens C, Wei C, Han W, et al. Antibody-Array-Based Proteomic Screening of Serum Markers in Systemic Lupus Erythematosus: A Discovery Study. J Proteome Res 2016;15:2102–14. [DOI] [PMC free article] [PubMed] [Google Scholar]
- 12.Merrill JT, Immermann F, Whitley M, Zhou T, Hill A, O’Toole M, et al. The Biomarkers of Lupus Disease Study: A Bold Approach May Mitigate Interference of Background Immunosuppressants in Clinical Trials. Arthritis & Rheumatology (Hoboken, NJ) 2017;69:1257–66. [DOI] [PMC free article] [PubMed] [Google Scholar]
- 13.Stanley S, Mok CC, Vanarsa K, Habazi D, Li J, Pedroza C, et al. Identification of Low-Abundance Urinary Biomarkers in Lupus Nephritis Using Electrochemiluminescence Immunoassays. Arthritis & Rheumatology 2019;71:744–55. [DOI] [PubMed] [Google Scholar]
- 14.Platonov ME, Borovjagin AV, Kaverina N, Xiao T, Kadagidze Z, Lesniak M, et al. KISS1 tumor suppressor restricts angiogenesis of breast cancer brain metastases and sensitizes them to oncolytic virotherapy in vitro. Cancer Letters 2018;417:75–88. [DOI] [PubMed] [Google Scholar]
- 15.Izrael M, Slutsky SG, Admoni T, Cohen L, Granit A, Hasson A, et al. Safety and efficacy of human embryonic stem cell-derived astrocytes following intrathecal transplantation in SOD1G93A and NSG animal models. Stem Cell Res Ther [Internet] 2018. [cited 2019 May 17];9 Available from: https://www.ncbi.nlm.nih.gov/pmc/articles/PMC5989413/ [DOI] [PMC free article] [PubMed] [Google Scholar]
- 16.Hyperactivation of MAPK Signaling Is Deleterious to RAS/RAF-mutant Melanoma | Molecular Cancer Research [Internet]. [cited 2019 May 17]. Available from: http://mcr.aacrjournals.org/content/17/1/199.long [DOI] [PubMed] [Google Scholar]
- 17.SomaLogic. SOMAscan Proteomic Assay Technical White Paper. 2015;1–14.
- 18.Der E, Suryawanshi H, Morozov P, Kustagi M, Goilav B, Ranabathou S, et al. Tubular cell and keratinocyte single-cell transcriptomics applied to lupus nephritis reveal type I IFN and fibrosis relevant pathways. Nature Immunology 2019;20:915. [DOI] [PMC free article] [PubMed] [Google Scholar]
- 19.Arazi A, Rao DA, Berthier CC, Davidson A, Liu Y, Hoover PJ, et al. The immune cell landscape in kidneys of patients with lupus nephritis. Nat Immunol. 2019. July;20(7):902–914. [DOI] [PMC free article] [PubMed] [Google Scholar]
- 20.Rovin BH, Song H, Hebert LA, Nadasdy T, Nadasdy G, Birmingham DJ, et al. Plasma, urine, and renal expression of adiponectin in human systemic lupus erythematosus. Kidney International 2005;68:1825–33. [DOI] [PubMed] [Google Scholar]
- 21.Wu T, Du Y, Han J, Singh S, Xie C, Guo Y, et al. Urinary Angiostatin - A Novel Putative Marker of Renal Pathology Chronicity in Lupus Nephritis. Molecular & Cellular Proteomics 2013;12:1170–9. [DOI] [PMC free article] [PubMed] [Google Scholar]
- 22.Serum ferritin as a serologic marker of activity in systemic lupus erythematosus | SpringerLink [Internet]. [cited 2019 Jun 10]. Available from: https://link.springer.com/article/10.1007/s002960000083 [DOI] [PubMed] [Google Scholar]
- 23.Levels of soluble VCAM-1, soluble ICAM-1, and soluble E-selectin during disease exacerbations in patients with systemic lupus erythematosus (SLE); a long term prospective study - SPRONK - 1994. - Clinical & Experimental Immunology - Wiley Online Library [Internet]. [cited 2019 Jun 10]. Available from: https://onlinelibrary-wiley-com.ezproxy.lib.uh.edu/doi/abs/10.1111/j.13652249.1994.tb06107.x [DOI] [PMC free article] [PubMed] [Google Scholar]
- 24.Ding H, Wu T. Insulin-Like Growth Factor Binding Proteins in Autoimmune Diseases. Front Endocrinol (Lausanne) [Internet] 2018. [cited 2019 Jun 10];9 Available from: https://www.ncbi.nlm.nih.gov/pmc/articles/PMC6125368/ [DOI] [PMC free article] [PubMed] [Google Scholar]
- 25.Lang T, Foote A, Lee JPW, Morand EF, Harris J. MIF: Implications in the Pathoetiology of Systemic Lupus Erythematosus. Front Immunol [Internet] 2015. [cited 2019 Jun 10];6 Available from: https://www.frontiersin.org/articles/10.3389/fimmu.2015.00577/full [DOI] [PMC free article] [PubMed] [Google Scholar]
- 26.Soyfoo MS, Roth J, Vogl T, Pochet R, Decaux G. Phagocyte-specific S100A8/A9 Protein Levels During Disease Exacerbations and Infections in Systemic Lupus Erythematosus. The Journal of Rheumatology 2009;36:2190–4. [DOI] [PubMed] [Google Scholar]
- 27.Yang Z-C, Liu Y. Hypoxia-Inducible Factor-1α and Autoimmune Lupus, Arthritis. Inflammation 2016;39:1268–73. [DOI] [PubMed] [Google Scholar]
- 28.Yang Z-C, Liu Y. Hypoxia-Inducible Factor-1α and Autoimmune Lupus, Arthritis. Inflammation 2016;39:1268–73. [DOI] [PubMed] [Google Scholar]
- 29.Heparin oligosaccharides bind L- and P-selectin and inhibit acute inflammation | Blood Journal [Internet]. [cited 2019 May 28]. Available from: http://www.bloodjournal.org/content/82/11/3253.short?sso-checked=true [PubMed] [Google Scholar]
- 30.Sfikakis PP, Charalambopoulos D, Vaiopoulos G, Mavrikakis M. Circulating P- and L-Selectin and T-Lymphocyte Activation in Patients with Autoimmune Rheumatic Diseases. Clin Rheumatol 1999;18:28–32. [DOI] [PubMed] [Google Scholar]
- 31.Font J, Pizcueta P, Ramos-Casals M, Cervera R, García-Carrasco M, Navarro M, et al. Increased serum levels of soluble l-selectin (CD62L) in patients with active systemic lupus erythematosus (SLE). Clin Exp Immunol 2000;119:169–74. [DOI] [PMC free article] [PubMed] [Google Scholar]
- 32.Rabb H, Ramirez G, Saba SR, Reynolds D, Xu J, Flavell R, et al. Renal ischemic-reperfusion injury in L-selectin-deficient mice. American Journal of Physiology-Renal Physiology 1996;271:F408–13. [DOI] [PubMed] [Google Scholar]
- 33.Tang MLK, Steeber DA, Zhang X-Q, Tedder TF. Intrinsic Differences in L-Selectin Expression Levels Affect T and B Lymphocyte Subset-Specific Recirculation Pathways. The Journal of Immunology 1998;160:5113–21. [PubMed] [Google Scholar]
- 34.O’Connor MS, Safari A, Xin H, Liu D, Songyang Z. A critical role for TPP1 and TIN2 interaction in high-order telomeric complex assembly. PNAS 2006;103:11874–9. [DOI] [PMC free article] [PubMed] [Google Scholar]
- 35.Qing Y, Zhou J, Xing Y, Zhao M, Yang Q, Yuan G, et al. Expression of TPP1 and POT1 mRNA in the peripheral blood mononuclear cells of patients with systemic lupus erythematosus. Chinese Journal of Rheumatology 2010;14:56–9. [Google Scholar]
- 36.Li MO, Wan YY, Sanjabi S, Robertson A-KL, Flavell RA. TRANSFORMING GROWTH FACTOR-β REGULATION OF IMMUNE RESPONSES. Annual Review of Immunology 2006;24:99–146. [DOI] [PubMed] [Google Scholar]
- 37.Vuong MT, Gunnarsson I, Lundberg S, Svenungsson E, Wramner L, Fernström A, et al. Genetic Risk Factors in Lupus Nephritis and IgA Nephropathy – No Support of an Overlap. PLOS ONE 2010;5:e10559. [DOI] [PMC free article] [PubMed] [Google Scholar]
- 38.Ferraccioli G, Romano G. Renal interstitial cells, proteinuria and progression of lupus nephritis: new frontiers for old factors. Lupus 2008;17:533–40. [DOI] [PubMed] [Google Scholar]
- 39.MENYAWI ME, FAWZY M, HABIB M, SHAKER O. Serum Transforming Growth Factor-Beta 1 Level in Egyptian Systemic Lupus Erythematosus Patients. Arch Rheumatol 2018;33:358–66. [DOI] [PMC free article] [PubMed] [Google Scholar]
- 40.Microarray study reveals a transforming growth factor-β-dependent mechanism of fibrosis in discoid lupus erythematosus - Solé - 2016. - British Journal of Dermatology - Wiley Online Library [Internet]. [cited 2019 May 17]. Available from: https://onlinelibrary-wiley-com.ezproxy.lib.uh.edu/doi/full/10.1111/bjd.14539 [DOI] [PubMed] [Google Scholar]
- 41.Manolova I, Ivanova MG, Vasilev G, Stoilov R, Miteva L, Stanilova S. AB0007 Association at systemic levels of cytokine mrnas and protein quantities in rheumatoid arthritis. Annals of the Rheumatic Diseases 2018;77:1208–1208.29760157 [Google Scholar]
- 42.Garrote JA, Arranz E, Gómez-González E, León AJ, Farré C, Calvo C, et al. IL6, IL10 and TGFB1 gene polymorphisms in coeliac disease: differences between DQ2 positive and negative patients. Allergologia et Immunopathologia 2005;33:245–9. [DOI] [PubMed] [Google Scholar]
- 43.Green AJ, Barcellos LF, Rimmler JB, Garcia ME, Caillier S, Lincoln RR, et al. Sequence variation in the transforming growth factor-β1 (TGFB1) gene and multiple sclerosis susceptibility. Journal of Neuroimmunology 2001;116:116–24. [DOI] [PubMed] [Google Scholar]
- 44.Lawler J, Detmar M. Tumor progression: the effects of thrombospondin-1 and −2. The International Journal of Biochemistry & Cell Biology 2004;36:1038–45. [DOI] [PubMed] [Google Scholar]
- 45.Ahamed J, Janczak CA, Wittkowski KM, Coller BS. In Vitro and In Vivo Evidence that Thrombospondin-1 (TSP-1) Contributes to Stirring- and Shear-Dependent Activation of Platelet-Derived TGF-β1. PLOS ONE 2009;4:e6608. [DOI] [PMC free article] [PubMed] [Google Scholar]
- 46.Vogelpoel LTC, Hansen IS, Rispens T, Muller FJM, van Capel TMM, Turina MC, et al. Fc gamma receptor-TLR cross-talk elicits pro-inflammatory cytokine production by human M2 macrophages. Nature Communications 2014;5:5444. [DOI] [PMC free article] [PubMed] [Google Scholar]
- 47.Puig-Kröger A, Sierra-Filardi E, Domínguez-Soto A, Samaniego R, Corcuera MT, Gómez-Aguado F, et al. Folate Receptor β Is Expressed by Tumor-Associated Macrophages and Constitutes a Marker for M2 Anti-inflammatory/Regulatory Macrophages. Cancer Res 2009;69:9395–403. [DOI] [PubMed] [Google Scholar]
- 48.Liu Y-C, Zou X-B, Chai Y-F, Yao Y-M. Macrophage Polarization in Inflammatory Diseases. Int J Biol Sci 2014;10:520–9. [DOI] [PMC free article] [PubMed] [Google Scholar]
- 49.Lake AD, Hardwick RN, Leamon CP, Low PS, Cherrington NJ. Folate receptor-beta expression as a diagnostic target in human & rodent nonalcoholic steatohepatitis. Toxicology and Applied Pharmacology 2019;368:49–54. [DOI] [PMC free article] [PubMed] [Google Scholar]
- 50.Siddani BR, Pochineni LP, Palanisamy M. Candidate Gene Identification for Systemic Lupus Erythematosus Using Network Centrality Measures and Gene Ontology. PLOS ONE 2013;8:e81766. [DOI] [PMC free article] [PubMed] [Google Scholar]
- 51.Kurasawa K, Arai S, Owada T, Maezawa R, Kumano K, Fukuda T. Autoantibodies against platelet-derived growth factor receptor alpha in patients with systemic lupus erythematosus. Modern Rheumatology 2010;20:458–65. [DOI] [PubMed] [Google Scholar]
- 52.Ostendorf T, Eitner F, Floege J. The PDGF family in renal fibrosis. Pediatr Nephrol 2012;27:1041–50. [DOI] [PubMed] [Google Scholar]
- 53.Aono Y, Nishioka Y, Inayama M, Ugai M, Kishi J, Uehara H, et al. Imatinib as a Novel Antifibrotic Agent in Bleomycin-induced Pulmonary Fibrosis in Mice. Am J Respir Crit Care Med 2005;171:1279–85. [DOI] [PubMed] [Google Scholar]
- 54.Zhao M, Liu S, Luo S, Wu H, Tang M, Cheng W, et al. DNA methylation and mRNA and microRNA expression of SLE CD4+ T cells correlate with disease phenotype. Journal of Autoimmunity 2014;54:127–36. [DOI] [PubMed] [Google Scholar]
Associated Data
This section collects any data citations, data availability statements, or supplementary materials included in this article.