

Abstract
Objective
To assess the safety, mechanism of action, and preliminary efficacy of rituximab followed by belimumab in the treatment of refractory lupus nephritis (LN).
Methods
In a multicenter, randomized, open‐label clinical trial, 43 patients with recurrent or refractory LN were treated with rituximab, cyclophosphamide (CYC), and glucocorticoids followed by weekly belimumab infusions until week 48 (RCB group), or treated with rituximab and CYC but no belimumab infusions (RC group). Patients were followed up until week 96. Percentages of total and autoreactive B cell subsets in the patients’ peripheral blood were analyzed by flow cytometry.
Results
Treatment with belimumab did not increase the incidence of adverse events in patients with refractory LN. At week 48, a complete or partial renal response occurred in 11 (52%) of 21 patients receiving belimumab, compared to 9 (41%) of 22 patients in the RC group who did not receive belimumab (P = 0.452). Lack of improvement in or worsening of LN was the major reason for treatment failure. B cell depletion occurred in both groups, but the percentage of B cells remained lower in those receiving belimumab (geometric mean number of B cells at week 60, 53 cells/μl in the RCB group versus 11 cells/μl in the RC group; P = 0.0012). Percentages of total and autoreactive transitional B cells increased from baseline to week 48 in both groups. However, percentages of total and autoreactive naive B cells decreased from baseline to week 48 in the belimumab group compared to the no belimumab RC group (P = 0.0349), a finding that is consistent with the observed impaired maturation of naive B cells and enhanced censoring of autoreactive B cells.
Conclusion
The addition of belimumab to a treatment regimen with rituximab and CYC was safe in patients with refractory LN. This regimen diminished maturation of transitional to naive B cells during B cell reconstitution, and enhanced the negative selection of autoreactive B cells. Clinical efficacy was not improved with rituximab and CYC in combination with belimumab when compared to a therapeutic strategy of B cell depletion alone in patients with LN.
INTRODUCTION
Lupus nephritis (LN) is the most common organ‐threatening manifestation of systemic lupus erythematosus (SLE), resulting in significant morbidity and mortality (1, 2). Despite the generation of data from multiple clinical trials, there are currently no US Food and Drug Administration (FDA)–approved therapies for LN. Current treatment for LN consists of an induction phase followed by a maintenance phase. During induction, intensive treatment with glucocorticoids in combination with an immunosuppressive agent, such as cyclophosphamide (CYC) or mycophenolate mofetil (MMF), is used to suppress renal inflammation and induce immune quiescence (3). The aim of induction is to achieve a complete renal response and minimize early damage, thereby preserving long‐term kidney health. The goals of the maintenance phase are to prevent renal flares while minimizing exposure to glucocorticoids and toxicity from immunosuppressive agents. Current treatment regimens have demonstrated incomplete efficacy and have been associated with substantial toxicity and low levels of adherence (4). Results of a recent study suggested that the risk of end‐stage kidney disease in patients with class IV LN is ~30% (5).
Because of the evidence supporting a critical role of B cells in the pathogenesis of SLE, some therapeutic strategies have focused on targeting the B cell compartment. Rituximab (anti‐CD20) was the first biologic B cell–targeted therapy to be studied in SLE and LN. Although the potential efficacy of B cell depletion has been demonsrated in several observational open‐label studies, 2 randomized, placebo‐controlled trials of rituximab in SLE, one of which was conducted in patients with LN, did not meet their primary end points (6, 7). One possible explanation for this is that levels of BAFF rise following B cell depletion (8). In murine studies, an elevated BAFF level promotes maturation of autoreactive B cells, thereby allowing them to enter a reconstituted B cell repertoire. B cell reconstitution in the absence of elevated BAFF levels results in fewer autoreactive cells in the reconstituted B cell repertoire (9). The monoclonal antibody belimumab targets soluble BAFF and might help prevent reemergence of autoreactive B cells following B cell depletion. Belimumab is approved by the FDA for the treatment of nonrenal manifestations of SLE.
We initiated a randomized trial of a B cell–targeted sequential combination regimen of rituximab and belimumab for refractory LN. The goals of this preliminary investigation were to assess the safety of this regimen, examine its mechanism of action, and generate preliminary efficacy data.
PATIENTS AND METHODS
Study design and treatment protocol
The Combination of Antibodies in Lupus Nephritis: Belimumab and Rituximab Assessment of Tolerance and Efficacy (CALIBRATE) trial was a phase II multicenter, randomized, controlled, open‐label trial of CYC plus rituximab followed by belimumab in patients with active LN who had previously been treated with CYC or MMF. Randomization, initiated at week 4, was distributed 1:1 using a permuted block design, and due to the small planned sample size, no stratification factors were incorporated. For randomization, sites used a secure interactive web response system developed and maintained at the Statistical and Clinical Coordinating Center. The trial was conducted at 14 clinical sites in the United States. Enrollment opened in November 2014 and concluded in April 2017 and was conducted in compliance with the Declaration of Helsinki. Institutional review boards at all sites approved the study design; all participants provided written informed consent.
In the treatment phase, all participants received methylprednisolone at a dose of 100 mg, rituximab at a dose of 1,000 mg, and CYC at a dose of 750 mg intravenously (IV) at weeks 0 and 2, based on the regimen described by Isenberg and colleagues (10). Prednisone at a dosage of 40 mg/day was initiated, with a prescribed taper to 10 mg/day by week 12, followed by ≤10 mg/day through week 96.
At week 4, trial participants were randomized to receive rituximab and CYC followed by weekly belimumab infusions (RCB group), or to receive rituximab and CYC but no belimumab infusions (RC group). Patients in the RCB group received belimumab IV at a dose of 10 mg/kg at weeks 4, 6, and 8 and every 4 weeks thereafter through week 48, whereas patients in the RC group received no additional treatment and also did not receive a placebo infusion. Treatment with hydroxychloroquine was allowed throughout the study.
Immunosuppressive medications, including additional doses of rituximab, were not permitted unless the participant met a criterion for study regimen discontinuation, which included the following: <25% improvement in the urine protein‐to‐creatinine ratio (UPCR) on a 24‐hour urine sample collection at week 24, occurrence of a renal flare, emergence of selected adverse events, or an investigator’s decision to discontinue treatment. Participants who were discontinued from the study regimen received standard of care therapy, as determined by their physician, and were followed up for treatment safety through week 96.
Study participants
Eligible participants were age ≥18 years, had a diagnosis that fulfilled the American College of Rheumatology or Systemic Lupus International Collaborating Clinics criteria for SLE (11, 12), and were required to have serum positivity for antinuclear antibodies (ANAs) and/or anti–double‐stranded DNA (anti‐dsDNA) antibodies at the time of screening. All participants had recurrent or refractory LN and had been treated previously with either CYC or MMF. Key exclusion criteria included prior treatment with rituximab at any time or treatment with another B cell biologic therapy within the prior 12 months. All participants had a UPCR of >1 based on a 24‐hour urine sample collection and had undergone a kidney biopsy within the 18 months prior to documentation of International Society of Nephrology/Renal Pathology Society class III or class IV LN or class III/IV in combination with class V LN. If the kidney biopsy was conducted >3 months prior to screening, a laboratory finding of active urinary sediment, a UPCR of >3, or an increasing UPCR over the 3 months prior to screening was required.
Study end points and assessments
The primary end point of the study was safety of the study treatment, reported as the proportion of participants who had at least 1 infectious adverse event of grade 3 or higher at or prior to week 48. Grading of the severity of adverse events was carried out using the National Cancer Institute Common Terminology Criteria for Adverse Events (CTCAE), version 4.03 (grade scale 0–5, ranging from mild to life‐threatening). Secondary end points were 1) the proportion of participants with evidence of B cell reconstitution, defined according to the baseline B cell count or a B cell count in the lower limit of normal, whichever value was lower; and 2) the proportion of participants with grade 4 hypogammaglobulinemia, defined as an IgG level of <300 mg/dl associated with an infectious adverse event of CTCAE grade 3 or higher.
Efficacy end points, which were prospectively defined, included the proportion of participants who achieved a complete response or overall (complete plus partial) response at weeks 24, 48, and 96. Complete response was defined as the presence of all of the following criteria: 1) a UPCR of <0.5 based on a 24‐hour urine sample collection; 2) an estimated glomerular filtration rate (eGFR) of ≥120 ml/minute/1.73 m2, or if the value was <120 ml/minute/1.73 m2, then >80% of the eGFR recorded at the time of study entry; and 3) adherence to the prednisone dosing provisions. Partial response was defined as the presence of the same criteria as used for the complete response, except that the UPCR component of the partial response definition required only >50% improvement from baseline. Nonresponders were those who did not meet the renal response criteria.
In addition, other measures of disease activity were assessed, including anti‐dsDNA antibody levels, presence of hypocomplementemia, and frequency of nonrenal flares. For identification of nonrenal flares, the British Isles Lupus Assessment Group criteria (13) were used.
Mechanistic assessments
In evaluating the mechanisms of action of the treatment regimen, mechanistic outcomes were assessed as the percentages of ANA+ B cells and B cell subsets, as determined by flow cytometry in the patients’ peripheral blood. Peripheral blood mononuclear cells (PBMCs) were isolated by density gradient centrifugation 1 day following collection of heparinized blood samples. The cells were cryopreserved by controlled‐rate freezing, and stored in liquid nitrogen until used. Vials of 5–10 × 106 frozen PBMCs were thawed in warmed RPMI 1640 medium (Gibco) with 15% fetal bovine serum (FBS), and then washed and resuspended in cold Hanks’ balanced salt solution (HBSS) with 5% FBS. Cells were incubated on ice for 30 minutes in HBSS with 1.5% nonfat dry milk (LabScientific) with biotinylated nuclear extract, as described previously (14).
After washing, cells were incubated with a cocktail of BV421‐conjugated streptavidin (BioLegend), eFluor 506–labeled fixable viability dye (ThermoFisher), and the following anti‐human antibodies in HBSS with 2% FBS: BV785‐conjugated IgD (IA6‐2), allophycocyanin (APC)–Fire 750–conjugated CD3 (UCHT1), APC–Fire 750–conjugated CD14 (M5E2), APC–Fire 750–conjugated CD16 (3G8), PerCP–Cy5.5–conjugated IgM (MHM‐88), phycoerythrin (PE)–Cy7–conjugated CD10 (HI10a), and APC‐conjugated CD19 (HIB19) (all from BioLegend); PE‐conjugated CD27 (CLB‐27/1) and PE–eFluor 610–conjugated CD38 (HIT2) (both from ThermoFisher); and fluorescein isothiocyanate–conjugated IgG (G18‐145) (from BD Biosciences). Events were acquired using a Fortessa flow cytometer (BD Biosciences) and analyzed using FlowJo software (Tree Star) (for the gating strategies, see Supplementary Figure 1, available on the Arthritis & Rheumatology website at http://onlinelibrary.wiley.com/doi/10.1002/art.41466/abstract). Transitional (CD19+CD27−IgD+CD38highCD10high), naive (CD19+CD27−IgD+CD38intermediateCD10intermediate/lowIgMintermediate/high), anergic (CD19+CD27−IgD+CD38intermediateCD10intermediate/lowIgMlow), switched memory (CD19+CD27+IgD−), IgD+ memory (CD19+CD27+IgD+), and double‐negative (CD19+CD27−IgD−) B cells were assessed.
Mechanistic studies were restricted to blood samples from participants in the week 24 and/or week 48 per protocol (PP) populations, as defined below. Global B cell subpopulations and ANA+ B cells with <50 events at all of the time points evaluated were excluded from the analyses. Consequently, the distribution of data from each analysis varied. Numbers of samples assessed in the between–treatment group comparisons are specified in Supplementary Tables 1–6 (available on the Arthritis & Rheumatology website at http://onlinelibrary.wiley.com/doi/10.1002/art.41466/abstract).
Statistical analysis
Statistical analyses were performed in the modified intent‐to‐treat (MITT) population, defined as all randomized participants who received 1 dose each of methylprednisolone, rituximab, and CYC, and 1 dose of belimumab if in the RCB group. Analyses were also performed in the PP population, defined as participants from the MITT population who received the study regimen through week 24, week 48, or week 96. Treatment group comparisons for the proportion of MITT participants who experienced at least 1 infectious adverse event of CTCAE grade 3 or higher by week 48 were performed using Clopper‐Pearson 95% confidence intervals (95% CIs) and a logistic regression model with an indicator of whether the participant experienced at least 1 infectious adverse event of CTCAE grade 3 or higher as the dependent variable and treatment group as the independent variable.
The sample size was selected by evaluating the width of a CI surrounding the point estimate of the safety primary end point (proportion of participants meeting the primary end point), and was not powered for between‐group comparisons. Data from the Immune Tolerance Network ACCESS study (Abatacept and Cyclophosphamide Combination Efficacy and Safety Study) and a review of the literature (7, 15, 16, 17, 18, 19) suggested that this proportion could range from 0.05 to 0.35. With 20 participants per group and an observed proportion of patients meeting the safety primary end point of 0.15, the Clopper‐Pearson 95% CI would range from 0.032 to 0.379.
Treatment group comparisons for the proportion of participants meeting secondary end points were performed using Clopper‐Pearson 95% CIs and a logistic regression model, similar to the methods for the primary end point analysis. Fisher’s exact test was used when 1 treatment group had 0 events. Treatment group comparisons for the level of B cells, B cell subpopulations, or ANA+ B cell subpopulations at a given visit were performed using repeated‐measures analysis of variance on log values with baseline adjustment. Tukey‐Kramer post hoc tests were done to adjust for multiple comparisons. Treatment group comparisons for directional change from week 0 at week 48 in the percentage of ANA+ transitional and ANA+ naive B cell subpopulations were performed using Fisher’s exact tests. P values less than 0.05 were considered significant. All analyses were performed using SAS version 9.4.
Data Availability Statement
Data sets for these analyses are accessible through TrialShare, a public website managed by the Immune Tolerance Network (https://www.itntrialshare.org/CALIBRATE.url). This website allows the user to filter the underlying data and generate figures and results from the analysis, in addition to those submitted as part of the published reports.
RESULTS
Study population
Forty‐three participants were enrolled in the trial, and these patients comprised the MITT population used for the safety and efficacy analyses. Twenty‐one participants were randomized to the RCB group, and 22 were randomized to the RC group.
Table 1 shows the demographic and clinical characteristics of the study population. The median baseline UPCR in a 24‐hour urine sample collection was 3.1 (minimum 1.08, maximum 10.76). A greater number of participants in the RC group compared to those in the RCB group entered the study with a UPCR of >3; however, the mean UPCR, eGFR, and serum albumin levels were similar between the groups. Eighty‐four percent of the participants had LN for more than 1 year. At study entry, 72% of participants were taking hydroxychloroquine and 72% of participants were taking either an angiotensin‐converting enzyme or an angiotensin receptor blocker; 54% were taking both. The distribution of the study subjects from initial assessment through week 96 is shown in Figure 1.
Table 1.
Baseline characteristics of the patients in each treatment group*
|
RC group (n = 22) |
RCB group (n = 21) |
|
|---|---|---|
| Demographic | ||
| Age, mean ± SD years | 32.3 ± 11.43 | 34.5 ± 9.14 |
| Female sex | 18 (81.8) | 19 (90.5) |
| Race/ethnicity | ||
| White | 7 (31.8) | 9 (42.9) |
| Black | 9 (40.9) | 9 (42.9) |
| Asian | 3 (13.6) | 2 (9.5) |
| Other/unknown | 3 (13.6) | 1 (4.8) |
| Hispanic or Latino | 10 (45.5) | 5 (23.8) |
| Clinical | ||
| Time since renal biopsy from week 0, mean ± SD months | 3.6 ± 4.57 | 2.9 ± 3.30 |
| ISN/RPS lupus nephritis classification | ||
| Class III | 1 (4.5) | 1 (4.8) |
| Class IV | 8 (36.4) | 7 (33.3) |
| Class III with class V | 3 (13.6) | 5 (23.8) |
| Class IV with class V | 10 (45.5) | 8 (38.1) |
| UPCR† | ||
| Mean ± SD | 3.4 ± 1.5 | 3.3 ± 2.5 |
| Ratio >3 | 14 (63.6) | 8 (38.1) |
| SCr, mean ± SD mg/dl | 1.02 ± 0.41 | 1.04 ± 0.47 |
| eGFR, mean ± SD | 92.7 ± 36.0 | 89.1 ± 33.9 |
| Serum albumin, mean ± SD mg/dl | 2.96 ± 0.50 | 2.89 ± 0.61 |
| B cell count, median no. cells/µl | 105.5 | 143.0 |
| Hypogammaglobulinemia‡ | 2 (9.1) | 4 (19.0) |
| Anti‐dsDNA positive | 20 (90.9) | 19 (90.5) |
| Hypocomplementemia | ||
| C3 | 18 (81.8) | 16 (76.2) |
| C4 | 10 (45.5) | 8 (38.1) |
Demographic and clinical characteristics were assessed among participants treated with rituximab and cyclophosphamide but no belimumab infusions (RC group) or with rituximab, cyclophosphamide, and glucocorticoids followed by weekly belimumab infusions until week 48 (RCB group) in the modified intent‐to‐treat population. Except where indicated otherwise, values are the number (%) of subjects. ISN/RPS = International Society of Nephrology/Renal Pathology Society; SCr = serum creatinine; eGFR = estimated glomerular filtration rate; anti‐dsDNA = anti–double‐stranded DNA.
Urinary protein‐to‐creatinine ratio (UPCR) from 24‐hour urine sample collection.
Defined as an IgG level of <450 mg/dl.
Figure 1.
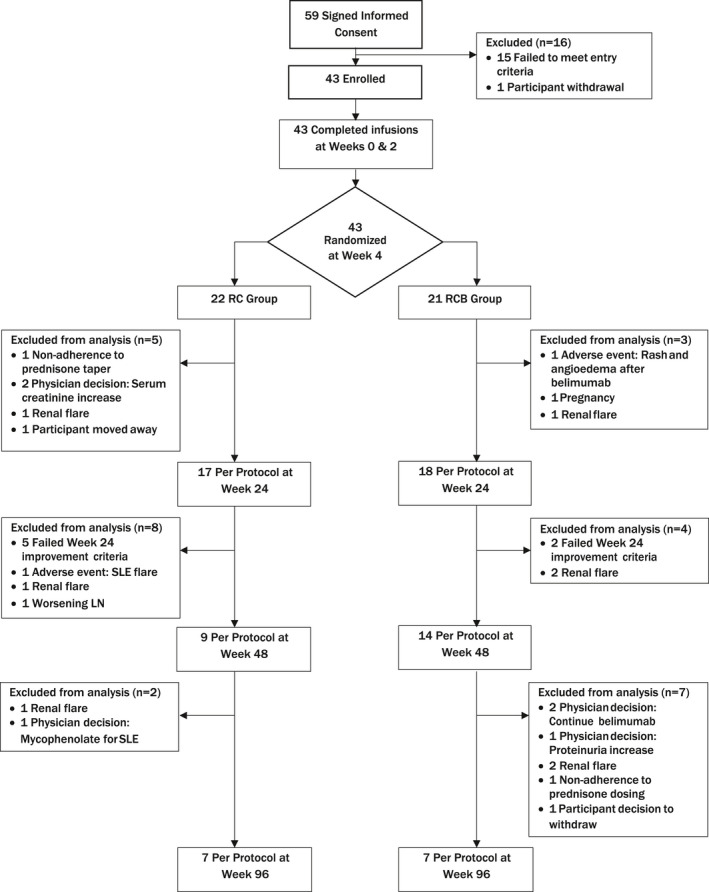
Flow diagram according to the Consolidated Standards of Reporting Trials (CONSORT) statement, showing the distribution of patients with recurrent or refractory lupus nephritis (LN) at each stage of the study from the time of informed consent to week 96. Reasons for exclusion of patients at each stage are provided. Samples from the per protocol population were evaluated at weeks 24, 48, and 96. RC = treatment with rituximab and cyclophosphamide but no belimumab infusions; RCB = treatment with rituximab, cyclophosphamide, and glucocorticoids followed by weekly belimumab infusions until week 48; SLE = systemic lupus erythematosus.
Safety and adverse events
The primary end point was treatment safety, defined as the proportion of participants with at least 1 infectious adverse event of CTCAE grade 3 or higher at or prior to week 48. In the MITT population, the proportion of participants with at least 1 infectious adverse event of CTCAE grade 3 or higher at or prior to week 48 was 5 (23%) of 22 patients in the RC group and 2 (9.5%) of 21 patients in the RCB group. The difference was not statistically significant (Table 2).
Table 2.
Summary of TEAEs*
| RC group (n = 22) | RCB group (n = 21) | |||
|---|---|---|---|---|
| Participants | Events | Participants | Events | |
| Primary safety end point, infectious TEAEs grade 3 or higher | 5 (23) (7.82–45.37) | 7 | 2 (10) (1.17–30.38) | 3 |
| Secondary safety end points | ||||
| Infectious TEAEs | ||||
| Grade 3 or higher | 6 (27) (10.73–50.22) | 10 | 2 (10) (1.17–30.38) | 5 |
| Grade 3 of higher on protocol therapy† | 4 (18) (5.19–40.28) | 5 | 2 (10) (1.17–30.38) | 2 |
| TEAEs | ||||
| Grade 2 or higher | 22 (100) (0.00–15.44) | 287 | 21 (100) (0.00–16.11) | 202 |
| Grade 2 or higher on protocol therapy† | 22 (100) (0.00–15.44) | 218 | 21 (100) (0.00–16.11) | 172 |
| Serious TEAEs | 11 (50) (28.22–71.78) | 40 | 4 (19) (5.45–41.91) | 7 |
| Serious TEAEs on protocol therapy† | 6 (27) (10.73–50.22) | 10 | 4 (19) (5.45–41.91) | 4 |
Values are the number (%) of participants (95% confidence interval) with the specified treatment‐emergent adverse event (TEAE) and the number of TEAEs occurring among participants in the modified intent‐to‐treat population. RC = treatment with rituximab and cyclophosphamide but no belimumab infusions; RCB = treatment with rituximab, cyclophosphamide, and glucocorticoids followed by weekly belimumab infusions until week 48.
On protocol therapy includes all TEAEs reported through 30 days after the participants had discontinued protocol‐specified treatment. The confidence interval bounds were calculated using the Clopper‐Pearson (exact) method for binomial proportions.
The infectious adverse events in the RC group included pneumonia (n = 3, of whom 1 had respiratory syncytial virus [RSV] pneumonia), urinary tract infection (n = 1), cystitis (n = 1), cellulitis (n = 1), and sepsis (n = 1). The cellulitis, RSV pneumonia, and sepsis occurred in the same participant. The infectious adverse events in the RCB group included soft tissue abscess (n = 1), cellulitis (n = 1), and urinary tract infection (n = 1). The soft tissue abscess and cellulitis occurred in the same participant. All infectious adverse events resolved. Table 2 summarizes the infectious adverse events of grade 3 or higher, adverse events of grade 2 or higher, and serious adverse events that occurred in the MITT population of participants while they were receiving study treatment and during the full study follow‐up. All participants experienced at least 1 adverse event. There were no deaths and no opportunistic infections.
Efficacy results
Fourteen participants in the PP analysis population completed the study through week 96, while 29 participants were excluded due to having left the study or having met a criterion for study regimen discontinuation. Table 3 shows the number of participants in the PP population who had a renal response to treatment that was designated as either a complete response, partial response, or nonresponse at weeks 24, 48, and 96. Table 3 also shows the number of participants who did not meet the requirements for inclusion in the PP population due to LN treatment failures and other reasons.
Table 3.
Renal response among participants at major study time points*
|
Complete response |
Partial response |
Nonresponse | Withdrawal | |
|---|---|---|---|---|
| Week 24 | ||||
| RC group (n = 22) | 5 (23) | 4 (18) | 8 (36) | 5 (23) |
| RCB group (n = 21) | 5 (24) | 5 (24) | 8 (38) | 3 (14) |
| Week 48 | ||||
| RC group (n = 22) | 7 (32) | 2 (9) | 0 | 13 (59) |
| RCB group (n = 21) | 8 (38) | 3 (14) | 3 (14) | 7 (33) |
| Week 96 | ||||
| RC group (n = 21)† | 4 (19) | 2 (10) | 0 | 15 (71) |
| RCB group (n = 21) | 5 (24) | 1 (5) | 1 (5) | 14 (67) |
Participants in the complete response, partial response, and nonresponse categories were included in the per protocol (PP) population for the time point. Participants in the withdrawal category did not meet the requirements for inclusion in the PP population, but are included in the modified intent‐to‐treat (MITT) population. Values are the number (%) of participants according to each renal response category analyzed in the MITT population. RC = treatment with rituximab and cyclophosphamide but no belimumab infusions; RCB = treatment with rituximab, cyclophosphamide, and glucocorticoids followed by weekly belimumab infusions until week 48.
One participant in the RC treatment group completed the study treatment regimen per protocol but did not complete the renal response assessments at week 96, and therefore was unevaluable.
The numbers of participants in the PP population exhibiting an overall renal response (defined as a complete response plus partial response) were similar between the RC group and the RCB group at all time points. The highest frequency of PP participants with an overall renal response occurred at week 48, in which 9 (41%) of 22 patients in the RC group and 11 (52%) of 21 patients in the RCB group had an overall renal response (P = 0.452).
Treatment failure in most participants was attributable to lack of improvement in or worsening of LN (Figure 1). By week 48, 10 of 22 subjects in the RC group and 5 of 21 in the RCB group had been removed from the PP analysis due to a renal flare, worsening nephritis, or failure to show improvement in LN (Figure 1). Fewer participants in the RCB group than in the RC group exhibited C3 hypocomplementemia at week 96 in the MITT analysis population (61% versus 28%; P = 0.049) There were no differences in other prespecified clinical efficacy end points in the MITT analysis population (see Supplementary Table 1 [http://onlinelibrary.wiley.com/doi/10.1002/art.41466/abstract]), and there were no differences between the groups in the PP analysis population (data not shown). Nonrenal flares were infrequent, and there were no between‐group differences in the frequency of nonrenal flares (Supplementary Table 1).
Although the parameters of renal disease (mean eGFR and UPCR) were comparable between the treatment groups at baseline (Table 1), there were some notable differences. Fourteen participants in the RC group entered the study with nephrotic levels of proteinuria (UPCR >3), compared to 8 participants in the RCB group. Among this subset, the response rate (complete response plus partial response) at week 48 was 43% (6 of 14) in the RC group and 88% (7 of 8) in the RCB group, suggesting that belimumab may be exerting a beneficial effect among participants with more severe LN. Furthermore, 3 participants in the RC group (14%) subsequently required dialysis and progressed to end‐stage renal disease (ESRD) within 2 years of study entry, as compared to 1 (5%) in the RCB group. This single participant in the RCB group who progressed to ESRD had a rapidly deteriorating condition at study entry, and was withdrawn at week 8 due to rising serum creatinine levels and proteinuria. The 3 participants in the RC group who progressed to ESRD were removed from the PP analysis at week 27 (2 participants) or week 44 (1 participant). They progressed to ESRD by week 64.
Peripheral B cell reconstitution and B cell subset redistribution
B cell depletion was achieved in the PP analysis population of participants in both treatment groups by week 12 (geometric mean number of B cells, 3 cells/μl [95% CI 1–10] in the RC group versus 2 cells/μl [95% CI 1–3] in the RCB group) (Figure 2A, and Supplementary Table 2 [http://onlinelibrary.wiley.com/doi/10.1002/art.41466/abstract]). At later time points, B cells counts were consistently lower in the RCB group. This difference remained significant at week 60, 12 weeks after belimumab treatment was discontinued (geometric mean number of B cells, 53 cells/μl [95% CI 26–109] in the RC group versus 11 cells/μl [95% CI 6–20] in the RCB group; P = 0.0012) (Figure 2A, and Supplementary Table 2).
Figure 2.
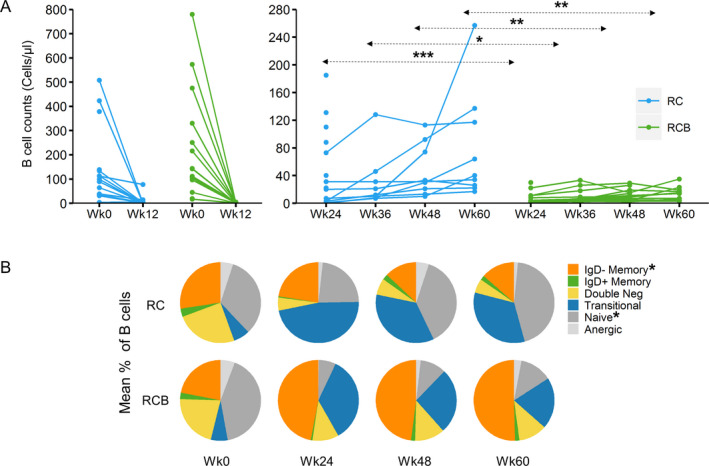
Total numbers of B cells within peripheral blood mononuclear cells (PBMCs) and relative frequencies of B cell subpopulations following treatment with RC versus RCB in samples from the per protocol population of patients with lupus nephritis. A, B cell counts before treatment and at week 12 (left) and during reconstitution in the peripheral blood at weeks 24–60 (right) following RC or RCB treatment. Each data point represents CD19+ B cell counts as determined by clinical laboratory testing in the peripheral blood from individual patients (number of PBMCs ranging 8–17). * = P < 0.05; ** = P < 0.01; *** = P < 0.001 by analysis of variance (ANOVA) on log values for comparisons at week 12, and by repeated‐measures ANOVA on log values (with baseline adjustment) for comparisons at weeks 24 through 60. Tukey‐Kramer post hoc adjustment was applied for multiple comparisons. B, Mean frequencies of each B cell subpopulation within total B cells from individual patients, including a per protocol sample analyzed at weeks 0 and 24 and per protocol sample analyzed at weeks 48 and 60, in each treatment group at each time point, as determined by flow cytometric analysis of cryopreserved PBMCs (number of PBMCs ranging 2–16). B cell subpopulation data were analyzed for subpopulations with >50 cells at each of the time points evaluated. * = P < 0.01 between treatment groups. For more details, see Supplementary Tables 2 and 3, available on the Arthritis & Rheumatology website at http://onlinelibrary.wiley.com/doi/10.1002/art.41466/abstract. Double neg = CD27−IgD− double‐negative (see Figure 1 for other definitions).
Consistent with this observation, the proportion of participants in the PP analysis who met the prespecified criteria for B cell reconstitution at week 24 was 5 of 14 in the RC group and 0 of 14 in the RCB group (P = 0.041). By week 48, 2 of 8 participants in the RC group and 0 of 12 in the RCB group met the prespecified criteria for B cell reconstitution. In the week 24 PP sample of participants in the RC group, the mean number of B cells was higher in nonresponders compared to those who exhibited either a complete response or partial response at week 24 (geometric mean 74.5 cells/µl versus 17.3 cells/µl).
The median IgG level was lower in the RCB group, but well above the range defining hypogammaglobulinemia, with a median IgG level at week 48 of 1,410.0 mg/dl in the RC group compared to 904.5 mg/dl in the RCB group (P = 0.022). No participant in the trial had grade 4 hypogammaglobulinemia, and only 1 participant (in the RC group) had an IgG level of <300 mg/dl, which was not associated with infectious complications.
As BAFF is known to be important for transitional to naive B cell differentiation, we examined the distribution of B cell subsets before and after treatment with rituximab, with or without belimumab. Before treatment, the distribution of B cell subsets was similar between the groups (Figure 2B, and Supplementary Table 3 [http://onlinelibrary.wiley.com/doi/10.1002/art.41466/abstract]). In the RCB group, the percentage of naive B cells was diminished relative to baseline and smaller than that in the RC group, with concomitant increases in the percentage of transitional B cells and class‐switched IgD− memory B cells. These differences between the 2 groups were significant at weeks 24, 48, and 60 (each P < 0.01) (Figure 2B, and Supplementary Table 3).
Reconstitution and subset redistribution of autoreactive ANA+ B cells
In order to investigate treatment effects on autoreactivity, we examined the percentages of total ANA+ B cells and their subset distributions, using a previously described flow cytometry–based method that identifies B cells bearing a B cell receptor that is capable of binding nuclear antigens (ANA+ B cells) (14). Before treatment, the predominant subpopulation of ANA+ B cells was naive B cells (Figure 3A, and Supplementary Table 4 [http://onlinelibrary.wiley.com/doi/10.1002/art.41466/abstract]). At week 48, the predominant subpopulation of ANA+ B cells in both groups was transitional cells. However, the distribution of other B cell subpopulations within ANA+ B cells differed between the treatment groups, with a diminished percentage of ANA+ naive B cells (P = 0.0176) and correspondingly greater percentages of class‐switched IgD− memory B cells (P = 0.0082) and CD27−IgD− double‐negative cells (P = 0.0026) in the RCB group compared to the RC group (Figure 3A, and Supplementary Table 4).
Figure 3.
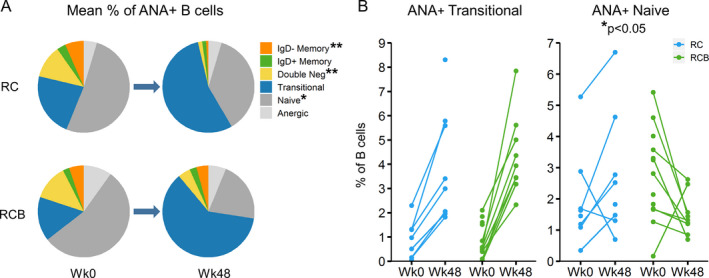
Reconstitution of autoreactive antinuclear antibody–positive (ANA+) B cell subsets following treatment with RC versus RCB in the per protocol population at week 48. A, Mean frequencies of B cell subpopulations within total ANA+ B cells from each group before treatment and at week 48 (number of peripheral blood mononuclear cells [PBMCs] ranging 8–13). * = P < 0.05; ** = P < 0.01 between treatment groups at week 48. B, ANA+ transitional and ANA+ naive B cells as a percentage of total B cells in the peripheral blood before treatment and at week 48. Each data point represents the relative frequency of ANA+ transitional B cells (left) or ANA+ naive B cells (right) in an individual patient at each time point (number of PBMCs ranging 8–13). * = P < 0.05 between treatment groups, using Fisher’s exact test. For more details, see Supplementary Tables 4–6, available on the Arthritis & Rheumatology website at http://onlinelibrary.wiley.com/doi/10.1002/art.41466/abstract. Double neg = CD27−IgD− double‐negative (see Figure 1 for other definitions).
At week 48, the percentage of ANA+ naive B cells was increased from baseline in 5 of 7 RC participants and decreased from baseline in 8 of 9 RCB participants (P = 0.0349), when assessed in the peripheral blood of patients who could be evaluated at both time points (Figure 3B, and Supplementary Table 5 [http://onlinelibrary.wiley.com/doi/10.1002/art.41466/abstract]). The relative percentages of ANA+ transitional cells increased from baseline to week 48 in all participants evaluated in either group (Figure 3B, and Supplementary Table 5). These results support the interpretation that treatment with belimumab delays reconstitution of ANA+ naive B cells by inhibiting maturation of ANA+ transitional B cells.
We also observed a higher percentage of ANA+ anergic cells within peripheral blood B cells at week 48 among patients in the RCB group, although this was not significantly different from that in patients in the RC group (Supplementary Figure 2 and Supplementary Table 6, available on the Arthritis & Rheumatology website at http://onlinelibrary.wiley.com/doi/10.1002/art.41466/abstract).
DISCUSSION
This study is the first randomized, controlled trial to examine the safety and efficacy of the combination of rituximab and belimumab in patients with LN. The trial was not powered to fully evaluate efficacy, but rather was designed primarily to evaluate safety. Consistent with published guidelines, the CALIBRATE trial was limited to patients with recurrent or refractory LN who had previously received standard of care treatment with either MMF or CYC (20, 21).
Sequential therapy with belimumab was not associated with an increased frequency of adverse events. However, there were no significant differences in efficacy between the 2 treatment groups. Notably, the complete response rates at week 24 and week 48 were comparable to those observed in past trials in patients with LN (22) that included participants with new‐onset LN.
Compared to prior treatment trials in LN, we encountered a higher frequency of ESRD (9%). This finding may reflect the fact that enrollment in the CALIBRATE trial was restricted to patients with recurrent or refractory nephritis. All 4 participants who progressed to ESRD entered the trial with nephrotic levels of proteinuria (UPCRs of 3.4, 3.8, 4.2, and 5.3). The fact that 3 of these participants were in the RC group may simply reflect the imbalance between the groups with respect to the UPCR value at trial entry. However, we observed a trend toward 1) better responses among participants with nephrotic levels of proteinuria in the RCB group, 2) an increased frequency of ESRD in the RC group, and 3) an increased number of participants in the RC group who were withdrawn prior to week 48 due to lack of renal response at week 24, or withdrawn for reasons related to LN. All of these findings imply that a maintenance regimen may be important following a single course of rituximab and CYC therapy in patients with recurrent or refractory LN. This is consistent with recent data showing a benefit of adding belimumab to a maintenance regimen for LN (23), and consistent with the practice of administering a second dose of rituximab as reinforcement at 6 months.
For more than a decade, there has been controversy regarding the role of B cell depletion in the treatment of LN. Despite positive anecdotal experiences and case series, controlled trials continue to yield disappointing results. In this respect, the findings from the CALIBRATE trial are consistent with those from past controlled trials. Forty‐eight weeks after treatment with rituximab, only one‐third of participants in each group achieved a complete response.
Belimumab reduces disease activity in SLE patients without nephritis (24) and produces partial B cell depletion, which is associated with lower circulating levels of BAFF (25). The CALIBRATE trial explored the effects of belimumab after B cell depletion with anti‐CD20 therapy. Participants who received belimumab exhibited lower B cell numbers at all time points. Nonetheless, median IgG levels remained within the normal range in both groups, and the addition of belimumab to a regimen of CYC, rituximab, and glucocorticoids did not result in an increase in serious infectious adverse events.
This study employed sequential administration of rituximab and belimumab, with the objective of reducing the emergence of autoreactive B cells during B cell reconstitution, as increased BAFF levels have been associated with the risk of relapse (26). Another potential therapeutic strategy would be to administer belimumab followed by rituximab. Since BAFF enhances the mobilization of B cells into lymphoid follicles (27) and belimumab reduces the number of B cells in lymphoid tissues (28), this sequence might increase systemic depletion of memory B cells by moving them into circulation, where they would be more susceptible to rituximab‐mediated cell death. This strategy is being examined in an ongoing clinical trial of nonrenal SLE, the BLISS‐BELIEVE study (Study to Evaluate the Efficacy and Safety of Belimumab Administered in Combination With Rituximab to Adult Subjects With Systemic Lupus Erythematosus; ClinicalTrials.gov identifier: NCT03312907). The increased percentage of class‐switched IgD− memory B cells that was observed in the RCB group is consistent with previous observations (29), and also with a belimumab‐induced release of memory B cells from lymphoid organs, suggesting that a regimen of belimumab prior to rituximab may be of benefit.
We observed a reduced percentage of naive B cells in the RCB group, consistent with the dependence on BAFF for differentiation of transitional to naive B cells. In contrast, the RC group exhibited an increased proportion of naive B cells, presumably due to the unhindered maturation of transitional into naive B cells. This observation is consistent with that in previous studies showing decreased numbers of circulating naive B cells in patients treated with belimumab only (25, 30, 31). The results of one study demonstrated that belimumab controlled the developmental checkpoint of transitional cells between the T1 and T3 stages, with the conservation of the T1 population and reduction of the late T3 population in SLE patients. Although not studied in this trial, the increased percentages of transitional B cells observed in both treatment groups is likely composed of different subsets, with the T1 phenotype predominating in the RCB group and T2 and T3 subsets in the RC group.
A recent study of lupus patients receiving long‐term belimumab therapy showed a reduction in the usage of the VH4–34 gene associated with anti‐dsDNA antibodies in IgM+ B cells (30). We analyzed the percentage of each subpopulation in ANA+ autoreactive B cells, as well as the percentage of each ANA+ B cell subpopulation among B cells, by flow cytometry in the patients’ peripheral blood. As expected, we observed a decreased percentage of naive B cells within the autoreactive ANA+ B cell compartment (Figure 3A), and a decreased percentage of ANA+ naive cells among total B cells (Figure 3B) in the RCB treatment group compared to the RC treatment group. We did not, however, observe a decreased percentage of ANA+ B cells in the naive B cell subset in patients receiving belimumab.
This trial adds to the growing body of literature examining B cell combination therapy in SLE. The recently published single‐arm, proof‐of‐concept SynBiOse trial of rituximab and belimumab in 16 patients with active SLE demonstrated clinical efficacy at week 24 (32). Thirteen participants had LN. The median SLE Disease Activity Index score decreased from 18 at baseline to 2 at week 24, and median proteinuria levels decreased from 2.3 gm/24 hours to 0.7 gm/24 hours. These clinical benefits were noted despite the fact that background treatment with MMF and glucocorticoids was tapered to low levels during the study. The rate of complete renal response was slightly higher in the SynBiOse trial participants compared to that in the CALIBRATE trial. The reasons for this difference are not entirely clear, but are likely multifactorial. Notably, the trial designs and study populations were quite different: 1) SynBiOse participants received higher initial doses of steroids and did not receive concomitant CYC; 2) the definition for complete renal response was more stringent in the CALIBRATE trial; and 3) the racial/ethnic composition of the participants differed. In this regard, the CALIBRATE trial included a racially diverse sample, including 40% of patients being African American, a group underrepresented in the first trials of belimumab (33).
The CALIBRATE trial is an important step in understanding the mechanisms of action of combination therapy with rituximab and belimumab for the treatment of LN in SLE. These findings may lay the foundation for larger trials designed to assess efficacy.
AUTHOR CONTRIBUTIONS
All authors were involved in drafting the article or revising it critically for important intellectual content, and all authors approved the final version to be published. Dr. Diamond had full access to all of the data in the study and takes responsibility for the integrity of the data and the accuracy of the data analysis.
Study conception and design
Ding, Kanaparthi, Tosta, Wofsy, Diamond, Smilek, Aranow, Dall’Era.
Acquisition of data
Atisha‐Fregoso, Malkiel, Harris, Byron, Ding, Kanaparthi, Ryker, Tosta, Askanase, Boackle, Chatham, Kamen, Karp, Kirou, Lim, Marder, McMahon, Parikh, Pendergraft, Podoll, Saxena, Wofsy, Smilek, Aranow, Dall’Era.
Analysis and interpretation of data
Atisha‐Fregoso, Malkiel, Harris, Byron, Ding, Kanaparthi, Barry, Gao, Wofsy, Diamond, Smilek, Aranow, Dall’Era.
ROLE OF THE STUDY SPONSOR
Genentech, Inc. provided the study medication and some financial support, but had no role in the study design or in the collection, analysis, or interpretation of the data, the writing of the manuscript, or the decision to submit the manuscript for publication. Publication of this article was not contingent upon approval by Genentech, Inc.
ADDITIONAL DISCLOSURES
Authors Byron and Barry are employees of Rho.
Supporting information
Supplementary Material
Acknowledgments
The authors thank their colleagues at the Immune Tolerance Network, and their collaborators who contribute in many capacities to Immune Tolerance Network projects and perspectives. The authors are also grateful to the study participants in the ITN055AI CALIBRATE trial.
ClinicalTrials.gov identifier: NCT02260934.
Research reported in this publication was sponsored by the Immune Tolerance Network and supported by the National Institute of Allergy and Infectious Diseases of the National Institutes of Health (award no. UM1‐AI‐109565). The content is solely the responsibility of the authors and does not necessarily represent the official views of the National Institutes of Health. Study medication and financial support were also provided by Genentech, Inc.
Drs. Atisha‐Fregoso, Malkiel, and Harris contributed equally to this work. Drs. Smilek, Aranow, and Dall’Era contributed equally to this work.
Drs. Askanase and McMahon have received consulting fees, speaking fees, and/or honoraria from GlaxoSmithKline (less than $10,000). Dr. Parikh has received consulting fees from Aurinia, Bristol Myers Squibb, and GlaxoSmithKline (less than $10,000 each). Drs. Pendergraft and Saxena have received consulting fees and/or honoraria from GlaxoSmithKline (less than $10,000). Dr. Wofsy has received consulting fees from GlaxoSmithKline and Genentech (less than $10,000 each). Dr. Dall‐Era has received consulting fees from AstraZeneca, GlaxoSmithKline, Eli Lilly, and Janssen (less than $10,000 each). No other disclosures relevant to this article were reported.
REFERENCES
- 1. Mok CC, Kwok RC, Yip PS. Effect of renal disease on the standardized mortality ratio and life expectancy of patients with systemic lupus erythematosus. Arthritis Rheum 2013;65:2154–60. [DOI] [PubMed] [Google Scholar]
- 2. Hanly JG, O'Keeffe AG, Su L, Urowitz MB, Romero‐Diaz J, Gordon C, et al. The frequency and outcome of lupus nephritis: results from an international inception cohort study. Rheumatology 2016;55:252–62. [DOI] [PMC free article] [PubMed] [Google Scholar]
- 3. Dall'Era M. Treatment of lupus nephritis: current paradigms and emerging strategies [review]. Curr Opin Rheumatol 2017;29:241–7. [DOI] [PubMed] [Google Scholar]
- 4. Feldman CH, Collins J, Zhang Z, Xu C, Subramanian SV, Kawachi I, et al. Azathioprine and mycophenolate mofetil adherence patterns and predictors among Medicaid beneficiaries with systemic lupus erythematosus. Arthritis Care Res (Hoboken) 2019;71:1419–24. [DOI] [PMC free article] [PubMed] [Google Scholar]
- 5. Tektonidou MG, Dasgupta A, Ward MM. Risk of end‐stage renal disease in patients with lupus nephritis, 1971–2015: a systematic review and Bayesian meta‐analysis. Arthritis Rheumatol 2016;68:1432–41. [DOI] [PMC free article] [PubMed] [Google Scholar]
- 6. Merrill JT, Neuwelt CM, Wallace DJ, Shanahan JC, Latinis KM, Oates JC, et al. Efficacy and safety of rituximab in moderately‐to‐severely active systemic lupus erythematosus: the randomized, double‐blind, phase II/III systemic lupus erythematosus evaluation of rituximab trial. Arthritis Rheum 2010;62:222–33. [DOI] [PMC free article] [PubMed] [Google Scholar]
- 7. Rovin BH, Furie R, Latinis K, Looney RJ, Fervenza FC, Sanchez‐Guerrero J, et al. Efficacy and safety of rituximab in patients with active proliferative lupus nephritis: the Lupus Nephritis Assessment with Rituximab study. Arthritis Rheum 2012;64:1215–26. [DOI] [PubMed] [Google Scholar]
- 8. Ehrenstein MR, Wing C. The BAFFling effects of rituximab in lupus: danger ahead [review]? Nat Rev Rheumatol 2016;12:367–72. [DOI] [PubMed] [Google Scholar]
- 9. Kawabata D, Venkatesh J, Ramanujam M, Davidson A, Grimaldi CM, Diamond B. Enhanced selection of high affinity DNA‐reactive B cells following cyclophosphamide treatment in mice. PloS One 2010;5:e8418. [DOI] [PMC free article] [PubMed] [Google Scholar]
- 10. Ng KP, Leandro MJ, Edwards JC, Ehrenstein MR, Cambridge G, Isenberg DA. Repeated B cell depletion in treatment of refractory systemic lupus erythematosus. Ann Rheum Dis 2006;65:942–5. [DOI] [PMC free article] [PubMed] [Google Scholar]
- 11. Tan EM, Cohen AS, Fries JF, Masi AT, McShane DJ, Rothfield NF, et al. The 1982 revised criteria for the classification of systemic lupus erythematosus. Arthritis Rheum 1982;25:1271–7. [DOI] [PubMed] [Google Scholar]
- 12. Petri M, Orbai AM, Alarcon GS, Gordon C, Merrill JT, Fortin PR, et al. Derivation and validation of the Systemic Lupus International Collaborating Clinics classification criteria for systemic lupus erythematosus. Arthritis Rheum 2012;64:2677–86. [DOI] [PMC free article] [PubMed] [Google Scholar]
- 13. Symmons DP, Coppock JS, Bacon PA, Bresnihan B, Isenberg DA, Maddison P, et al, and Members of the British Isles Lupus Assessment Group (BILAG) . Development and assessment of a computerized index of clinical disease activity in systemic lupus erythematosus. Q J Med 1988;69:927–37. [PubMed] [Google Scholar]
- 14. Malkiel S, Jeganathan V, Wolfson S, Orduño NM, Marasco E, Aranow C, et al. Checkpoints for autoreactive B cells in the peripheral blood of lupus patients assessed by flow cytometry. Arthritis Rheumatol 2016;68:2210–20. [DOI] [PMC free article] [PubMed] [Google Scholar]
- 15. Appel GB, Contreras G, Dooley MA, Ginzler EM, Isenberg D, Jayne D, et al. Mycophenolate mofetil versus cyclophosphamide for induction treatment of lupus nephritis. J Am Soc Nephrol 2009;20:1103–12. [DOI] [PMC free article] [PubMed] [Google Scholar]
- 16. Diaz‐Lagares C, Croca S, Sangle S, Vital EM, Catapano F, Martinez‐Berriotxoa A, et al. Efficacy of rituximab in 164 patients with biopsy‐proven lupus nephritis: pooled data from European cohorts [review]. Autoimmun Rev 2012;11:357–64. [DOI] [PubMed] [Google Scholar]
- 17. Jonsdottir T, Zickert A, Sundelin B, Henriksson EW, van Vollenhoven RF, Gunnarsson I. Long‐term follow‐up in lupus nephritis patients treated with rituximab: clinical and histopathological response. Rheumatology (Oxford) 2013;52:847–55. [DOI] [PubMed] [Google Scholar]
- 18. Dooley MA, Jayne D, Ginzler EM, Isenberg D, Olsen NJ, Wofsy D, et al. Mycophenolate versus azathioprine as maintenance therapy for lupus nephritis. N Engl J Med 2011;365:1886–95. [DOI] [PubMed] [Google Scholar]
- 19. The ACCESS Trial Group . Treatment of lupus nephritis with abatacept: the Abatacept and Cyclophosphamide Combination Efficacy and Safety Study. Arthritis Rheumatol 2014;66:3096–104. [DOI] [PMC free article] [PubMed] [Google Scholar]
- 20. Hahn BH, McMahon MA, Wilkinson A, Wallace WD, Daikh DI, Fitzgerald JD, et al. American College of Rheumatology guidelines for screening, treatment, and management of lupus nephritis. Arthritis Care Res (Hoboken) 2012;64:797–808. [DOI] [PMC free article] [PubMed] [Google Scholar]
- 21. Bertsias GK, Tektonidou M, Amoura Z, Aringer M, Bajema I, Berden JH, et al. Joint European League Against Rheumatism and European Renal Association‐European Dialysis and Transplant Association (EULAR/ERA‐EDTA) recommendations for the management of adult and paediatric lupus nephritis. Ann Rheum Dis 2012;71:1771–82. [DOI] [PMC free article] [PubMed] [Google Scholar]
- 22. Wofsy D, Diamond B, Houssiau FA. Crossing the Atlantic: the Euro‐Lupus Nephritis regimen in North America. Arthritis Rheumatol 2015;67:1144–6. [DOI] [PMC free article] [PubMed] [Google Scholar]
- 23. GSK . GSK announces positive headline results in phase 3 study of Benlysta in patients with lupus nephritis. December 2019. URL: https://www.gsk.com/en-gb/media/press-releases/gsk-announces-positive-headline-results-in-phase-3-study-of-benlysta-in-patients-with-lupus-nephritis/.
- 24. Regola F, Piantoni S, Lowin T, Archetti S, Reggia R, Kumar R, et al. Association between changes in BLyS levels and the composition of B and T cell compartments in patients with refractory systemic lupus erythematosus treated with belimumab. Front Pharmacol 2019;10:433. [DOI] [PMC free article] [PubMed] [Google Scholar]
- 25. Jacobi AM, Huang W, Wang T, Freimuth W, Sanz I, Furie R, et al. Effect of long‐term belimumab treatment on B cells in systemic lupus erythematosus: extension of a phase II, double‐blind, placebo‐controlled, dose‐ranging study. Arthritis Rheum 2010;62:201–10. [DOI] [PMC free article] [PubMed] [Google Scholar]
- 26. Carter LM, Isenberg DA, Ehrenstein MR. Elevated serum BAFF levels are associated with rising anti–double‐stranded DNA antibody levels and disease flare following B cell depletion therapy in systemic lupus erythematosus. Arthritis Rheum 2013;65:2672–9. [DOI] [PubMed] [Google Scholar]
- 27. Badr G, Borhis G, Lefevre EA, Chaoul N, Deshayes F, Dessirier V, et al. BAFF enhances chemotaxis of primary human B cells: a particular synergy between BAFF and CXCL13 on memory B cells. Blood 2008;111:2744–54. [DOI] [PubMed] [Google Scholar]
- 28. Halpern WG, Lappin P, Zanardi T, Cai W, Corcoran M, Zhong J, et al. Chronic administration of belimumab, a BLyS antagonist, decreases tissue and peripheral blood B‐lymphocyte populations in cynomolgus monkeys: pharmacokinetic, pharmacodynamic, and toxicologic effects. Toxicol Sci 2006;91:586–99. [DOI] [PubMed] [Google Scholar]
- 29. Stohl W, Hiepe F, Latinis KM, Thomas M, Scheinberg MA, Clarke A, et al. Belimumab reduces autoantibodies, normalizes low complement levels, and reduces select B cell populations in patients with systemic lupus erythematosus. Arthritis Rheum 2012;64:2328–37. [DOI] [PMC free article] [PubMed] [Google Scholar]
- 30. Huang W, Quach TD, Dascalu C, Liu Z, Leung T, Byrne‐Steele M, et al. Belimumab promotes negative selection of activated autoreactive B cells in systemic lupus erythematosus patients. JCI Insight 2018;3:e122525. [DOI] [PMC free article] [PubMed] [Google Scholar]
- 31. Ramskold D, Parodis I, Lakshmikanth T, Sippl N, Khademi M, Chen Y, et al. B cell alterations during BAFF inhibition with belimumab in SLE. EBioMedicine 2019;40:517–27. [DOI] [PMC free article] [PubMed] [Google Scholar]
- 32. Kraaij T, Kamerling SW, de Rooij EN, van Daele PL, Bredewold OW, Bakker JA, et al. The NET‐effect of combining rituximab with belimumab in severe systemic lupus erythematosus. J Autoimmun 2018;91:45–54. [DOI] [PubMed] [Google Scholar]
- 33. Anjorin A, Lipsky P. Engaging African ancestry participants in SLE clinical trials. Lupus Sci Med 2018;5:e000297. [DOI] [PMC free article] [PubMed] [Google Scholar]
Associated Data
This section collects any data citations, data availability statements, or supplementary materials included in this article.
Supplementary Materials
Supplementary Material
Data Availability Statement
Data sets for these analyses are accessible through TrialShare, a public website managed by the Immune Tolerance Network (https://www.itntrialshare.org/CALIBRATE.url). This website allows the user to filter the underlying data and generate figures and results from the analysis, in addition to those submitted as part of the published reports.