

Abstract
The application of double electron‐electron resonance (DEER) with site‐directed spin labeling (SDSL) to measure distances in proteins and protein complexes in living cells puts rigorous restraints on the spin‐label. The linkage and paramagnetic centers need to resist the reducing conditions of the cell. Rigid attachment of the probe to the protein improves precision of the measured distances. Here, three two‐armed GdIII complexes, GdIII‐CLaNP13a/b/c were synthesized. Rather than the disulfide linkage of most other CLaNP molecules, a thioether linkage was used to avoid reductive dissociation of the linker. The doubly GdIII labeled N55C/V57C/K147C/T151C variants of T4Lysozyme were measured by 95 GHz DEER. The constructs were measured in vitro, in cell lysate and in Dictyostelium discoideum cells. Measured distances were 4.5 nm, consistent with results from paramagnetic NMR. A narrow distance distribution and typical modulation depth, also in cell, indicate complete and durable labeling and probe rigidity due to the dual attachment sites.
Keywords: double electron–electron resonance (DEER), EPR spectroscopy, gadolinium, protein structures, spin labels
Two armed and ready! A two armed, thus rigid, GdIII‐CLaNP13 probe for double electron–electron resonance (DEER) measurements on proteins can be used to measure nanometer distances in cells with high precision.

Introduction
Structural studies are generally performed in vitro, on isolated and purified protein samples. However, proteins function in a complex environment, interacting with a range of large and small molecules under conditions that differ strongly from a diluted aqueous solution. Hence, it can be of relevance to study protein structures and interactions also in cell lysates or within a cell. Distance measurements by double electron‐electron resonance (DEER, also named PELDOR) techniques[ 1 , 2 ] allow distance restraints to be obtained by measuring the dipolar interaction between two electron spins.[ 3 , 4 , 5 ] Such techniques yield distance information in the range of 2–16 nm.[ 6 , 7 , 8 ] While naturally occurring paramagnetic centers are the classical object of study for EPR, the range of EPR has expanded significantly by the use of spin labels. These labels are introduced at specific sites, using site‐directed spin labeling (SDSL). For DEER experiments, two labels are introduced into the system at a distance suitable to obtain a DEER signal. The introduced paramagnetic centers should have minimal motional freedom relative to the protein to reduce the width of the distance distribution obtained from the DEER experiment. In‐cell measurements introduce further requirements for the spin‐label. The cellular environment is strongly reducing, so both the spin‐label itself and the bond linking the probe to the protein need to be resistant to reduction.[ 9 , 10 , 11 ]
Nitroxide compounds are the most commonly applied spin‐labels in EPR spectroscopy for a large variety of distance measurements, due to their small size and handling ease.[ 12 , 13 ] The first in‐cell DEER measurement of a protein‐protein distance was obtained by injection of 3‐maleimido‐PROXYL labeled human ubiquitin into oocytes. [13] In [13], the maleimide functional group was conjugated to a cysteine residue. Unlike a disulfide bridge, the C−S bond between the cysteine and maleimide group is resistant to reduction;[ 15 , 16 , 17 ] however, the nitroxide radical can be reduced under cellular conditions, [14] rendering it diamagnetic. The resistance of nitroxides towards reduction can be increased through modification of the nitroxide‐containing ring, usually by attaching substituents.[ 18 , 19 ] Other approaches replaced the nitroxide by other radical types, such as the trityl radical;[ 20 , 21 ] see also the review by Bonucci et al. [22]
Here we focus on one such alternative, the GdIII ion, with S=7/2, which has a better stability than the standard nitroxides and, especially at high magnetic field, provides high sensitivity and therefore is a good candidate for in‐cell DEER measurements.[ 23 , 24 , 25 ] A DOTA (1,4,7,10‐tetraazacyclododecane‐1,4,7,10‐tetraacetic acid) based GdIII complex, functionalized with a maleimide group, was successfully used for in‐cell DEER on a protein, although a wide distance distribution was found, due to the flexibility of the linker. [26] Different strategies were applied to reduce the mobility of the tag. One is to employ tags with a rigid attachment group or a rigid coordination ring.[ 27 , 28 , 29 , 30 , 31 ] Alternatively, the probe can be anchored via two arms to the protein.[ 32 , 33 ] To date, no probes were reported that are equipped with two arms using maleimide groups for attachment to enable DEER measurements with high distance resolution in vitro or in cells.
Here, we report the synthesis of three two‐armed GdIII complexes, CLaNP13a/b/c, as spin labels for EPR experiments that are designed for use in an in‐cell experiment. By 95 GHz DEER we show that these labels are functional in Dictyostelium discoideum cells. Narrow distance distributions are found and the distances are in good agreement with distances derived from paramagnetic NMR experiments.
Results
Design and synthesis of GdIII‐CLaNP13
The caged lanthanoid NMR probe (Figure 1 A, CLaNP5) is a well‐studied two‐armed LnIII probe for paramagnetic NMR spectroscopy on proteins. The cyclen based molecule is equipped with two pyridine N‐oxide coordination arms that reduce the arm rotation (Figure 1).[ 32 , 34 ] Using CLaNP5 as a building block, Gd‐CLaNP13 was designed, in which the arms for protein attachment were functionalized with maleimide groups. The length of the linker was varied from two to four methylene groups (Figure 1). Maleimide can readily and specifically react with the thiol group of a cysteine side chain, forming a carbon–sulfur bond, which is not prone to reduction. [26] Following the synthesis route of CLaNP5, the tetra‐N‐alkylated compound 3 was obtained with good yield (see the Supporting Information, Scheme S1). The carboxy groups were coupled to amino alkanes of different lengths, carrying the maleimide groups, to afford 4, which tightly chelates GdIII, giving CLaNP13.
Figure 1.
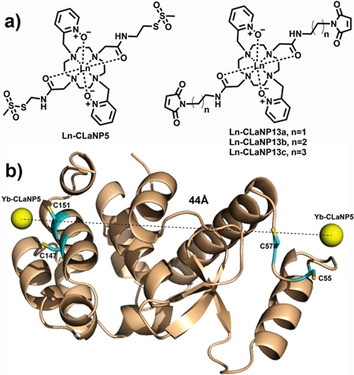
CLaNP13 and T4Lys as model protein. a) Structures of LnIII‐CLaNP5 and LnIII‐CLaNP13. b) Model of the structure of T4Lys based on PDB entry 3dke [47] with two Cys pairs for the attachment of two probes. The positions of the metal ions are based on PCS analysis using YbIII‐CLaNP5 as a paramagnetic probe. The backbone is drawn in ribbon representation. The Cys residues used for attachment have been modeled into the structure and are shown as sticks. The metal ions are shown as yellow spheres.
Protein labeling and paramagnetic NMR studies
A 15N‐enriched variant of T4 lysozyme (T4Lys) with the substitutions K147C/T151C was used to determine optimal conditions for protein labeling on the basis of LC‐MS and NMR results. Extensive LC‐MS analysis of the three probes attached to K147C/T151C T4L confirmed quantitative double labeling (for details, see the Supporting Information, Figure S1 and Table S1). Paramagnetic NMR spectra also provide evidence for complete labeling. An overlay of 1H‐15N HSQC spectra of CLaNP13 loaded with LuIII or GdIII shows that in the spectrum of the latter sample some peaks completely disappear, such as the resonances of the amides of I100, S117 and L121, due to strong paramagnetic relaxation broadening (Figure S2). If untagged protein were present, residual intensities would be expected. 15N‐enriched T4Lys K147C/T151C was also tagged with YbIII loaded CLaNP13 to generate pseudocontact shifts (PCS). As expected, in the 1H‐15N HSQC spectra more than one set of PCS was observed for many amide groups (Figure S2). The PCS is dependent on the position of the nucleus within the frame of the tensor that describes the anisotropic components of the magnetic susceptibility (Δχ tensor). The reaction of the maleimide functionalities with protein generates stereoisomers, and thus, the probe can bind in slightly different ways to the protein, causing the lanthanoid cage to be in different orientations, resulting in multiple PCS. However, it is expected that the different forms have the metal ion in almost the same position, so the effect of having different forms on the DEER distance measurements is expected to be small. To estimate the metal positions relative to the T4Lys protein structure, 15N‐enriched T4Lys K149C/T151C and T4Lys N55C/V57C were tagged with YbIII‐ or LuIII‐CLaNP5 and PCS were determined by 1H‐15N HSQC (Figure 2 (detail), Figure S3 (full spectra)). In both cases, a single set of PCS was found and the PCS fitted well to Equation S1, yielding the Δχ tensor principal values and orientations as well as the metal‐ion positions (Table S2, Figure S4 and Figure 1). The magnitudes of the Δχax tensor components differ between the two variants. The value for T4Lys N55C/V57C is somewhat lower than the one usually obtained (8.5×10⁻³² m3).[ 34 , 35 , 36 ] The two cysteine residues are located in a loop, so the reduced Δχax value could point to some flexibility of the probe due to loop motions. The Δχ is very sensitive to motion, so the amplitude of the motion is expected to be small, compared to, for example, a single‐armed probe. [32] The Δχax for the other variant, T4Lys K149C/T151C, is large, suggesting the probe is rigid relative to the protein. The metal ion positions were combined in a model shown in Figure 1 b, yielding a distance of 44 Å between the two lanthanoid ions.
Figure 2.
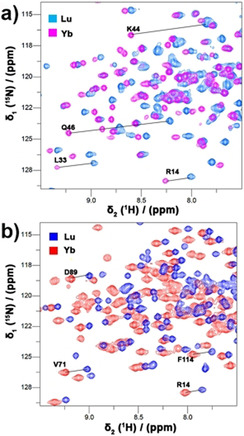
Details of overlaid 1H‐15N HSQC spectra of YbIII and LuII loaded CLaNP5 attached to T4Lys N55C/V57C (a) and T4Lys K147C/T151C (b). Several PCS are indicated with solid lines and residue numbers. The NMR spectra were recorded at 14.1 T (600 MHz). The full spectra are shown in Figure S3.
EPR experiments
For the EPR experiments, the quadruple cysteine mutant T4Lys N55C/V57C/K147C/T151C was labeled with GdIII‐CLaNP13, variants a, b, or c (Figure 1 a). The resulting constructs are referred to as Gd13iT4L with i: a, b, c. The LC‐MS results showed that the samples were labeled with two probes and the labeling efficiency was more than 95 % (Figure S5 and Table S1). In the following we will describe the experimental results. We refer to investigations of the protein constructs in buffer as “in vitro”.
The echo detected EPR spectrum of the Gd13bT4L is shown as an inset in Figure 3 a and Figure S7. All three constructs have similar spectra. Specifically, they consist of a central narrow line due to the ms=− ↔+ transition that is superimposed on a broad background due to all other transitions. The widths of the central transitions for the different tags are shown in Table 1, and it can be noticed that Gd13bT4L has the narrowest central transition of the three.
Figure 3.
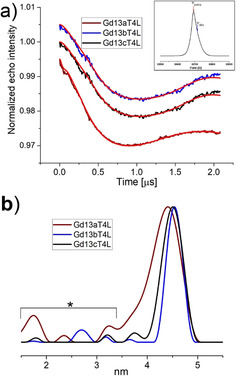
DEER data of Gd13aT4L, Gd13bT4L, Gd13cT4L. a) Background corrected DEER traces. Traces are shifted vertically for clarity. Measurements were performed at 10 K for 6 to 12 hours. Red lines: fits obtained with the distance distributions shown in (b) obtained after Tikhonov regularization (α=100). Peaks marked with an asterisk do not contribute significantly to the data, as determined by the DeerAnalysis suppression tool. [48] Inset: 95 GHz field‐swept electron‐spin echo spectrum (FSESE) of the central transition region, position of the pump and observer frequencies are shown.
Table 1.
Properties of the Gd ion in Gd13iT4L (i=a,b,c) derived from EPR and DEER. Given are the full‐width at half maximum (FWHM) of the central line of the field‐swept electron‐spin echo spectrum (FSESE), the maxima of the distance distributions (d.d.) and the FWHM of the distance distributions obtained with Tikhonov regularization (α=100). Errors of d.d. derived from DeerAnalysis validation (see the Supporting Information).
|
Sample |
Width EPR m s±1/2 trans.[a] |
Distance |
Width d.d. [a] |
|---|---|---|---|
|
|
[MHz] |
[nm] |
[nm] |
|
Gd13aT4L |
144±2 |
4.41±0.11 |
0.7±0.2 |
|
Gd13bT4L |
113±4 |
4.54±0.09 |
0.4±0.2 |
|
Gd13cT4L |
136±2 |
4.51±0.04 |
0.5±0.3 |
[a] The full‐width at half maximum (FWHM).
Distance measurements
The DEER data of all three Gd13iT4L (i=a, b, c) constructs are depicted in Figure 3. The raw DEER data are shown in Figure S8, the validation in Figure S11. The distances obtained for all constructs are close to 4.5 nm (Table 1). The distances between the two GdIII ions in Gd13bT4L and Gd13cT4L agree within the experimental uncertainty. The distance in Gd13aT4L is shorter by 0.1 nm; however, given the experimentally determined errors, see the Supporting Information, this difference cannot be considered significant. The recently developed methodology to analyze DEER distance distributions by statistics methods could be applied here.[ 37 , 38 ]
The modulation depth, in the order of 2 %, is typical for 95 GHz DEER on GdIII samples: usually depths between 2 % and 5 % are observed.[ 12 , 24 ] The stability of the label in more complex environmental conditions was checked by incubating Gd13iT4L in Escherichia coli lysate for a total time of 18 hours. The DEER traces are similar and the distance distributions are identical within the noise to the in vitro samples (see Figure S9). No systematic decay of the modulation depth was observed over the period of 18 hours. Since the uncertainty in the modulation depth is in the order of 25 %, we cannot exclude that a decay in that order occurs over time, even though we do not find systematic changes in modulation depth.
In‐cell DEER
To investigate whether the label is stable in the cell, we measured DEER of Gd13bT4L in Dictyostelium discoideum (D. discoideum) cells. The in‐cell sample was prepared as described in Materials and Methods (see the Supporting Information). Fluorescence microscopy on an ATTO‐647‐maleimide tagged T4Lys K147C/T151C variant shows that the protein enters the cells, and that protein outside the cell was efficiently removed by washing with PBS buffer. The bright fluorescent spots observed within the cell indicate that the protein is likely to be contained within vesicles such as endosomes. The DEER traces in Figure 4, therefore, result from Gd13bT4L incorporated into the cells. Cells thawed after the DEER experiments were shown to be viable by live‐cell microscopy (see the Supporting Information).
Figure 4.
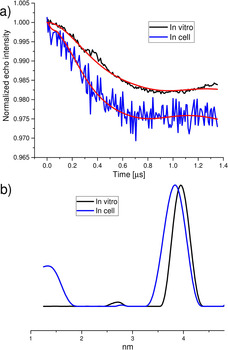
The DEER trace of the protein in Dictyostelium discoideum (D. discoideum) cells for Gd‐CLaNP13bT4L (blue). Reference (black): in vitro trace of Gd‐CLaNP13bT4L, truncated to the total evolution time of the in cell data (1356 ns). a) Background corrected DEER traces. Red lines: fits obtained with the distance distributions shown in b) obtained by Tikhonov regularization (α=100). The difference in the distance distributions shown in (b) is not significant (see result of DEER validation Figure S11 d).
The trace in Figure 4 a has a clear DEER modulation, with a minimum at 0.6 μs, which is also visible in the raw data (Figure S8 d). The DEER trace of Gd13bT4L in the cell was measured with a shorter evolution time (Figure 4 a) than that of the in vitro samples (Figure 3), to obtain sufficient signal, that is, to compensate for the lower protein concentration of the in cell sample. Therefore, in Figure 4, the DEER time trace of the in vitro sample is truncated to the same total evolution time as the in cell sample to serve as a valid reference. The superposition of the resulting distance distributions (Figure 4 b) shows that the distance traces are close to each other. The validation of the distance distribution reveals that the distance distribution of the in vitro data (Figure 4 b) falls within the confidence range of the in cell data (Figure S11 d).
As a consequence of the shorter evolution time of the in cell DEER experiments, the parameters of the distance distribution, that is, the distance and the width of the distribution, have a higher uncertainty than those of the longer evolution time used for the in vitro samples. This is taken into account in the validation procedure, which shows a larger uncertainty of the shorter time‐trace data (cf. Figure S11 d and b).
The visible modulation of the in cell DEER (Figure 4 a) is consistent with a folded state of the protein in the cell, which is also in agreement with the similarity in the widths of the distance distributions (Figure 4 b) of in vitro and in cell experiments. The presence of visible modulation and the modulation depth shows that the majority of the protein is coupled to two Gd‐ions, and that their distance is as expected from the in vitro reference data. Further DEER experiments on Gd13bT4L in D. discoideum cell lysate and medium (for details, see the Supporting Information) and in E. coli cell lysates (see Figures S9 and S10) confirmed the stability of the label over time and, by virtue of the absence of changes in the widths of the distributions, the label attachment.
Discussion
Here, we report the synthesis of double‐armed, rigid CLaNP tags linked by maleimide linkers to a protein to generate a GdIII spin label that is stable under in‐cell conditions. Having two arms and a rigid CLaNP design should further improve the accuracy of DEER distance measurements. Three tags were obtained, Gd‐CLaNP13a,b,c, which were synthesized in good yields and had high labeling efficiencies when attached to the protein T4L. All tags show clear DEER modulations with the expected modulation depth, confirming the reliable double labeling of the protein, inferred from mass spectrometry. Partial labeling by only one tag/protein would reduce the modulation depth, tags attached by only one arm should lead to broader DEER distance distributions and less pronounced modulation, neither of which is observed to any significant degree. Both the DEER time traces and distance distributions are similar for the three Gd13iT4L (i=a, b, c) tags (Figure 3). All distances (Table 1) agree well with the distance of 4.4 nm inferred from paramagnetic NMR data using the CLaNP‐5 probes as mimics of CLaNP‐13 (see Figure 1 a and Results Section). Considering that for the three linkers Gd13iT4L from i=a to c, one methylene group is added per linker arm, the differences in distances for the three linkers are small, and the distances do not increase commensurate with linker length increase. This suggests that the linkers take on particular conformations, or that GdIII interactions with the protein surface could differ for the three linkers, leading to distances that do not increase monotonously with the linker length. The width of the distance distribution, albeit small, is not exceptionally small considering the results of GdIII DEER experiments performed on proteins with singly linked probes,[ 25 , 27 , 39 , 40 ] and certainly does not reach the record narrowness observed in a CuII based construct. [41] Perhaps part of the width of the distribution observed in the present study is due to a distribution of conformations of the protein loop to which the GdIII ion is attached at residues 55 and 57. The smaller Δχ values for the CLaNP5‐Yb at that position (see Results Section) could hint in this direction.
Having thus established that the constructs show the expected properties in vitro, we proceeded to study their resistance to cellular environments. In E. coli lysate, over a period of 18 h, no deterioration was detected within experimental limits, placing an upper limit of any possible decay at 25 % (see the Supporting Information), a value that is largely determined by the experimental uncertainty. Prompted by the stability of the tags both in vitro and in E. coli lysate, in cell measurements were performed with Gd13bT4L. Dictyostelium discoideum was selected, because it is known for its high uptake of extracellular components. [42] The uptake was verified by fluorescence microscopy (see the Results Section and Supporting Information). The protein appears to be concentrated inside small vesicles, and there the estimated concentration is around 5 μm. The cells were shown to be viable after the DEER experiments (see the Supporting Information). The DEER results of Gd13bT4L in cells are promising: The modulation depth of 1.5 % is smaller than observed in vitro and in E. coli lysate, but the difference is close to the error margins of the data (Figure 4 a). We attribute the lower signal‐to‐noise ratio of the DEER trace of Gd13bT4L in the D. discoideum cells (Figure 4 a) to the lower protein concentration and the 40 % shorter accumulation time compared to in vitro experiments. The distance distribution (Figure 4 b) has a width that is similar to that of Gd13bT4L in vitro. The similarity of the distance and the width of the distribution is a good indicator that also in the cell the protein has a well‐defined structure, and that the spin label remains bound, for more detail, see the Results Section. The lower concentration of the protein inside the cell required a shorter DEER evolution time, which, at a given distance between the paramagnetic centers probed, makes the distance‐distribution parameters less reliable. Therefore, the in cell data is not sufficiently accurate to draw conclusions about details of the conformation of the protein in the cells. From FRET and other experiments, it is known that T4Lyzozyme can undergo conformational transitions that result in distance changes in the order of 0.5 nm, depending on the state of the protein.[ 43 , 44 ] Ultimately, in cell experiments are designed to detect such changes, [10] and the design of suitable labels, as performed in the present study, is a necessary step towards this goal.
The present set of experiments shows that the linker synthesized is very well suited to perform its task, and that in cell measurements are feasible. After further optimization of methods to introduce the protein into the cells, the in cell concentrations should be sufficient to detect changes of the protein conformation as a function of the cell state.
Conclusion
Double maleimide groups were introduced to link lanthanide ions to the protein via two C−S bonds, resulting in a link that is fully stable under cellular conditions. The two‐cysteine mutations required to attach the label to the proteins can be designed by modeling and were shown not to interfere with protein structure and performance in many cases. Therefore, the labels presented here should be applicable universally, enabling in cell measurements in a multitude of contexts. The double arm design has proven in the past to immobilize the spin label, promising distance distributions that reflect protein conformation faithfully. The GdIII‐CLaNP13a,b,c are promising new candidates for in‐cell GdIII DEER experiments and should be suitable to detect in‐cell protein conformational changes and domain motions.[ 45 , 46 ]
Conflict of interest
The authors declare no conflict of interest.
Supporting information
As a service to our authors and readers, this journal provides supporting information supplied by the authors. Such materials are peer reviewed and may be re‐organized for online delivery, but are not copy‐edited or typeset. Technical support issues arising from supporting information (other than missing files) should be addressed to the authors.
Supplementary
Acknowledgements
The authors acknowledge support from the Chinese Scholarship Council (CSC grant to Q.M., No. 201506870013). This work was also funded by Netherlands Organization for Scientific Research (NWO) (Grant No. 711.014.003 to M.H.), the Fraunhofer Society for the Fraunhofer Attract grant “3DNanoCell” and the Fraunhofer ICON grant “BioSensing”, NWO/OCW, in particular the Spinoza Prize 2014 for Professor Dirk Bouwmeester (to D.d.B.). We thank Professor Dirk Bouwmeester for constant interest in and support of this project. Dr. Bogdan Florea (Leiden Institute of Chemistry) is acknowledged for his help with MS experiments and Dr. Simon Skinner for CLaNP5 labeled T4lys NMR data. Dr. Günther Gerisch (MPI for Biochemistry, Martinsried, Germany) is thanked for providing axenic D. discoideum (Ax2) cells and Hans van der Elst for assistance with HPLC purification and HRMS measurements.
Q. Miao, E. Zurlo, D. de Bruin, J. A. J. Wondergem, M. Timmer, A. Blok, D. Heinrich, M. Overhand, M. Huber, M. Ubbink, Chem. Eur. J. 2020, 26, 17128.
DEER=double electron–electron resonance.
Contributor Information
Dr. Martina Huber, Email: huber@physics.leidenuniv.nl.
Prof. Dr. Marcellus Ubbink, Email: m.ubbink@chem.leidenuniv.nl.
References
- 1. Schiemann O., Prisner T. F., Q. Rev. Biophys. 2007, 40, 1–53. [DOI] [PubMed] [Google Scholar]
- 2. Jeschke G., Polyhach Y., Phys. Chem. Chem. Phys. 2007, 9, 1895–1910. [DOI] [PubMed] [Google Scholar]
- 3. Dias D. M., Ciulli A., Prog. Biophys. Mol. Biol. 2014, 116, 101–112. [DOI] [PMC free article] [PubMed] [Google Scholar]
- 4. Clayton J. A., Keller K., Qi M., Wegner J., Koch V., Hintz H., Godt A., Han S., Jeschke G., Sherwin M. S., Yulikov M., Phys. Chem. Chem. Phys. 2018, 20, 10470–10492. [DOI] [PMC free article] [PubMed] [Google Scholar]
- 5. Borbat P. P., Freed J. H., in: Structural Information from Spin-Labels and Intrinsic Paramagnetic, Centres in the Biosciences (Eds.: R. Timmel C., R. Harmer J.), Springer, Heidelberg, 2013, pp. 1–82. [Google Scholar]
- 6. Drescher M., Top. Curr. Chem. 2011, 321, 91–119. [DOI] [PubMed] [Google Scholar]
- 7. Schmidt T., Wälti M. A., Baber J. L., Hustedt E. J., Clore G. M., Angew. Chem. Int. Ed. 2016, 55, 15905–15909; [DOI] [PMC free article] [PubMed] [Google Scholar]; Angew. Chem. 2016, 128, 16137–16141. [Google Scholar]
- 8. Jeschke G., Annu. Rev. Phys. Chem. 2012, 63, 419–446. [DOI] [PubMed] [Google Scholar]
- 9. Goldfarb D., Phys. Chem. Chem. Phys. 2014, 16, 9685–9699. [DOI] [PubMed] [Google Scholar]
- 10. Yang Y., Yang F., Li X. Y., Su X. C., Goldfarb D., J. Phys. Chem. B 2019, 123, 1050–1059. [DOI] [PubMed] [Google Scholar]
- 11. Krstić I., Hänsel R., Romainczyk O., Engels J. W., Dötsch V., Prisner T. F., Angew. Chem. Int. Ed. 2011, 50, 5070–5074; [DOI] [PubMed] [Google Scholar]; Angew. Chem. 2011, 123, 5176–5180. [Google Scholar]
- 12. Kaminker I., Bye M., Mendelman N., Gislason K., Sigurdsson S. T., Goldfarb D., Phys. Chem. Chem. Phys. 2015, 17, 15098–15102. [DOI] [PubMed] [Google Scholar]
- 13. Azarkh M., Okle O., Eyring P., Dietrich D. R., Drescher M., J. Magn. Reson. 2011, 212, 450–454. [DOI] [PubMed] [Google Scholar]
- 14. Igarashi R., Sakai T., Hara H., Tenno T., Tanaka T., Tochio H., Shirakawa M., J. Am. Chem. Soc. 2010, 132, 8228–8229. [DOI] [PubMed] [Google Scholar]
- 15. Müntener T., Häussinger D., Selenko P., Theillet F. X., J. Phys. Chem. Lett. 2016, 7, 2821–2825. [DOI] [PubMed] [Google Scholar]
- 16. Yang Y., Wang J. T., Pei Y. Y., Su X. C., Chem. Commun. 2015, 51, 2824–2827. [DOI] [PubMed] [Google Scholar]
- 17. Yang Y., Yang F., Gong Y. J., Bahrenberg T., Feintuch A., Su X. C., Goldfarb D., J. Phys. Chem. Lett. 2018, 9, 6119–6123. [DOI] [PubMed] [Google Scholar]
- 18. Karthikeyan G., Bonucci A., Casano G., Gerbaud G., Abel S., Thomé V., Kodjabachian L., Magalon A., Guigliarelli B., Belle V., Ouari O., Mileo E., Angew. Chem. Int. Ed. 2018, 57, 1366–1370; [DOI] [PubMed] [Google Scholar]; Angew. Chem. 2018, 130, 1380–1384. [Google Scholar]
- 19. Bleicken S., Assafa T. E., Zhang H., Elsner C., Ritsch I., Pink M., Rajca S., Jeschke G., Rajca A., Bordignon E., ChemistryOpen 2019, 8, 1057–1065. [DOI] [PMC free article] [PubMed] [Google Scholar]
- 20. Fleck N., Heubach C. A., Hett T., Haege F. R., Bawol P. P., Baltruschat H., Schiemann O., Angew. Chem. Int. Ed. 2020, 59, 9767–9772; [DOI] [PMC free article] [PubMed] [Google Scholar]; Angew. Chem. 2020, 132, 9854–9859. [Google Scholar]
- 21. Yang Y., Pan B.-B., Tan X., Yang F., Liu Y., Su X.-C., Goldfarb D., J. Phys. Chem. Lett. 2020, 11, 1141–1147. [DOI] [PMC free article] [PubMed] [Google Scholar]
- 22. Bonucci A., Ouari O., Guigliarelli B., Belle V., Mileo E., ChemBioChem 2020, 21, 451–460. [DOI] [PubMed] [Google Scholar]
- 23. Clayton J. A., Qi M., Godt A., Goldfarb D., Han S., Sherwin M. S., Phys. Chem. Chem. Phys. 2017, 19, 5127–5136. [DOI] [PMC free article] [PubMed] [Google Scholar]
- 24. Matalon E., Huber T., Hagelueken G., Graham B., Frydman V., Feintuch A., Otting G., Goldfarb D., Angew. Chem. Int. Ed. 2013, 52, 11831–11834; [DOI] [PubMed] [Google Scholar]; Angew. Chem. 2013, 125, 12047–12050. [Google Scholar]
- 25. Feintuch A., Otting G., Goldfarb D., Methods Enzymol. 2015, 563, 415–457. [DOI] [PubMed] [Google Scholar]
- 26. Bellapadrona G., Martorana A., Goldfarb D., Aime S., Feintuch A., Di Gregorio E., J. Am. Chem. Soc. 2014, 136, 13458–13465. [DOI] [PubMed] [Google Scholar]
- 27. Yang Y., Yang F., Gong Y.-J., Chen J.-L., Goldfarb D., Su X.-C., Angew. Chem. Int. Ed. 2017, 56, 2914–2918; [DOI] [PubMed] [Google Scholar]; Angew. Chem. 2017, 129, 2960–2964. [Google Scholar]
- 28. Häussinger D., Huang J. R., Grzesiek S., J. Am. Chem. Soc. 2009, 131, 14761–14767. [DOI] [PubMed] [Google Scholar]
- 29. Müntener T., Kottelat J., Huber A., Häussinger D., Bioconjugate Chem. 2018, 29, 3344–3351. [DOI] [PubMed] [Google Scholar]
- 30. Yang F., Wang X., Bin Pan B., Su X. C., Chem. Commun. 2016, 52, 11535–11538. [DOI] [PubMed] [Google Scholar]
- 31. Joss D., Bertrams M. S., Häussinger D., Chem. Eur. J. 2019, 25, 11910–11917. [DOI] [PubMed] [Google Scholar]
- 32. Keizers P. H. J., Desreux J. F., Overhand M., Ubbink M., J. Am. Chem. Soc. 2007, 129, 9292–9293. [DOI] [PubMed] [Google Scholar]
- 33. Fleissner M. R., Bridges M. D., Brooks E. K., Cascio D., Kalai T., Hideg K., Hubbell W. L., Proc. Natl. Acad. Sci. USA 2011, 108, 16241–16246. [DOI] [PMC free article] [PubMed] [Google Scholar]
- 34. Keizers P. H. J., Saragliadis A., Hiruma Y., Overhand M., Ubbink M., J. Am. Chem. Soc. 2008, 130, 14802–14812. [DOI] [PubMed] [Google Scholar]
- 35. Bertini I., Calderone V., Cerofolini L., Fragai M., Geraldes C. F. G. C., Hermann P., Luchinat C., Parigi G., Teixeira J. M. C., FEBS Lett. 2012, 586, 557–567. [DOI] [PubMed] [Google Scholar]
- 36. Camacho-Zarco A. R., Munari F., Wegstroth M., Liu W.-M., Ubbink M., Becker S., Zweckstetter M., Angew. Chem. Int. Ed. 2015, 54, 336–339; [DOI] [PMC free article] [PubMed] [Google Scholar]; Angew. Chem. 2015, 127, 343–346. [Google Scholar]
- 37. Edwards T. H., Stoll S., J. Magn. Reson. 2016, 270, 87–97. [DOI] [PMC free article] [PubMed] [Google Scholar]
- 38. Ibáñez L. F., Jeschke G., J. Magn. Reson. 2019, 300, 28–40. [DOI] [PubMed] [Google Scholar]
- 39. Qi M., Groß A., Jeschke G., Godt A., Drescher M., J. Am. Chem. Soc. 2014, 136, 15366–15378. [DOI] [PubMed] [Google Scholar]
- 40. Yagi H., Banerjee D., Graham B., Huber T., Goldfarb D., Otting G., J. Am. Chem. Soc. 2011, 133, 10418–10421. [DOI] [PubMed] [Google Scholar]
- 41. Wort J. L., Ackermann K., Giannoulis A., Stewart A. J., Norman D. G., Bode B. E., Angew. Chem. Int. Ed. 2019, 58, 11681–11685; [DOI] [PMC free article] [PubMed] [Google Scholar]; Angew. Chem. 2019, 131, 11807–11811. [Google Scholar]
- 42. Neuhaus E. M., Almers W., Soldati T., Mol. Biol. Cell 2002, 13, 1390–1407. [DOI] [PMC free article] [PubMed] [Google Scholar]
- 43. Lu H. P., Phys. Chem. Chem. Phys. 2011, 13, 6734–6749. [DOI] [PubMed] [Google Scholar]
- 44. Chen J.-L., Yang Y., Zhang L.-L., Liang H., Huber T., Su X.-C., Otting G., Phys. Chem. Chem. Phys. 2016, 18, 5850–5859. [DOI] [PubMed] [Google Scholar]
- 45. Dalaloyan A., Martorana A., Barak Y., Gataulin D., Reuveny E., Howe A., Elbaum M., Albeck S., Unger T., Frydman V., Abdelkader E. H., Otting G., Goldfarb D., ChemPhysChem 2019, 20, 1860–1868. [DOI] [PubMed] [Google Scholar]
- 46. Hänsel R., Luh L. M., Corbeski I., Trantirek L., Dötsch V., Angew. Chem. Int. Ed. 2014, 53, 10300–10314; [DOI] [PubMed] [Google Scholar]; Angew. Chem. 2014, 126, 10466–10480. [Google Scholar]
- 47. Liu L., Quillin M. L., Matthews B. W., Proc. Natl. Acad. Sci. USA 2008, 105, 14406–14411. [DOI] [PMC free article] [PubMed] [Google Scholar]
- 48. Jeschke G., Chechik V., Ionita P., Godt A., Zimmermann H., Banham J., Timmel C. R., Hilger D., Jung H., Appl. Magn. Reson. 2006, 30, 473–498. [Google Scholar]
Associated Data
This section collects any data citations, data availability statements, or supplementary materials included in this article.
Supplementary Materials
As a service to our authors and readers, this journal provides supporting information supplied by the authors. Such materials are peer reviewed and may be re‐organized for online delivery, but are not copy‐edited or typeset. Technical support issues arising from supporting information (other than missing files) should be addressed to the authors.
Supplementary