

Abstract
Most commonly, next generation sequencing‐based microbiome studies are performed on the total DNA (totDNA) pool; however, this consists of extracellular‐ (exDNA) and intracellular (iDNA) DNA fractions. By investigating the microbiomes of different anaerobic digesters over time, we found that totDNA suggested lower species richness considering all and/or only common species and yielded fewer unique reads as compared to iDNA. Additionally, exDNA‐derived sequences were more similar to those from totDNA than from iDNA and, finally, iDNA showed the best performance in tracking temporal changes in microbial communities. We postulate that abundant sequences present within the exDNA fraction mask the overall results of totDNA and provide evidence that exDNA has the potential to qualitatively bias microbiome studies at least in the anaerobic digester environment as it contains information about cells that were lysed hours or days ago. iDNA, however, was found to be more appropriate in providing reliable genetic information about potentially alive as well as rare microbes within the target habitat.
Keywords: 16S rRNA sequencing, anaerobic digestion, exDNA, iDNA, methanogenic archaea
1. INTRODUCTION
Since the advent of molecular microbial ecology, DNA extraction procedures have been investigated to evaluate if environmental samples should be subjected to a direct DNA extraction, or if microorganisms should be separated from the matrix prior to DNA analysis by performing an indirect extraction (Ascher et al., 2009; Bakken & Frostegård, 2006; Robe et al., 2003; Roose‐Amsaleg et al., 2001). Today, researchers tend to rely on commercially available extraction kits focusing on time‐/cost‐efficient strategies to obtain sufficient DNA for downstream analyses. In most cases, the entire environmental DNA (eDNA), also termed the total DNA pool (totDNA), is extracted from the samples (Taberlet et al., 2012). This eDNA is composed of intracellular DNA (iDNA) and—to an important extent—of extracellular DNA (exDNA), derived either from lysed cells and/or from active secretion by living cells (Nagler et al., 2018). It is transported by wind, water and organismal vectors (Pietramellara et al., 2009) and represents up to 90% of marine, 60% of soil‐borne and 80% of anaerobic digester totDNA pools (Nagler et al., 2018; Pietramellara et al., 2009; Torti et al., 2015). Resulting exDNA/iDNA ratios have been found to depend on the present microbial activity, on current cell lysis rates and on various environmental conditions (Gómez‐Brandón, Ascher‐Jenull, Bardelli, Fornasier, Sartori, et al., 2017; Nagler, Podmirseg, et al., 2018). Based on a different binding strength to organic or inorganic particles (e.g., soil colloids, cellular debris), exDNA per se can be further subdivided into free exDNA (fDNA) and bound exDNA (bDNA) (Ceccherini et al., 2009; Laktionov et al., 2004). Of these extracellular subfractions, fDNA was found more abundant and to correlate with microbial activity, suggesting that this fraction is generated not only via cell lysis, but also through DNA secretion during active microbial life stages (Nagler, Podmirseg, et al., 2018). Current research has shown that spatial microbial distribution patterns, as revealed by investigations of eDNA, might be masked by conserved exDNA (i.e., exDNA that is not immediately degraded after its generation). Depending on environmental conditions, the present microbial turnover rate and physical protection through binding to various particles, exDNA has been found to persist in many environments for shorter or longer time spans up to thousands of years (Agnelli et al., 2007; Carini et al., 2016; Corinaldesi et al., 2005; Fierer, 2017; Pietramellara et al., 2009).
In deep‐sea ecosystems, a third of operational taxonomic units (OTUs) and 10%–50% of all 16S rRNA gene copies were exclusively present within the exDNA pool, possibly reflecting ancient microbial communities (Corinaldesi et al., 2018). In surface sediments of a tropical freshwater lake, where fragments of exDNA or iDNA were separated via denaturing gradient gel electrophoresis (DGGE) and sequenced, exclusively exDNA‐derived sequences were considered exogenous to the sediments (Vuillemin et al., 2016). Other studies found only little influence of exDNA on the microbial community composition in both marine sediments and flooded soils, possibly because exDNA was assessed only indirectly by defining exDNA as totDNA minus iDNA (Gustave et al., 2019; Ramírez et al., 2018). This indirect observation of exDNA is based on a common method used to differentiate between the DNA fractions by analysing the total DNA in one aliquot and the iDNA in the other one after chemical exDNA‐removal (Wagner et al., 2008), making a direct investigation of exDNA impossible. Due to technical issues, however, the sum of exDNA and iDNA is often unequal to totDNA (Nannipieri et al., 2019). Apart from aquatic sediments, exDNA has been shown to play an important role in other environments such as soil or anaerobic sludge, although the molecular information stored in exDNA versus iDNA or totDNA has rarely been investigated. Comparative genetic fingerprinting with DGGE and quantitative polymerase chain reaction (qPCR) in soil and granular sludge retrieved additional taxonomic information from exDNA with regard to iDNA (Agnelli et al., 2004; Ascher et al., 2009; Cheng et al., 2011; Chronakova et al., 2013; Dominiak et al., 2011; Gómez‐Brandón, Ascher‐Jenull, Bardelli, Fornasier, Fravolini, et al., 2017; Gómez‐Brandón, Ascher‐Jenull, Bardelli, Fornasier, Sartori, et al., 2017).
Owing mainly to the so far unidentified importance of exDNA, next generation sequencing (NGS)‐based straightforward comparisons of all three DNA types—i.e., the sequentially extracted exDNA and iDNA, and the directly extracted totDNA (or eDNA)—have, to the best of our knowledge, not yet been conducted. Such an approach is urgently needed, because due to technical issues the sum of exDNA and iDNA is often unequal to totDNA (Ascher et al., 2009; Nannipieri et al., 2019) and a direct comparison (exDNA versus iDNA versus totDNA, see Figure S1a) might allow us to evaluate whether standard molecular approaches performed on totDNA are biased compared to the actually present microbial community as represented by iDNA.
In the present study, we took advantage of our previously established sequential DNA extraction method (Figure S1b) to assess the bacterial and archaeal taxonomic composition of exDNA and iDNA as compared to totDNA. Conducting a time‐course experiment with constant environmental conditions, we aimed to investigate the ability of various DNA types to track temporal changes in the composition of microbial communities.
By doing so, we aimed to test the model of Lennon et al. (2018) that predicts a bias of exDNA (or relic DNA, again defined as totDNA minus iDNA) for biodiversity estimates only if species abundance distributions of exDNA and iDNA fractions differ from each other.
As a habitat, we chose two differently treated batch anaerobic digesters inoculated with microbiota from different sources (rumen liquid and manure) that made part of a greater experiment as reported by Nagler et al. (2020). We hypothesized that, within different treatments, OTU richness and Shannon diversity as well as bacterial and archaeal microbiomes would differ among the three DNA types, and investigated species richness, main taxonomic classifications and common as well as unique sequences of the extra‐ and intracellular fractions in comparison to the totDNA pool (exDNA versus iDNA versus totDNA, see Figure S1a).
2. MATERIAL AND METHODS
2.1. Experimental setup
To generate active microbial communities with trackable and differing overall activities, the experiment comprised two anaerobic digestion (AD) approaches with different microbial inocula: (a) a mixture of various animal manures retrieved from a large biogas plant (i.e., treatment “Manure,” n = 3) and (b) the same manures bioaugmented with fresh cattle rumen (i.e., treatment “Rumen,” n = 3). Both treatments were supplied with differing substrates (i.e., Manure treatments with NaOH‐pretreated corn straw and Rumen treatments with untreated corn straw) and represented a closed system including the DNA of living and dead microorganisms derived from the inocula and from the substrates. To record how microbial activities and associated communities change over time, these mixtures were digested in a batch approach over the course of 14 days (for more details on experimental conditions, see Figure S2). As a proxy of AD efficiency, generated methane was quantified using the AMPTS II system (Automated Methane Potential Testing System, Bioprocess Control) and samples for molecular analyses were retrieved after 0, 20, 67 and 297 h (T0, T1, T2 and T3, respectively).
2.2. DNA extraction and 16S amplicon sequencing
Sequential DNA extraction yielding (a) exDNA—which was further discriminated based on its binding to cellular debris and/or environmental matrix (i.e., fDNA = free exDNA not bound, and bDNA = exDNA bound to particles) and (b) iDNA (retrieved from the remaining sample pellet) was conducted as described by Nagler, Podmirseg, et al. (2018) (see Figure S1b for a conceptual overview of the method), and compared to directly extracted totDNA. The Soil DNA Purification Kit (EURx) following the manufacturer's instructions was used with minor modifications: to yield all extractable DNA, the entire supernatant accruing at steps 6 (= centrifugal separation of lysed cell debris from intracellular components) and 9 (= precipitation of non‐DNA organic and inorganic material) was collected instead of a fixed volume indicated in the user guidelines.
For exDNA (fDNA and bDNA), bead beating as well as any step potentially inducing cell lysis were strictly omitted. Rather, these samples were mixed with the buffer solution from the bead tubes and then treated according to the protocol (starting from step 6, see. Figure S1b). For totDNA and iDNA, cell walls were disrupted with the FastPrep‐24 Instrument (MP Biomedicals), while in the case of iDNA extraction, this step was applied directly to the pellet remaining after exDNA‐recovery. The quality of DNA extracts were checked on 1% (w/v) agarose gels using GelGreen (Biotium Inc) as dye and quantity was measured with the Quantus Fluorometer (using the QuantiFluor Dye System for dsDNA and ssDNA, both Promega). For comparability, DNA quantities were expressed as µg per g dry weight (µg gDW−1) assessing the dry weight of a sample aliquot dried at 80°C until weight constancy.
As earlier studies suggested that fDNA represents the most variable and abundant exDNA fraction within these specific AD environments (Nagler, Podmirseg, et al., 2018), this fraction was chosen for in‐depth downstream characterization. Nevertheless, bDNA was used to calculate amounts of f + b + iDNA to be compared to totDNA. Extraction efficiencies of both extraction approaches (classical extraction [totDNA] versus summed‐up sequential extraction [f + b+iDNA]) were compared with one another at each time point and between each treatment. A total of 72 DNA extracts, resulting from two treatments (“Manure,” “Rumen”), three replicates, four time points and three DNA types (fDNA, iDNA, totDNA) was individually subjected to Illumina MiSeq (2 × 250 bp) paired‐end sequencing (Microsynth AG) after performing a two‐step PCR targeting bacteria and archaea via the V4 region of the 16S small‐subunit rRNA gene with the 515f/806r primer system (Caporaso et al., 2011). Raw sequence data were uploaded to be publicly available (Nagler et al., 2019).
2.3. Bioinformatics and statistics
Data processing was performed using the coma pipeline (Hupfauf et al., 2017) with default merging of paired‐end reads, and barcode‐ and primer‐trimming. Selected high‐quality reads showed <5% deviation from the mode sequence length and at least 99.9% base call accuracy (phred score ≥ 30). Applying a 97% similarity level, sequences were aligned and taxonomically assigned using the blast algorithm against SILVA SSU (release 132) as a primary taxonomic reference database and against Greengenes (release 13_5) as a secondary reference database if assignment was not possible. To reduce the influence of rare species, OTUs represented by only one read within all samples were excluded prior to rarefaction analysis. After examining total read numbers of all samples, one sample exhibiting a considerably lower number of total reads was dropped (Manure2, T0, fDNA) all other samples were subsampled to 53,844 reads to avoid biased results caused by variable sampling depths, and all further analyses were performed on the subsampled datasets.
Bacterial as well as archaeal compositions were investigated over time (T0–T3) at either the family (bacteria) or genus level (archaea). A higher resolution was chosen for archaea due to the lower number of encountered species. Log10‐transformed read numbers of different DNA types were plotted against each other to determine bacterial families that diverge most in read numbers among DNA types. Comparative analyses between community compositions of the various DNA fractions (fDNA versus iDNA versus totDNA) included determination of the OTU richness and of the Shannon diversity of total, shared and unique OTUs over time regarding all encountered OTUs and excluding rare species that were defined as any OTUs occurring in fewer than five reads per sample. Unique OTUs were defined as OTUs occurring only in that particular DNA type but not in any of the others. Shared OTUs were defined as OTUs occurring in all DNA types (fDNA, iDNA, totDNA). A Venn diagram was created, defining the numbers of OTUs being shared between each combination of the three DNA types (i.e., fDNA–totDNA, totDNA–iDNA, iDNA–fDNA).
DNA yields of different time points were compared applying nonparametric Mann–Whitney U tests for equal means using past version 3.22 (Hammer et al., 2001). To test for differences in numbers of total (bacteria and archaea), shared (bacteria) and unique (bacteria) OTUs as well as Shannon diversities including all time points of the respective samples within each treatment, Kruskall–Wallis tests for equal medians and Dunn's post hoc comparisons using Bonferroni‐corrected p‐values were carried out using past version 3.22 (Hammer et al., 2001).
To further compare associations between the different DNA types (fDNA versus. iDNA versus. totDNA) and between treatments (Rumen versus. Manure), separate nonmetric multidimensional scaling (NMDS) ordinations were conducted using past version 3.22 (Hammer et al., 2001) based on Bray–Curtis distances for bacteria and archaea. Differences within microbial communities were tested applying a PERMANOVA based on Bray–Curtis distances with 9,999 permutations and comparing pairs of groups via pairwise PERMANOVAs calculating Bonferroni‐corrected p‐values.
3. RESULTS
3.1. Reactor performance
AD efficiency was monitored via the quantification of generated methane. Reactors of both treatments exhibited an increase in methane production from T0 to T2 and a decrease until T3 (Figure S3), attesting to an active microbial community typical for anaerobic digesters incubated in batch mode. Accumulated methane amounts were significantly higher in Rumen than Manure treatments (94.8 ± 8.2 and 68.0 ± 11.3 Nml g−1 dry weight [DW], respectively).
3.2. DNA yield
Mean amounts of DNA (µg gDW−1) over the entire time‐course were highest for totDNA (Rumen 148 ± 37, Manure 222 ± 54), followed by iDNA (Rumen 97 ± 15, Manure 99 ± 23), fDNA (Rumen 56 ± 9, Manure 47 ± 9) and bDNA (Rumen 24 ± 3, Manure 27 ± 2). Summing up fDNA, bDNA and iDNA, Rumen and Manure samples did not differ significantly from the respective totDNA values (Rumen 187 ± 25 and Manure 197 ± 32 µg/g DW) although, if single time points are investigated, totDNA was significantly lower (Rumen T2, T3) or higher (Manure T3) than the sum of f + b+iDNA (p < .05) at three occasions (Figure S4). Measured totDNA and calculated f + b+iDNA both showed a time‐dependent trend of decrease that, however, was statistically not significant. Further results regarding amounts of DNA of the different DNA types as well as their value for the physiological activity of methanogenic archaea is given elsewhere (Nagler et al., 2020).
3.3. Bacteria
3.3.1. α‐Diversity
Within the subsampled 53,844 reads, rarefaction curves were more oblate for Manure samples than for Rumen samples. The steepest curves were generated using iDNA followed by totDNA and fDNA (Figure S5). Total OTU richness showed a time‐dependent decrease in all DNA types for Rumen (Figure 1a, top) and constant values for Manure (Figure 1b, top). These trends were also reflected in the numbers of OTUs that were shared among more than one DNA type (dark grey) while OTU richness of sequences unique to each DNA type remained more constant over time (light grey) (Figure 1a,b). The share of rare OTUs (fewer than five reads) was lowest in iDNA (Rumen 75.8 ± 1.4%; Manure: 64.9 ± 0.3%), followed by similar numbers for fDNA (Rumen 81.4% ± 1.5%, Manure 65.8 ± 1.8%) and totDNA (Rumen 79.3 ± 1.3, Manure 66.0 ± 0.9%). Mean total OTU richness over the whole experimental duration was three times higher in Rumen than Manure (Figure 1c). Generally, iDNA showed the highest OTU richness, followed by fDNA and totDNA, with statistically significant differences among all DNA types for Manure samples and among all DNA types excluding rare species for Manure and Rumen samples (Figure 1c). For both treatments, percentages of unique OTUs were generally highest for iDNA (p < .05) (Rumen: 18 ± 1%, Manure: 17 ± 2%), followed by totDNA (11 ± 2% and 13 ± 1%) and fDNA (9 ± 2% and 11 ± 2%) (Figure 1d, white). totDNA included the highest percentages of rare OTUs (Rumen 90%, Manure 72%), followed by fDNA (Rumen 81%, Manure 66%) and iDNA (Rumen 76%, Manure 65%), and mean OTU richness excluding rare species was highest for iDNA followed by fDNA and totDNA (Figure 1c). While common OTUs (i.e., OTUs with more than five reads) of fDNA samples contained similar percentages of OTUs unique to that DNA type than found for all OTUs, the percentages of unique OTUs largely increased in iDNA and decreased in totDNA considering only common OTUs (Figure 1d). Venn diagrams (Figure 1f) revealed that irrespective of the treatment and of the inclusion of rare species, highest OTU richness was observed in the pool shared by all DNA types and followed by those unique for iDNA or shared between iDNA and totDNA, while overlaps between totDNA and fDNA were scarce.
FIGURE 1.
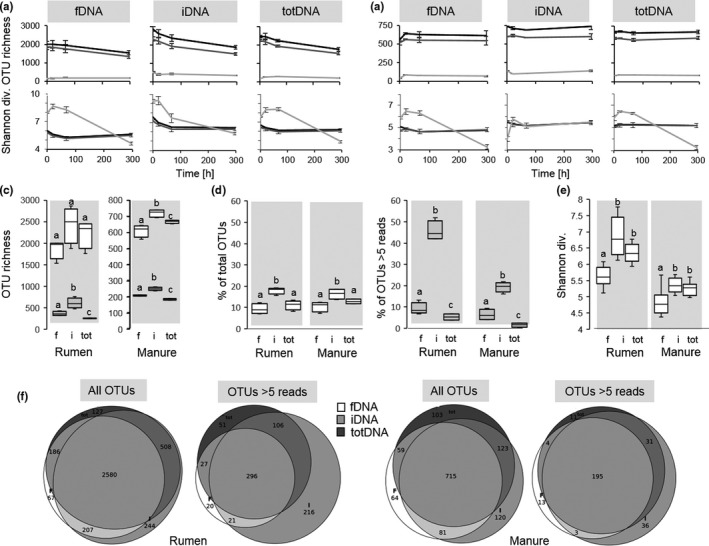
Top: mean numbers of total (black), shared (dark grey) and unique (light grey) operational taxonomic units (OTUs) (i.e., OTU richness) ± standard deviation (SD) (n = 3) of free extracellular DNA (fDNA), intracellular DNA (iDNA) and total DNA (totDNA), as well as mean Shannon diversities ± SD of the same for (a) Rumen and (b) Manure samples over time. Centre: (c) total OTU richness (white boxes) and OTU richness of common species (grey boxes; i.e., without rare species, >5 reads per OTU), (d) relative amounts of unique sequences (white boxes) and of common species (i.e., >5 reads/OTU) and (e) Shannon diversities of total OTUs over the whole experimental duration (n = 12). Different letters denote significant differences among DNA types within each treatment (p < .05). Bottom: (f) Venn diagrams depicting mean total OTU richness and OTU richness of common species (i.e., >5 reads per OTU) shared or unique for the various DNA types at all time points for Rumen and Manure samples, respectively
Shannon diversities of total (black) and shared (dark grey) OTUs reflected the trends and scales of total OTU richness (iDNA > totDNA >fDNA) (Figure 1a,b), with the exception that T3 Rumen samples showed similar Shannon diversities with regard to T2, while OTU richness decreased from T2 to T3 (Figure 1a). Moreover, Shannon diversities of unique (light grey) OTUs showed increased temporal variability as compared to total and shared OTUs, roughly increasing for all DNA types from T0 to T1 or T2 and decreasing thereafter (Figure 1a,b, bottom). Overall, Shannon diversities were significantly lower for fDNA than for iDNA and totDNA (Figure 1e).
3.3.2. Bacterial taxonomic compositions
Within both treatments and all DNA types (fDNA, iDNA, totDNA; Figure S1a), MBA03 represented the most abundant order, followed by the families Thermoanaerobacteraceae and Ruminococcaceae. For fDNA and totDNA, the next most abundant families were Lentimicrobiaceae, Petrotogaceae and the NB1‐n group of Tenericutes, whereas iDNA revealed other abundant families, including Lachnospiraceae and, towards later time points, Marinilabiaceae and Pseudomonadaceae (Figure 2a Rumen and Figure 2b Manure). Read numbers of bacterial families correlated significantly (p < .001) among all DNA types and between both treatments (Figure 3). Generally, Rumen and Manure samples showed similar over‐ or under‐representation of bacterial families among DNA types (Figure 3). Compared to fDNA, totDNA contained more reads from bacteria belonging to Heliobacteriaceae, Verrucomicrobia, Marinilabiaceae and the VadinBB60 group (Figure 3a). On the other hand, iDNA compared to totDNA contained more reads of bacteria belonging to Pseudomonadaceae and Marinilabiaceae and of many representatives of the Firmicutes (Streptococcaceae, Lachnospiraceae, Ruminococcaceae, Syntrophomonadaceae and other Firmicutes), while totDNA contained more reads of Tenericutes (Acholeplasmataceae and NB1‐n), Verrucomicrobia, Petrotogaceae and Lentimicrobiaceae (Figure 3b).
FIGURE 2.
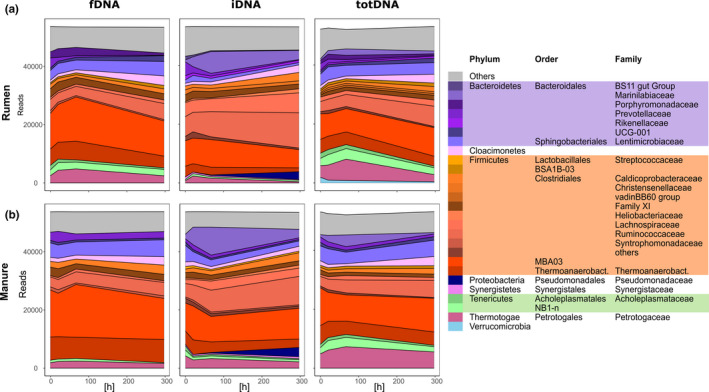
Mean bacterial abundances expressed as read counts over time (mean of n = 3) at the family level in the sequentially extracted free extracellular (fDNA) versus intracellular fraction (iDNA) and the directly extracted total DNA pool (totDNA) of (a) Rumen and (b) Manure samples. Only families representing at least 1% of all reads of the respective DNA type are shown [Colour figure can be viewed at wileyonlinelibrary.com]
FIGURE 3.
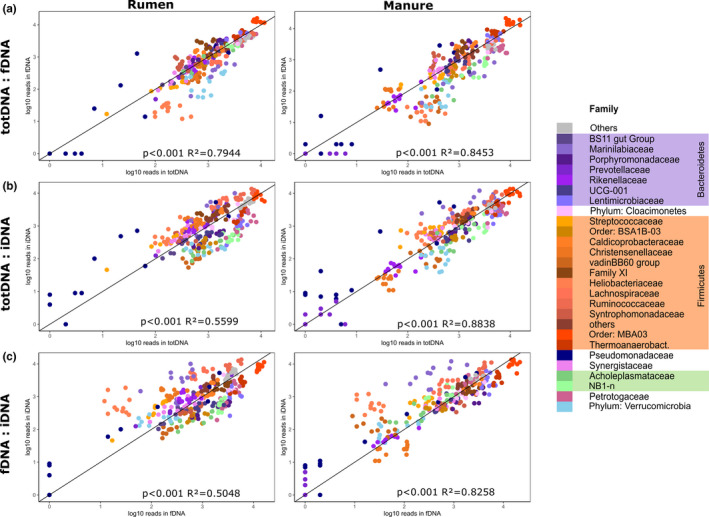
Scatter plots depicting log–log relationships in read numbers of bacterial families representing at least 1% of all reads. Solid lines represent a perfect log–log relationship with slope = 1. Samples diverging from this line to the top‐left or bottom‐right represent families over‐represented within the DNA type depicted on the y‐axis or x‐axis, respectively [Colour figure can be viewed at wileyonlinelibrary.com]
Comparing bacteria over‐represented in fDNA versus iDNA, mainly Marinilabiaceae and Heliobacteriaceae were largely overrepresented within iDNA.
Pseudomonadaceae and other representatives of the phylum Proteobacteria represented an important share of OTUs unique to iDNA together with specific Clostridiales (e.g., with Lachnospiraceae and Ruminococcaceae being prominent among others), Prevotellaceae, Bacillales and, for Manure samples, Fibrobacterales (Figure S6a Rumen and Figure S6b Manure). While unique OTUs found in fDNA were closely related to those in iDNA with some representatives of the orders Pseudomonadales, Clostridiales and Prevotellaceae, unique OTUs in totDNA were less abundant but revealed different groups such as Verrucomicrobia and, towards T3, Oligosphaerales.
The NMDS results for bacterial Rumen (Figure 4a) and Manure (Figure 4b) communities showed moderate stress with values of 0.112 and 0.130, respectively (Figure 4a,b). The PERMANOVA revealed overall significant differences (p Bonferroni < 0.01) between all DNA types. A temporal progression was clearly visible along coordinate 2 of Rumen samples with a distinct community composition at T0 for all DNA types (Figure 4a). In Manure samples, such a trend was only clear for iDNA, but not for fDNA or totDNA (Figure 4b). Within‐group variances estimated as convex hull areas were always greatest for iDNA, followed by totDNA and fDNA.
FIGURE 4.
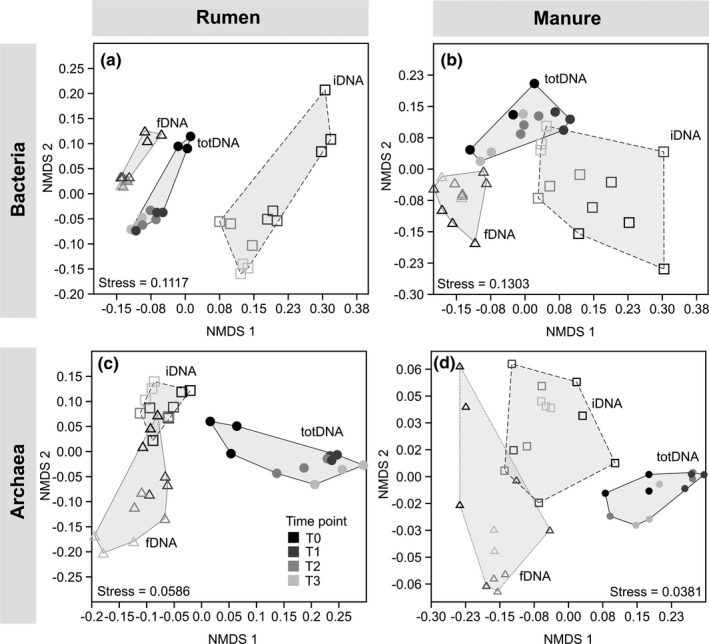
NMDS ordination plots depicting bacterial (a, b) and archaeal (c, d) communities of total DNA (totDNA, circles), intracellular DNA (iDNA, squares) and free extracellular DNA (fDNA, triangles) of the two treatments (Rumen [a, c] and Manure [b, d]) over time (shades of grey)
3.4. Archaea
3.4.1. α‐Diversity
OTU richness of all DNA types tended towards a decrease over time in Rumen and remained constant in Manure samples (Figure 5a). Significant differences in OTU richness among the DNA types were only found for totDNA Rumen samples, with significantly higher values compared to fDNA (Mann–Whitney U, p Bonferroni < 0.01; Figure 5b). Shannon diversity was higher in fDNA and iDNA than in totDNA, with constant or slightly decreasing time trends in fDNA and iDNA and increasing time trends in totDNA (Figure 5a,b).
FIGURE 5.
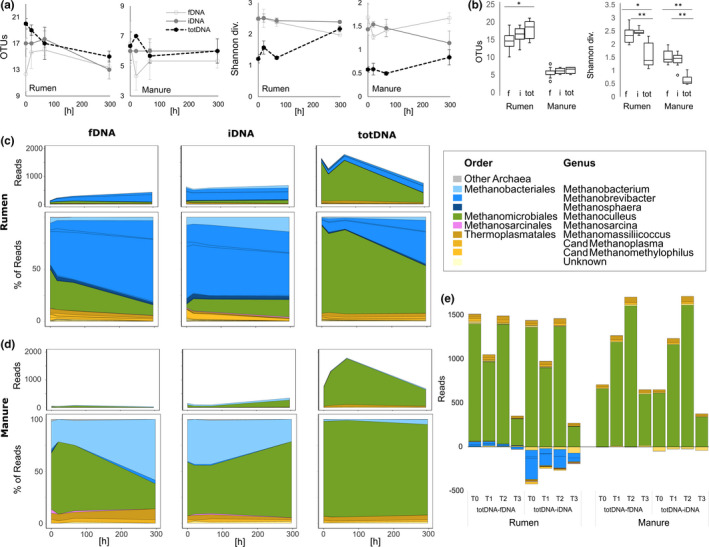
The archaeal community. (a) Mean OTU richness and Shannon diversities ± SD of each DNA fraction (fDNA and iDNA) and of totDNA over time and (b) summarized over the whole experimental duration. Boxes differing significantly from each other are indicated with an asterisk (p < .05). (c, d) Archaeal absolute and relative sequence read counts within (c) Rumen and (d) Manure samples at the genus level in the various DNA types over time. (e) Over‐represented (positive values) and under‐represented (negative values) genera within totDNA in comparison to iDNA and fDNA, respectively [Colour figure can be viewed at wileyonlinelibrary.com]
3.4.2. Archaeal taxonomic composition
Archaeal communities were represented by a total of 24 OTUs and by 0.1% (Manure, fDNA) to 2.5% (Rumen, totDNA) of all sequenced reads and belonged to obligate or facultative methanogenic archaea (Methanobacteria, Methanomicrobia and Thermoplasmata). Highest archaeal read numbers were achieved for totDNA (Rumen 1,362 ± 397, Manure 1,133 ± 448), followed by iDNA (Rumen 606 ± 49, Manure 174 ± 101) and fDNA (Rumen 268 ± 111, Manure 52 ± 19) (Figure 5c). Methanoculleus bourgensis represented the most abundant archaeal OTU in all DNA types of Manure samples and in totDNA of Rumen samples. Relative abundances within fDNA and iDNA were considerably lower than in totDNA. Rather, fDNA and iDNA contained up to 80% of reads belonging to representatives of the order Methanobacteriales, with species of Methanobrevibacter and Methanosphaera being more abundant in Rumen and Methanobacterium in Manure (Figure 5d). Relating totDNA to fDNA and iDNA, respectively, Methanoculleus and most genera belonging to the Thermoplasmatales were over‐represented in totDNA, while Methanobacteriales were over‐represented especially in iDNA of Rumen samples (Figure 5e).
The NMDS for archaeal Rumen (Figure 4c) and Manure communities (Figure 4d) showed robust stress values of 0.0586 and 0.0381, respectively (Figure 4c,d). The PERMANOVA revealed overall significant differences (p Bonferroni < 0.01) between all DNA types. A temporal progression was clearly visible within fDNA and totDNA for Rumen samples but not for Manure samples.
4. DISCUSSION
4.1. Reactor performance
All bioreactors showed methane production curves typical for a batch‐approach featuring a single peak and a subsequent production drop during a phase of nutrient depletion (e.g., Hallaji et al., 2019). Methane production from lignocellulosic substrates requires a close interaction of a complex microbiome and this suggests that not only methanogenic archaea, as revealed by methane production, but also bacterial consortia were of pivotal and comparable performance in both treatments.
4.2. DNA yield
Comparing all time points and treatments, the calculated yield of sequentially extracted DNA (sum of f + b + iDNA) was comparable to that of directly extracted DNA (totDNA). Comparing single time points, the differences found at two time points confirm previous findings with higher DNA yields after a sequential DNA extraction (Ceccherini et al., 2009; Nagler, Insam, et al., 2018; Wagner et al., 2008). This is attributed to the repeated treatment steps applied to the solid sample (cells) during sequential extraction (see Figure S1b) that alter the physicochemical characteristics of the sample and the number of available binding sites on the anion‐exchange binding matrix capturing the DNA molecules dissolved in the extracts (Pietramellara et al., 2007). The number of DNA molecules exceeds the number of accessible binding sites in highly concentrated samples and the “excessive” DNA is washed out (Wagner et al., 2008) (“DNA dilution” effect). Likewise, the sample pretreatments have consequences in terms of extraction and cell lysing efficiency, particularly in complex environmental samples including anaerobic digesters. All these factors may explain differential totDNA yields as compared to f + b+iDNA, which were found on single occasions. The increased DNA yield for totDNA over f + b+iDNA on one occasion for one treatment might arise from altered conditions increasing the extraction efficiency of the totDNA extraction procedure or decreasing the efficiency of the sequential extraction.
The fact that totDNA and f + b+iDNA pool sizes decreased slightly over time hints towards a consumption of DNA as a carbon and nutrient source, although partial enzymatic degradation of fDNA by nucleases cannot be excluded (Levy‐Booth et al., 2007). First, iDNA from plant cells is released and quickly degraded, resulting in decreasing values after T0 (Manure: the straw used in this treatment is more easily degraded due to pretreatment) or T1 (Rumen: native, rather recalcitrant straw material was used). The patterns of fDNA and iDNA in comparison to totDNA suggest that the information regarding microbial communities stored in totDNA is influenced by the presence of a relevant amount of exDNA (e.g., during T2). In a batch approach, overall numbers of microbes and thus amounts of DNA from active organisms are considered to decrease after depletion of nutrients. This pattern is only visible in the iDNA fraction, while totDNA is suggested to contain high amounts of fDNA, masking much of the genetic information generally used to determine present microbial taxa (Ascher et al., 2009).
4.3. α‐Diversity
Due to the two chosen inocula, α‐diversity expressed as OTU richness but also estimated via rarefaction analysis was clearly higher in Rumen (rumen‐inoculum + manure‐inoculum derived from the biogas plant) than in Manure samples (manure‐inoculum from the biogas plant only). The time‐dependent decrease in α‐diversity as well as Shannon diversity in Rumen samples indicates that process conditions are unfavourable for the allochthonous rumen community. In Manure samples, a core consortium became established from a starved inoculum adapted to AD conditions, leading to constant diversities and OTU richness. Furthermore, in Rumen samples, fewer but more evenly abundant OTUs became established from T2 to T3 as OTU richnesses dropped while the Shannon index remained constant. Of note is the highly variable Shannon diversity of the unique sequences within all DNA types. While total and shared OTUs exhibited a similar diversity, the variable Shannon index of the unique sequences suggests the presence of many different species with constant abundance at the beginning and increasing abundance of some single species towards T3. In this way, formerly less abundant or rare species are gaining in abundance, taking over important functional roles and accounting for the stability of the anaerobic digester.
While the overall OTU richness was comparable between fDNA and iDNA, Shannon diversities and thus species abundances were lower in fDNA. A recently established model predicted that exDNA (or relic DNA, defined as totDNA minus iDNA) might bias biodiversity estimates if species abundance distributions of exDNA and iDNA fractions differ from each other (Lennon et al., 2018) and therefore the lower diversities in fDNA encountered here may generate biases in both habitats, if totDNA is used. In the present study, OTU richness differed between iDNA and totDNA in Manure samples, and, if rare species were excluded, in Manure as well as Rumen samples. In all cases, iDNA yielded significantly higher values as compared to totDNA. This suggests that OTU richness as observed from totDNA would have been generally underestimated in the Manure habitat but might have been underestimated in the Rumen habitat if only common species would have been investigated. This is well in line with the theoretical assumption that such events might arise if the exDNA fraction has a less even species abundance distribution than iDNA (Lennon et al., 2018). This finding underpins the sensitivity of the method, as it is able to yield highly resolved information from different environments, even though the studied environments were rather similar in many aspects (i.e., both are anaerobic biogas‐producing communities). Likewise, iDNA was always found to yield the highest numbers of unique OTUs and to share high numbers of sequences with totDNA, suggesting that both pools are harbouring similar communities but that iDNA offers a better resolution, also covering rare species.
4.4. Bacterial communities
The microbiome shared by all DNA types (fDNA, iDNA, totDNA; Figure S1a) represented typical orders for farm‐scale reactors and included a classical community performing AD (Calusinska et al., 2018; Deng et al., 2018).
iDNA showed a slight trend of higher OTU richness in Rumen samples and significantly higher OTU richness in Manure samples, presumably also causing the higher variabilities observed in the NMDS. The large area of iDNA convex hulls as well as the clear ordering of iDNA according to the sampled time point account for the greater variability of this DNA fraction over time and hints towards an increased ability of iDNA to track the temporal change in community composition as compared to fDNA and totDNA. This is also reflected in the clear differences in shared and unique OTUs, with higher percentages of shared OTUs in totDNA and unique OTUs in iDNA, leading to a “masking effect” by the highly abundant fDNA in the sequenced totDNA. This is probably due to methodological issues during downstream analysis such as PCR competition or differential PCR amplification of highly abundant sequences prior to amplicon sequencing (von Wintzingerode et al., 1997), but the exact reason for this finding needs further investigation. Many of the effected reads seem to derive from abundant sequences being present (also) in the extracellular fraction of totDNA. This is supported by the higher similarity of totDNA and fDNA bacterial communities in the NMDS (i.e., being placed closely together on the more informative axis), by higher OTU richness and sharing of common OTUs in iDNA as opposed to totDNA, and by the comparison and the correlation of the most important bacterial families in both totDNA and fDNA. More specifically, DNA sequences being more abundant in fDNA and totDNA than in iDNA revealed the occurrence of Lentimicrobiaceae, strictly anaerobic, Gram‐negative bacteria often isolated from anaerobic digesters (Calusinska et al., 2018). Such sequences found in fDNA may be actively extruded or derive from lysed cells (Nagler, Insam, et al., 2018). The latter may predominate if fDNA > iDNA (i.e., more DNA is located outside than inside of cell walls). Looking at total DNA (Figure S4), this was the case at T2 and T3 when nutrients were exhausted (cf. Figure S3) and, thus, specific organisms were prone to cell lysis. It may be argued that at least for these two time points totDNA contained considerable amounts of exDNA (i.e., DNA from previously lysed cells). Thus, the “classical” direct extraction of totDNA does not reflect the microbiota thriving at the sampling time. Therefore, our findings support both the suitability of our proposed sequential fine‐tuned DNA approach and the importance of monitoring studies of different environments involving the analyses of multiple sampling points to draw a complex picture made up of different snapshots (Nannipieri et al., 2019).
Due to the removal of exDNA prior to extraction and sequencing of iDNA, it is cleared from this masking effect and less abundant DNA, representative of intact cells, is instead sequenced, resulting in higher diversities and a differing bacterial composition. Acetogenic (e.g., Lachnospiraceae, Pseudomonadaceae, Campylobacteraceae), specialized hydrolytic and fibrolytic (e.g., Marinilabiaceae, Ruminococcaceae, Fibrobacteraceae, Prevotellaceae) as well as syntrophic oxidizing (Synergistaceae) and photoheterotrophic bacteria (Heliobacteriaceae) were more abundant in or unique to iDNA. All these families are important representatives of the rumen microbial community and their abundance is highly dependent on the diet of the animal (Henderson et al., 2015). For example, Prevotellaceae and Ruminococcaceae were found to be abundant in cattle fed a highly fibrous diet (Latham et al., 2018).
totDNA samples, however, contained higher read numbers and some unique sequences belonging to the closely related Lentisphaerae and Verrucomicrobia that are both assumed to anaerobically degrade cellobiose and other carbohydrates (Zoetendal et al., 2003). This may again be explained by technical issues (e.g., DNA extraction and/or PCR competition) but might also be attributed to sequences being present within the bDNA fraction that has not been subject to sequencing in the present study. Similarly, the so‐called “DNA‐dilution” and “method‐result” effects dependent on the method used (Nannipieri et al., 2019) need to be taken into account when interpreting our findings. Higher read numbers of Tenericutes within totDNA and, by contrast, of Firmicutes within iDNA may suggest higher lysing efficiency of the sequential DNA‐extraction approach that might increase the yield of bacteria with robust cell walls (e.g., Firmicutes), while within totDNA, sequences of more easily lysed bacteria (e.g., Tenericutes) are obtained, yielded to a higher percentage share.
4.5. Archaeal communities
As expected, increased archaeal diversities and OTU richness were detected in Rumen as compared to Manure samples. Due to inoculation with fresh rumen liquid, the percentages of reads classified as Methanobrevibacter sp. and Methanosphaera sp. were increased. Both genera belong to the order Methanobacteriales and mostly perform hydrogenotrophic methanogenesis, as with the most abundant genus Methanoculleus of the order Methanomicrobiales. Time trends in species richness confirmed the formation of an adapted biogas‐consortium within Manure samples and the disappearance of rumen‐related species over time within Rumen samples. Although Methanoculleus was the most abundant archaeon detected within totDNA, the discriminatory investigation of fDNA and iDNA provided a different and more detailed picture, suggesting that at T0 this genus was not prominent within iDNA and was more abundant in fDNA, whereas it gained abundance over time in iDNA, building up in biomass, and lost biomass in fDNA. This observation might be explained in terms of microbial turnover as a function of time during the AD process. It is known that Methanoculleus are the most prevalent species under high ammonia conditions dominated by syntrophic acetate oxidation, as they tolerate higher ammonia levels than acetoclastic methanogens (Manzoor et al., 2016; Westerholm et al., 2012).
An important physiological difference between Methanoculleus bourgensis on the one hand and Methanobrevibacter sp. and Methanosphaera sp. on the other is evident from their Gram‐staining behaviour. Unlike bacteria, archaea possess a pseudopeptidoclycan cell wall and their Gram stain response depends on the presence of an outer layer of protein (Gram‐negative) or a particularly thick cell wall (Gram‐positive) (Beveridge & Schultze‐Lam, 1996). While Methanoculleus bourgensis stains Gram‐negative, Methanobacteriales stain Gram‐positive. As mentioned above, our proposed sequential extraction yielded higher amounts of DNA, also due to an increased cell lysis efficiency. Obviously, these Gram‐positive Methanobacteria were resistant to the classical, direct extraction of totDNA, resulting in a lower abundance in these samples. On the other hand, Methanoculleus lysed more easily, resulting in a bias towards this genus within the totDNA pool. Through the higher lysing efficiency, this bias is eliminated in our proposed sequential extraction method and a more accurate picture of all occurring microorganisms is achieved. This is also supported by the NMDS, where fDNA and iDNA clustered closer together as compared to totDNA. While this technical issue might be of relevance for other microbial groups too, it is visible and assessable only at a higher level of resolution and requires a more in‐depth investigation in future studies.
In summary, our fine‐tuned DNA extraction approach coupled with high‐throughput Illumina sequencing revealed considerable taxonomic differences between the intracellular DNA fraction (iDNA) and the total DNA pool (totDNA). Furthermore, the free extracellular DNA fraction (fDNA) is suggested to (a) contain genetic information linking the iDNA fraction to the totDNA pool, and/or (b) mask important genetic information specific for the iDNA fraction, which is not assessable by sequencing the directly extracted totDNA. Investigating AD microbiomes as an example, the classical totDNA yield was clearly influenced by these fDNA sequences and thus did not reliably reflect the microbial composition of actually intact cells, but rather provided information on the most abundant genera, independently of whether they were abundant within intact cells or detectable via DNA in the sample matrix. iDNA showed a more resolved picture of bacterial diversity patterns over time compared to totDNA.
Our results support previous findings on the quantitative relevance of the extracellular fraction (fDNA) and provide evidence regarding its qualitative influence. In fact, our findings suggest that (a) exDNA (fDNA) qualitatively biases AD microbiome studies that thus so far have commonly been performed on directly extracted totDNA and (b) iDNA might thus be the appropriate DNA fraction to gain reliable genetic information of the present (and potentially active) microbial community of a habitat, as it is cleared from the exDNA‐dependent masking effect. Our findings emphasize the importance of discriminating between exDNA and iDNA that might not only apply to AD‐related microbial communities, but might be of considerable relevance for many other habitats as well.
It remains to be clarified whether the observed masking effect of exDNA over iDNA in the total DNA pool (totDNA) is a general pattern, especially in complex habitats with longer microbial turnover rates such as soil. In the present study, fine trends in microbial community patterns over time showed this masking effect, while coarser trends such as the comparison of two different habitats seem relatively constant. Additional investigation may show whether discriminating between different DNA types is generally more important for studies at high resolution or if it is also influential on coarser patterns.
To complete the overall picture and allow for more general statements, bDNA as the missing link possibly explaining the unique sequences found in totDNA should be investigated together with all other DNA types within similar but also different environments. Furthermore, we suggest our approach as a powerful tool to further investigate rare taxa within complex microbiomes, assumed to potentially play key roles in ecosystem functioning (Nannipieri et al., 2019).
The differentiated analysis of exDNA and iDNA further allows calculation of the recently proposed fDNA/iDNA ratio as a measure of microbial activity and physiology at the level of gene abundances (Nagler, Podmirseg, et al., 2018; Nagler et al., 2020). In environments with a high microbial turnover rate, iDNA but also fDNA track active microbial cells, as long as the community is not facing high levels of cell lysis (Nagler et al., 2020). However, in environments with less overall microbial activity, such tracking might be influenced by inactive and also intact cells that contain iDNA (e.g., spores, dead or dormant cells), representing another field of research that has yet to be studied. In this regard, it might be reasonable to investigate the application of this ratio at the level of OTU abundances. In combination with RNA‐based analyses (cDNA‐NGS; with all their advantages and limits—Blazewicz et al., 2013), such an approach might be appropriate to assess the real physiological status of the potentially living microbial populations (iDNA, intact cells) and to discriminate between dormant and active populations (Blagodatskaya & Kuzyakov, 2013).
AUTHOR CONTRIBUTIONS
M.N. designed and performed research, analysed the data and wrote the manuscript. M.M. performed research and improved the manuscript. S.M.P. managed the project and developed the study, contributed to the research design, performed research and improved the manuscript. J.A.J. and H.I. both provided major inputs to the manuscript structure, interpreted the results and improved the manuscript style.
Supporting information
Fig S1‐S6
ACKNOWLEDGEMENTS
We thank the abattoir Mayr Fleisch, Natters, Tyrol and the biogas plant Gallspach, Upper Austria for providing us with Rumen liquid and anaerobic inoculum, respectively.
Nagler M, Podmirseg SM, Mayr M, Ascher‐Jenull J, Insam H. The masking effect of extracellular DNA and robustness of intracellular DNA in anaerobic digester NGS studies: A discriminatory study of the total DNA pool. Mol Ecol.2021;30:438–450. 10.1111/mec.15740
DATA AVAILABILITY STATEMENT
The data sets analysed during the current study are available in the NCBI repository under BioProject PRJNA525751, BioSample accessions from SAMN11073782 to SAMN11073853 and SRA IDs from 11073782 to 11073853 (https://www.ncbi.nlm.nih.gov/sra/PRJNA525751).
REFERENCES
- Agnelli, A. , Ascher, J. , Corti, G. , Ceccherini, M. T. , Nannipieri, P. , & Pietramellara, G. (2004). Distribution of microbial communities in a forest soil profile investigated by microbial biomass, soil respiration and DGGE of total and extracellular DNA. Soil Biology & Biochemistry, 36, 859–868. 10.1016/j.soilbio.2004.02.004 [DOI] [Google Scholar]
- Agnelli, A. , Ascher, J. , Corti, G. , Ceccherini, M. T. , Pietramellara, G. , & Nannipieri, P. (2007). Purification and isotopic signatures (δ13C, δ15N, Δ14C) of soil extracellular DNA. Biology and Fertility of Soils, 44, 353–361. 10.1007/s00374-007-0213-y [DOI] [Google Scholar]
- Ascher, J. , Ceccherini, M. T. , Pantani, O. L. , Agnelli, A. , Borgogni, F. , Guerri, G. , Nannipieri, P. , & Pietramellara, G. (2009). Sequential extraction and genetic fingerprinting of a forest soil metagenome. Applied Soil Ecology, 42, 176–181. 10.1016/j.apsoil.2009.03.005 [DOI] [Google Scholar]
- Bakken, L. R. , & Frostegård, Å. (2006). Nucleic acid extraction from soil In Nannipieri P., & Smalla K. (Eds.), Nucleic acids and proteins in soil (pp. 49–73). Springer. [Google Scholar]
- Beveridge, T. J. , & Schultze‐Lam, S. (1996). The response of selected members of the archaea to the Gram stain. Microbiology, 142, 2887–2895. 10.1099/13500872-142-10-2887 [DOI] [PubMed] [Google Scholar]
- Blagodatskaya, E. , & Kuzyakov, Y. (2013). Active microorganisms in soil: Critical review of estimation criteria and approaches. Soil Biology and Biochemistry, 67, 192–211. 10.1016/j.soilbio.2013.08.024 [DOI] [Google Scholar]
- Blazewicz, S. J. , Barnard, R. L. , Daly, R. A. , & Firestone, M. K. (2013). Evaluating rRNA as an indicator of microbial activity in environmental communities: Limitations and uses. ISME Journal, 7, 2061–2068. 10.1038/ismej.2013.102 [DOI] [PMC free article] [PubMed] [Google Scholar]
- Calusinska, M. , Goux, X. , Fossépré, M. , Muller, E. E. L. , Wilmes, P. , & Delfosse, P. (2018). A year of monitoring 20 mesophilic full‐scale bioreactors reveals the existence of stable but different core microbiomes in bio‐waste and wastewater anaerobic digestion systems. Biotechnology for Biofuels, 11, 196 10.1186/s13068-018-1195-8 [DOI] [PMC free article] [PubMed] [Google Scholar]
- Caporaso, J. G. , Lauber, C. L. , Walters, W. A. , Berg‐Lyons, D. , Lozupone, C. A. , Turnbaugh, P. J. , Fierer, N. , & Knight, R. (2011). Global patterns of 16S rRNA diversity at a depth of millions of sequences per sample. Proceedings of the National Academy of Sciences of the United States of America, 108, 4516–4522. 10.1073/pnas.1000080107 [DOI] [PMC free article] [PubMed] [Google Scholar]
- Carini, P. , Marsden, P. J. , Leff, J. W. , Morgan, E. E. , Strickland, M. S. , & Fierer, N. (2016). Relic DNA is abundant in soil and obscures estimates of soil microbial diversity. Nature Microbiology, 2, 16242 10.1038/nmicrobiol.2016.242 [DOI] [PubMed] [Google Scholar]
- Ceccherini, M. T. , Ascher, J. , Agnelli, A. , Borgogni, F. , Pantani, O. L. , & Pietramellara, G. (2009). Experimental discrimination and molecular characterization of the extracellular soil DNA fraction. Antonie Van Leeuwenhoek International Journal of General and Molecular Microbiology, 96, 653–657. 10.1007/s10482-009-9354-3 [DOI] [PubMed] [Google Scholar]
- Cheng, M. , Cook, A. E. , Fukushima, T. , & Bond, P. L. (2011). Evidence of compositional differences between the extracellular and intracellular DNA of a granular sludge biofilm. Letters in Applied Microbiology, 53, 1–7. 10.1111/j.1472-765X.2011.03074.x [DOI] [PubMed] [Google Scholar]
- Chroňáková, A. , Ascher, J. , Jirout, J. , Ceccherini, M. T. , Elhottová, D. , Pietramellara, G. , & Šimek, M. (2013). Cattle impact on composition of archaeal, bacterial, and fungal communities by comparative fingerprinting of total and extracellular DNA. Biology and Fertility of Soils, 49, 351–361. 10.1007/s00374-012-0726-x [DOI] [Google Scholar]
- Corinaldesi, C. , Danovaro, R. , & Dell'Anno, A. (2005). Simultaneous recovery of extracellular and intracellular DNA suitable for molecular studies from marine sediments. Applied and Environmental Microbiology, 71, 46–50. 10.1128/AEM.71.1.46-50.2005 [DOI] [PMC free article] [PubMed] [Google Scholar]
- Corinaldesi, C. , Tangherlini, M. , Manea, E. , & Dell'Anno, A. (2018). Extracellular DNA as a genetic recorder of microbial diversity in benthic deep‐sea ecosystems. Scientific Reports, 8, 1839 10.1038/s41598-018-20302-7 [DOI] [PMC free article] [PubMed] [Google Scholar]
- Deng, Y. , Huang, Z. , Ruan, W. , Miao, H. , Shi, W. , & Zhao, M. (2018). Enriching ruminal polysaccharide‐degrading consortia via co‐inoculation with methanogenic sludge and microbial mechanisms of acidification across lignocellulose loading gradients. Applied Microbiology and Biotechnology, 102, 3819–3830. 10.1007/s00253-018-8877-9 [DOI] [PubMed] [Google Scholar]
- Dominiak, D. M. , Nielsen, J. L. , & Nielsen, P. H. (2011). Extracellular DNA is abundant and important for microcolony strength in mixed microbial biofilms. Environmental Microbiology, 13, 710–721. 10.1111/j.1462-2920.2010.02375.x [DOI] [PubMed] [Google Scholar]
- Fierer, N. (2017). Embracing the unknown: Disentangling the complexities of the soil microbiome. Nature Reviews Microbiology, 15, 579–590. 10.1038/nrmicro.2017.87 [DOI] [PubMed] [Google Scholar]
- Gómez‐Brandón, M. , Ascher‐Jenull, J. , Bardelli, T. , Fornasier, F. , Fravolini, G. , Arfaioli, P. , Ceccherini, M. T. , Pietramellara, G. , Lamorski, K. , Sławiński, C. , Bertoldi, D. , Egli, M. , Cherubini, P. , & Insam, H. (2017). Physico‐chemical and microbiological evidence of exposure effects on Picea abies – Coarse woody debris at different stages of decay. Forest Ecology and Management, 391, 376–389. 10.1016/j.foreco.2017.02.033 [DOI] [Google Scholar]
- Gómez‐Brandón, M. , Ascher‐Jenull, J. , Bardelli, T. , Fornasier, F. , Sartori, G. , Pietramellara, G. , Arfaioli, P. , Egli, M. , Beylich, A. , Insam, H. , & Graefe, U. (2017). Ground cover and slope exposure effects on micro‐ and mesobiota in forest soils. Ecological Indicators, 80, 174–185. 10.1016/j.ecolind.2017.05.032 [DOI] [Google Scholar]
- Gustave, W. , Yuan, Z.‐F. , Sekar, R. , Toppin, V. , Liu, J.‐Y. , Ren, Y.‐X. , Zhang, J. , & Chen, Z. (2019). Relic DNA does not obscure the microbial community of paddy soil microbial fuel cells. Research in Microbiology, 170, 97–104. 10.1016/j.resmic.2018.11.002 [DOI] [PubMed] [Google Scholar]
- Hallaji, S. M. , Kuroshkarim, M. , & Moussavi, S. P . (2019). Enhancing methane production using anaerobic co‐digestion of waste activated sludge with combined fruit waste and cheese whey. BMC Biotechnology, 19(1), 10.1186/s12896-019-0513-y [DOI] [PMC free article] [PubMed] [Google Scholar]
- Hammer, Ø. , Harper, D. A. T. , & Ryan, P. D. (2001). past: Paleontological statistics software package for education and data analysis. Palaeontologia Electronica, 4, 9. [Google Scholar]
- Henderson, G. , Cox, F. , Ganesh, S. , Jonker, A. , Young, W. , & Janssen, P. H. (2015). Rumen microbial community composition varies with diet and host, but a core microbiome is found across a wide geographical range. Scientific Reports, 5, 14567 10.1038/srep14567 [DOI] [PMC free article] [PubMed] [Google Scholar]
- Hupfauf, S. , Etemadi‐Shalamzari, M. , Insam, H. , & Podmirseg, S. M. (2017). coma – Comparative microbiome analysis. Retrieved from https://www.uibk.ac.at/microbiology/services/coma.html [Google Scholar]
- Laktionov, P. P. , Tamkovich, S. N. , Rykova, E. Y. , Bryzgunova, O. E. , Starikov, A. V. , Kuznetsova, N. P. , & Vlassov, V. V. (2004). Cell‐surface‐bound nucleic acids: Free and cell‐surface‐bound nucleic acids in blood of healthy donors and breast cancer patients. Annals of the New York Academy of Sciences, 1022, 221–227. 10.1196/annals.1318.034 [DOI] [PubMed] [Google Scholar]
- Latham, E. A. , Weldon, K. K. , Wickersham, T. A. , Coverdale, J. A. , & Pinchak, W. E. (2018). Responses in the rumen microbiome of Bos taurus and indicus steers fed a low‐quality rice straw diet and supplemented protein. Journal of Animal Science, 96, 1032–1044. 10.1093/jas/sky023 [DOI] [PMC free article] [PubMed] [Google Scholar]
- Lennon, J. T. , Muscarella, M. E. , Placella, S. A. , & Lehmkuhl, B. K. (2018). How, When, and Where Relic DNA Affects Microbial Diversity. mBio, 9(3), 10.1128/mbio.00637-18 [DOI] [PMC free article] [PubMed] [Google Scholar]
- Levy‐Booth, D. J. , Campbell, R. G. , Gulden, R. H. , Hart, M. M. , Powell, J. R. , Klironomos, J. N. , Pauls, K. P. , Swanton, C. J. , Trevors, J. T. , & Dunfield, K. E. (2007). Cycling of extracellular DNA in the soil environment. Soil Biology and Biochemistry, 39, 2977–2991. 10.1016/j.soilbio.2007.06.020 [DOI] [Google Scholar]
- Manzoor, S. , Schnürer, A. , Bongcam‐Rudloff, E. , & Müller, B. (2016). Complete genome sequence of Methanoculleus bourgensis strain MAB1, the syntrophic partner of mesophilic acetate‐oxidising bacteria (SAOB). Standards in Genomic Sciences, 11, 80 10.1186/s40793-016-0199-x [DOI] [PMC free article] [PubMed] [Google Scholar]
- Nagler, M. , Insam, H. , Pietramellara, G. , & Ascher‐Jenull, J. (2018). Extracellular DNA in natural environments: Features, relevance and applications. Applied Microbiology and Biotechnology, 102, 6343–6356. 10.1007/s00253-018-9120-4 [DOI] [PMC free article] [PubMed] [Google Scholar]
- Nagler, M. , Podmirseg, S. M. , Griffith, G. W. , Insam, H. , & Ascher‐Jenull, J. (2018). The use of extracellular DNA as a proxy for specific microbial activity. Applied Microbiology and Biotechnology, 102, 2885–2898. 10.1007/s00253-018-8786-y [DOI] [PMC free article] [PubMed] [Google Scholar]
- Nagler, M. , Podmirseg, S. M. , Mayr, M. , Ascher‐Jenull, J. , & Insam, H. (2019). PRJNA525751. NCBI sequence read archive Retrieved from https://www.ncbi.nlm.nih.gov/sra/PRJNA525751
- Nagler, M. , Podmirseg, S. M. , Mayr, M. , Ascher‐Jenull, J. , & Insam, H. (2020). Quantities of intra‐ and extracellular DNA reveal information about activity and physiological state of methanogenic Archaea. Frontiers in Microbiology, 11, 1894. [DOI] [PMC free article] [PubMed] [Google Scholar]
- Nannipieri, P. , Ascher‐jenull, J. , Ceccherini, M. T. , Pietramellara, G. , Renella, G. , & Schloter, M. (2019). Beyond microbial diversity for predicting soil functions: A mini review. Pedosphere, 30(1), 5–17. 10.1016/S1002-0160(19)60824-6 [DOI] [Google Scholar]
- Pietramellara, G. , Ascher, J. , Borgogni, F. , Ceccherini, M. T. , Guerri, G. , & Nannipieri, P. (2009). Extracellular DNA in soil and sediment: Fate and ecological relevance. Biology and Fertility of Soils, 45, 219–235. 10.1007/s00374-008-0345-8 [DOI] [Google Scholar]
- Pietramellara, G. , Ascher, J. , Ceccherini, M. T. , Nannipieri, P. , & Wenderoth, D. (2007). Adsorption of pure and dirty bacterial DNA on clay minerals and their transformation frequency. Biology and Fertility of Soils, 43, 731–739. 10.1007/s00374-006-0156-8 [DOI] [Google Scholar]
- Ramírez, G. A. , Jørgensen, S. L. , Zhao, R. , & D'Hondt, S. (2018). Minimal influence of extracellular DNA on molecular surveys of marine sedimentary communities. Frontiers in Microbiology, 9, 2969 10.3389/fmicb.2018.02969 [DOI] [PMC free article] [PubMed] [Google Scholar]
- Robe, P. , Nalin, R. , Capellano, C. , Vogel, T. M. , & Simonet, P. (2003). Extraction of DNA from soil. European Journal of Soil Biology, 39, 183–190. 10.1016/S1164-5563(03)00033-5 [DOI] [Google Scholar]
- Roose‐Amsaleg, C. L. , Garnier‐Sillam, E. , & Harry, M. (2001). Extraction and purification of microbial DNA from soil and sediment samples. Applied Soil Ecology, 18, 47–60. 10.1016/S0929-1393(01)00149-4 [DOI] [Google Scholar]
- Taberlet, P. , Coissac, E. , Hajibabaei, M. , & Rieseberg, L. H. (2012). Environmental DNA. Molecular Ecology, 21, 1789–1793. 10.1111/j.1365-294X.2012.05542.x [DOI] [PubMed] [Google Scholar]
- Torti, A. , Lever, M. A. , & Jørgensen, B. B. (2015). Origin, dynamics, and implications of extracellular DNA pools in marine sediments. Marine Genomics, 24, 185–196. 10.1016/j.margen.2015.08.007 [DOI] [PubMed] [Google Scholar]
- von Wintzingerode, F. , Göbel, U. B. , & Stackebrandt, E. (1997). Determination of microbial diversity in environmental samples: Pitfalls of PCR‐based rRNA analysis. FEMS Microbiology Reviews, 21, 213–229. 10.1111/j.1574-6976.1997.tb00351.x [DOI] [PubMed] [Google Scholar]
- Vuillemin, A. , Friese, A. , Alawi, M. , Henny, C. , Nomosatryo, S. , Wagner, D. , Crowe, S. A. , & Kallmeyer, J. (2016). Geomicrobiological features of ferruginous sediments from Lake Towuti, Indonesia. Frontiers in Microbiology, 7, 1007. [DOI] [PMC free article] [PubMed] [Google Scholar]
- Wagner, A. O. , Malin, C. , Knapp, B. A. , & Illmer, P. (2008). Removal of free extracellular DNA from environmental samples by ethidium monoazide and propidium monoazide. Applied and Environmental Microbiology, 74, 2537–2539. 10.1128/AEM.02288-07 [DOI] [PMC free article] [PubMed] [Google Scholar]
- Westerholm, M. , Levén, L. , & Schnürer, A. (2012). Bioaugmentation of syntrophic acetate‐oxidizing culture in biogas reactors exposed to increasing levels of ammonia. Applied and Environmental Microbiology, 78, 7619–7625. 10.1128/AEM.01637-12 [DOI] [PMC free article] [PubMed] [Google Scholar]
- Zoetendal, E. G. , Plugge, C. M. , Akkermans, A. D. L. , & de Vos, W. M. (2003). Victivallis vadensis gen. nov., sp. nov., a sugar‐fermenting anaerobe from human faeces. International Journal of Systematic and Evolutionary Microbiology, 53, 211–215. 10.1099/ijs.0.02362-0 [DOI] [PubMed] [Google Scholar]
Associated Data
This section collects any data citations, data availability statements, or supplementary materials included in this article.
Data Citations
- Nagler, M. , Podmirseg, S. M. , Mayr, M. , Ascher‐Jenull, J. , & Insam, H. (2019). PRJNA525751. NCBI sequence read archive Retrieved from https://www.ncbi.nlm.nih.gov/sra/PRJNA525751
Supplementary Materials
Fig S1‐S6
Data Availability Statement
The data sets analysed during the current study are available in the NCBI repository under BioProject PRJNA525751, BioSample accessions from SAMN11073782 to SAMN11073853 and SRA IDs from 11073782 to 11073853 (https://www.ncbi.nlm.nih.gov/sra/PRJNA525751).